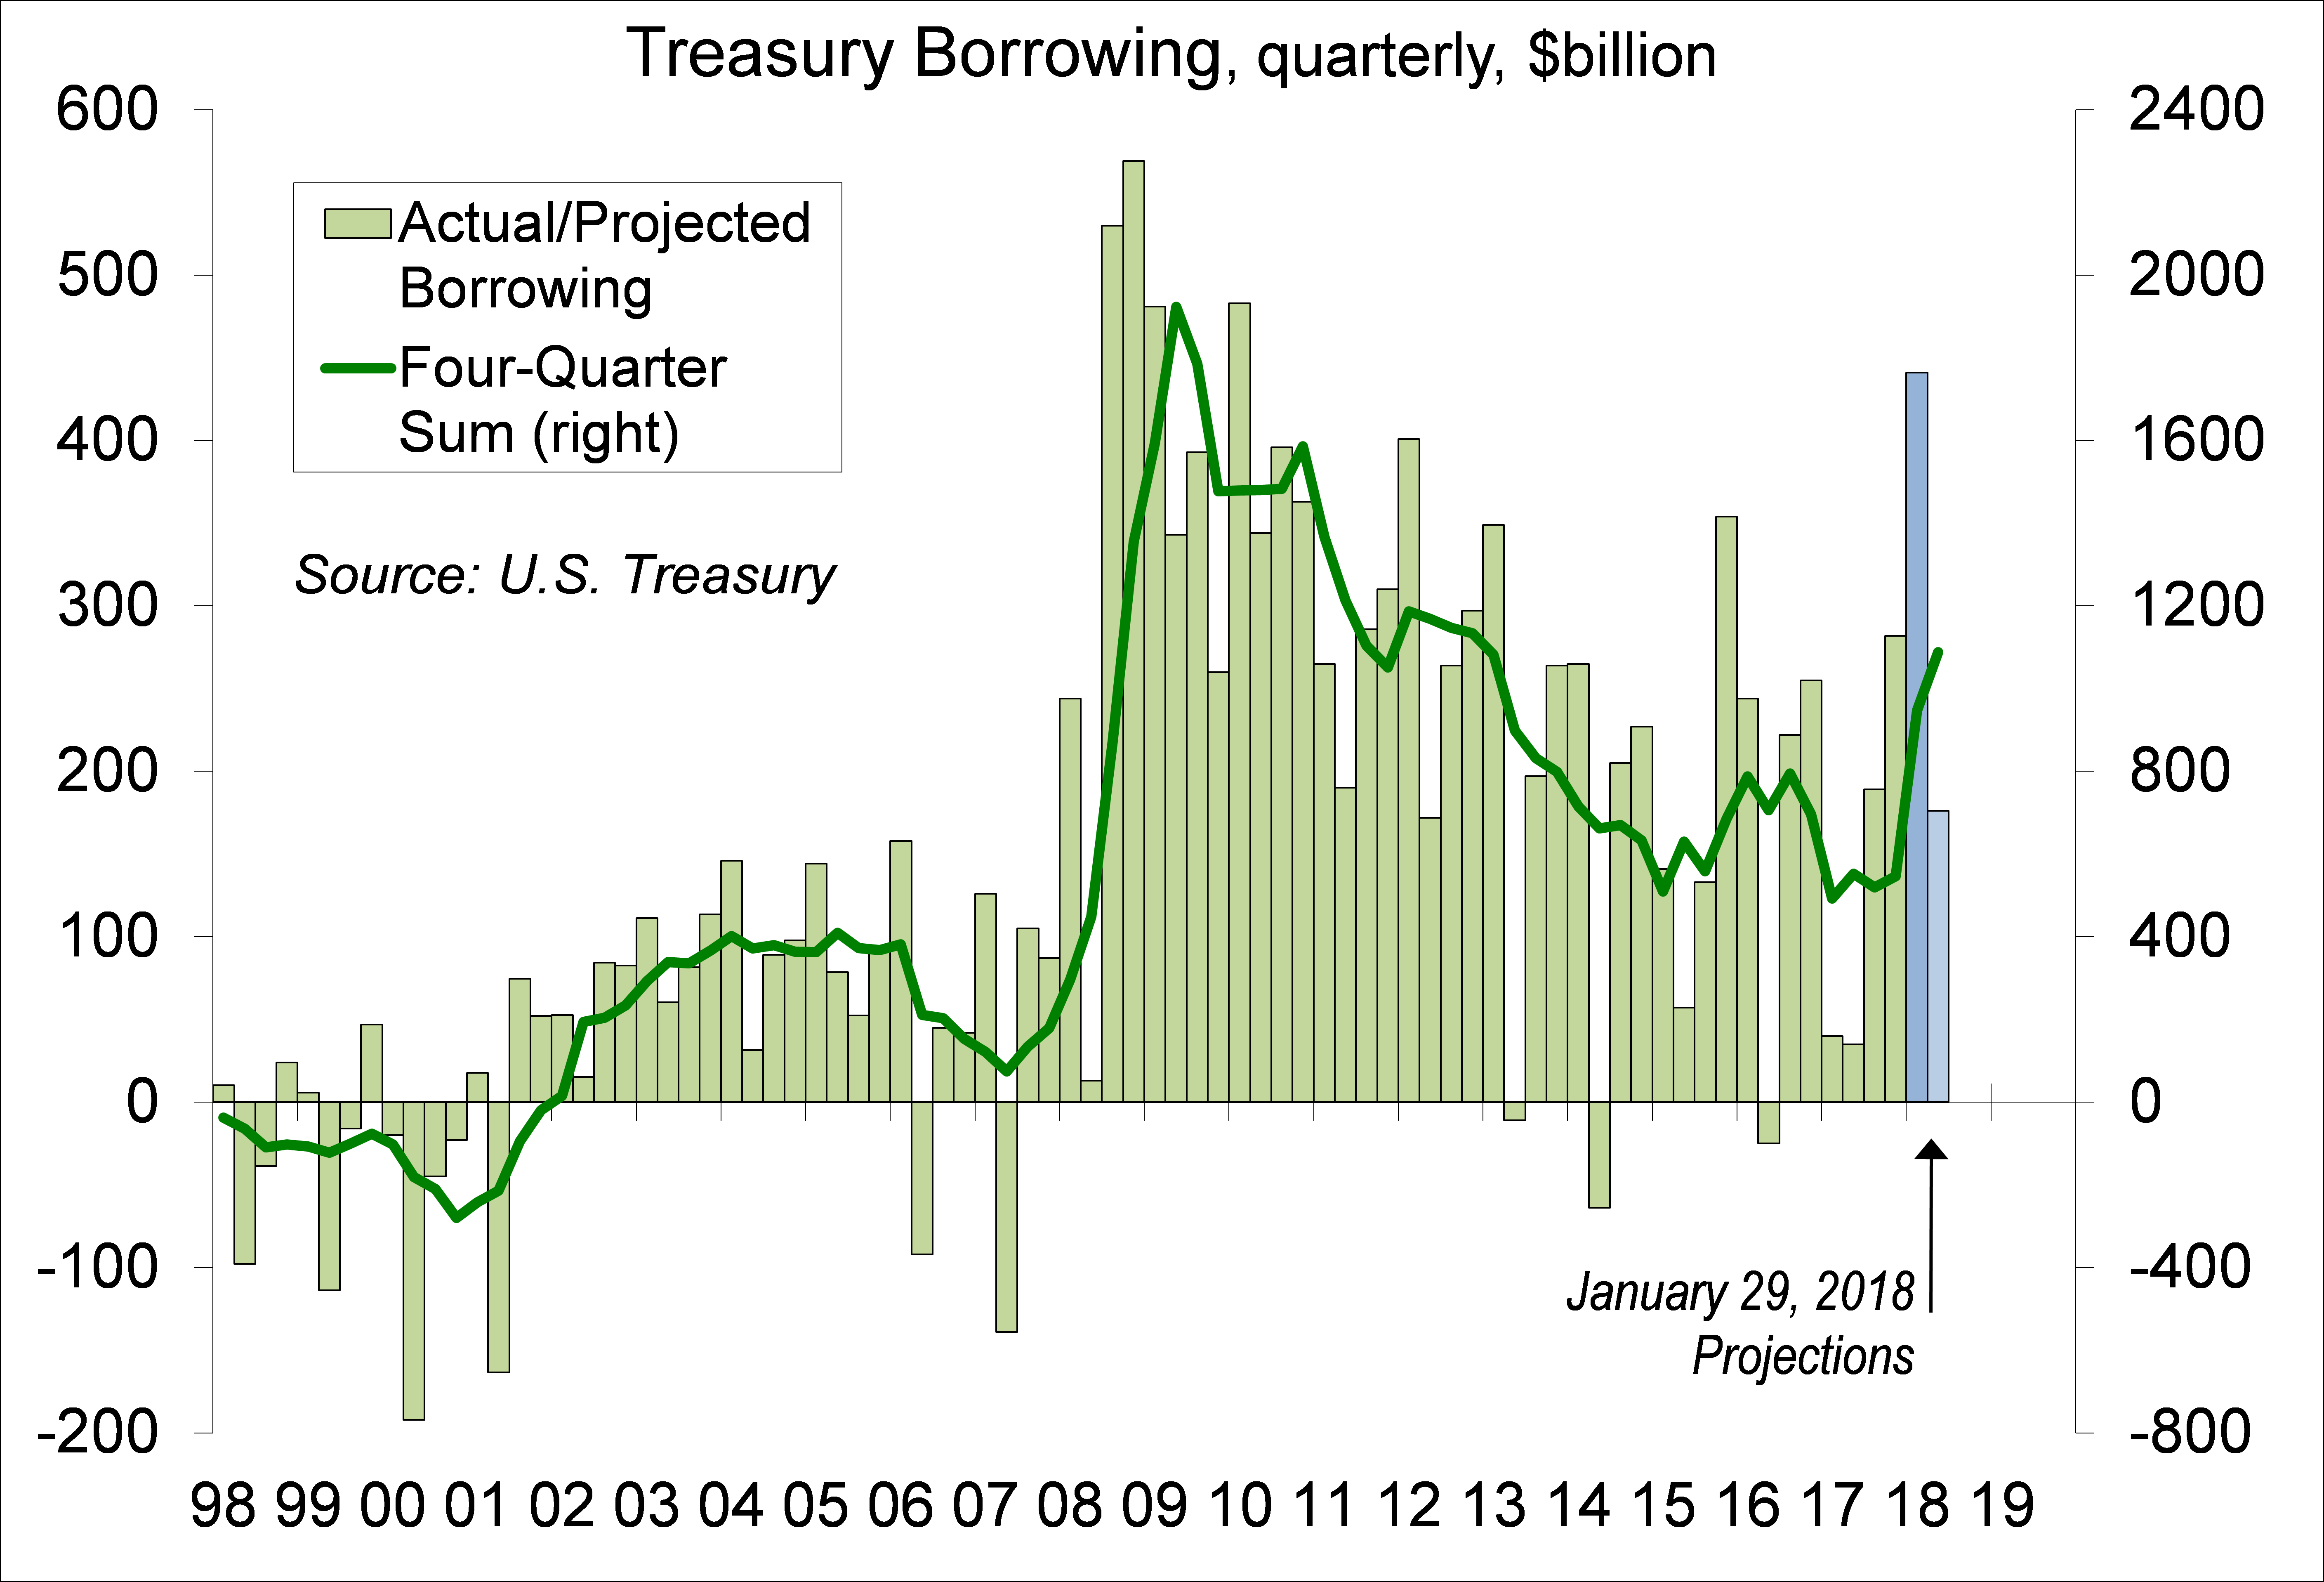
Last week, Treasury announced that it expects to borrow $617 billion in the first half of 2018, vs. $75 billion in the first two quarters of 2017, and announced increases in the sizes of its regular monthly auctions of notes and bonds. It should then be no surprise why bond yields are rising.
Once a quarter, Treasury announces its expected borrowing need. It lays out the auction calendar and gives guidance on the sizes of the various auctions. These are expectations, actual borrowing will depend on tax receipts and the amount of cash it chooses to hold at the end of the quarter. However, while borrowing in 1H18 may be higher or lower than anticipated, the expectations is that there will be a lot more borrowing this year.

Click here to enlarge
One might expect that to be related to the tax bill. Tax losses were more valuable in 2017, so much of what was underwater should have been written off, reducing federal tax receipts. However, the monthly Treasury statements show an increase in revenues for the Oct-Dec quarter relative to a year earlier.
Click here to enlarge
Lower tax payments may show up in the January figures (the Treasury Budget figures will released on February 12).
Government borrowing rose sharply during the financial crisis and bond yields fell. However, demand for safe assets surged during the crisis. Moreover, the increase in government borrowing was offset by a massive deleveraging in the financial sector. Net national borrowing was little changed during the downturn. The situation now is completely different.
Click here to enlarge
Nonfarm payrolls rose by 200,000 in the initial estimate for January, a bit stronger than expected, but we also had a downward revision to the two previous months (making it about a wash relative to expectations). Still, this is January that we’re talking about. We lost more than three million jobs before seasonal adjustment, somewhat more than a year ago. Annual benchmark revisions were moderate by historical standards, but showed a stronger pace of job gains in 2016 (2.34 million) and 2017 (2.173 million) than was reported earlier.
Average hourly earnings rose 0.3% in January, as expected, but upward revisions to October and November brought the year-over-year increase to 2.9%, the highest since May 2009. The Employment Cost Index, up 2.6% over the 12 months ending in December, is a better measure of labor cost pressures, but one still needs to account for productivity growth (unfortunately, a -0.1% annual rate in the preliminary estimate for 4Q17). Given the drop in corporate tax rates, rising labor cost pressures need not be too worrisome in the near term. However, while near-term improvement in job conditions is welcome, we’re on an unsustainable trajectory.
Despite tighter monetary policy, credit conditions have gotten easier over the last year or two. This is a dilemma for the Fed. Tighter monetary policy will raise the short-end of the yield curve. Increased government borrowing will raise the long end.
The opinions offered by Dr. Brown should be considered a part of your overall decision-making process. For more information about this report – to discuss how this outlook may affect your personal situation and/or to learn how this insight may be incorporated into your investment strategy – please contact your financial advisor or use the convenient Office Locator to find our office(s) nearest you today.
All expressions of opinion reflect the judgment of the Research Department of Raymond James & Associates (RJA) at this date and are subject to change. Information has been obtained from sources considered reliable, but we do not guarantee that the foregoing report is accurate or complete. Other departments of RJA may have information which is not available to the Research Department about companies mentioned in this report. RJA or its affiliates may execute transactions in the securities mentioned in this report which may not be consistent with the report's conclusions. RJA may perform investment banking or other services for, or solicit investment banking business from, any company mentioned in this report. For institutional clients of the European Economic Area (EEA): This document (and any attachments or exhibits hereto) is intended only for EEA Institutional Clients or others to whom it may lawfully be submitted. There is no assurance that any of the trends mentioned will continue in the future. Past performance is not indicative of future results.
© Raymond James
© Raymond James
Read more commentaries by Raymond James