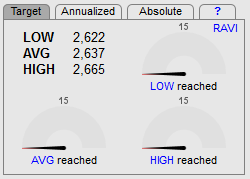
Those of you who have been following us since 2010 will identify us a perma-bulls. Even in the depths of the ECRI 2012 /Hussman recession calls we were firmly bullish on the US economy and stock market – quite contrary to the popular consensus at the time. Those subscribers who have been diligently following the RAVI SP500 forecasting model and its consistently accurate bullish forecasts will have noticed this year that all the targets we have set for 3Q2018 have been met on our Dashboard:

This means, for the first time since we have been running this model, that RAVI SP500 valuations have finally run ahead of themselves. This is not to say this exuberance will not continue for some time, but it is a warning for those who like to deploy valuation risk metrics in their asset allocation models.
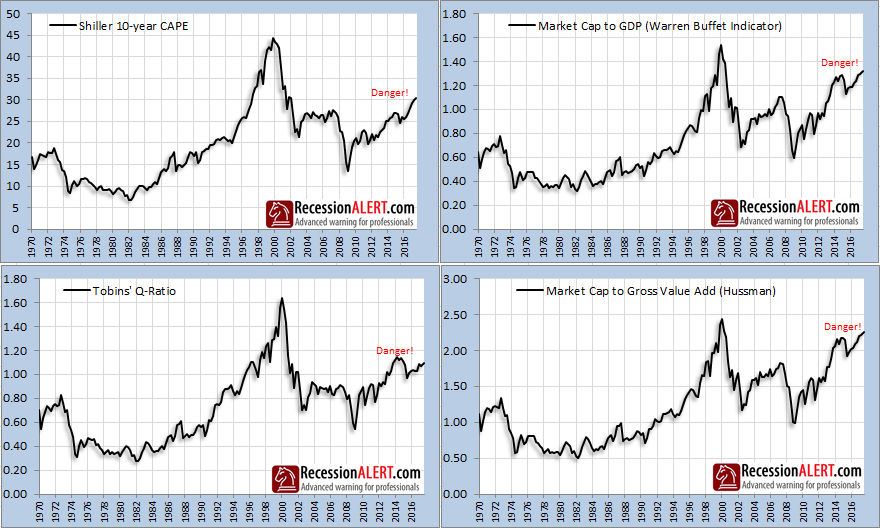
Now for a long time, various valuation models have been at elevated levels. Here are a few below:
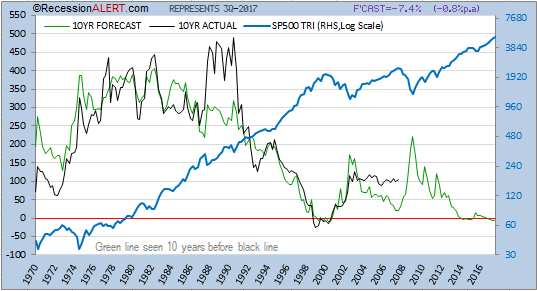
Despite these elevated levels, RAVI was forecasting bullish returns for 2016 and 2017. All these models above have very good correlations to 10-14 year ahead SP500 returns and in many instances of late were actually forecasting muted to negative 10-year ahead returns. But just because a valuation model is forecasting a negative 10-year return doesn’t mean that 1-3 year returns will be poor! This mistake is consistently made by forecasters! A case in point is shown below, using Warren Buffets famous valuation metric. Since 2014 this model has been persistently forecasting low to negative 10-year ahead returns – but that didn’t stop the SP500 roaring ahead!
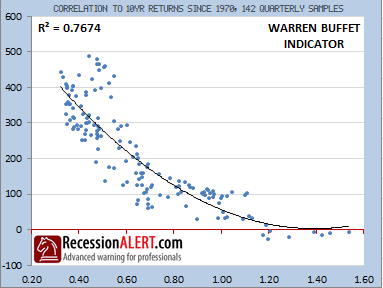
Does this mean Warren Buffets indicator is useless? Of course not – it means it’s been interpreted incorrectly! In all likelihood, in 10 years’ time we come back to this chart and remark on how accurate it was since the black line (actual 10-yr returns) will closely track the green line (the forecasted 10-year returns.) As far as a long-run forecasting models go, the Buffet indicator, whilst not the best, is fairly respectable with an r-squared of 0.76 – so it would be surprising if that black line doesn’t hug the green line closely!
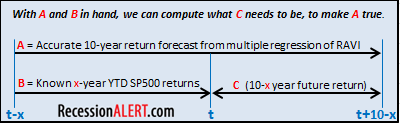
There is no model that can directly predict short-term SP500 returns with meaningful accuracy. But you can get pretty damn close (as these things go) by deriving short term returns from accurate long-run models like the Buffet model. It works like this:
1.Find a really robust and accurate long-run (assume 10 year) forecasting valuation model (there are many)
2.Get the 10-year forecast from this model from nine years ago
3. Work out how much the SP500 has grown since this date 9 years ago
4. Subtract (3) from (2) to work out how much upside is left in the year ahead.
In fact we can apply this short-run look-ahead method to any x-year horizon, and this is what we do with the RAVI to compute 1/3/5 year look-ahead forecasts:
The important thing to bear in mind is that the current reading of a long-term valuation model, be it Buffet, Tobin-Q, Shiller P/E, Hussmans Market-cap to Gross Value Add etc. means absolutely nothing to short-to-medium term forecasts. What is important, is what this model was saying 7-10 years ago and how much the SP500 has eaten into those forecasted gains since then.
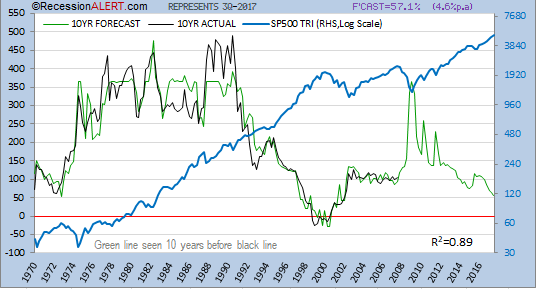
Now the RAVI long-run model has the following 10-year forecasting profile, which at 0.89 r-squared is pretty respectable:
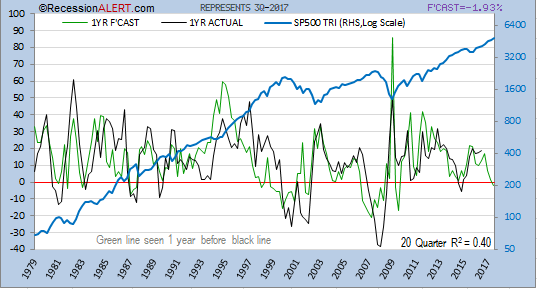
If we use the methodology described above to forecast 1-year ahead returns we get the following profile. I can tell you, an r-squared of 0.4 on such a short-run forecast is pretty decent as these things go. But quite obviously from the profile, you can see wide variances on occasion:
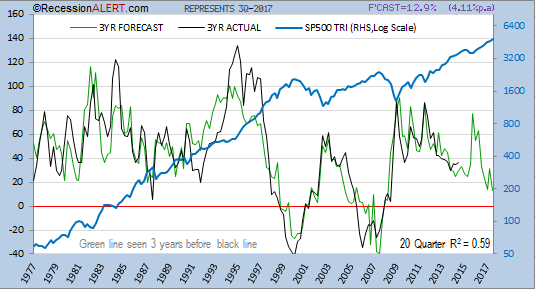
On a three year look-ahead things become rather respectable in terms of correlations for short run forecasts:
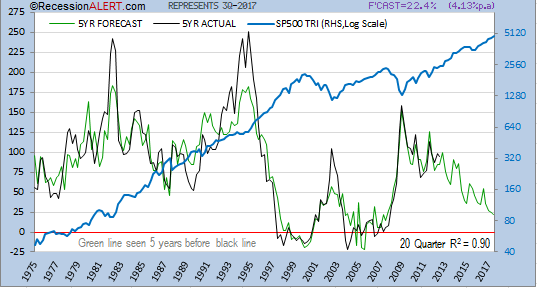
Five-year look-ahead accuracy is pretty remarkable given how close its correlation is to the accuracy of the 10-year forecast:
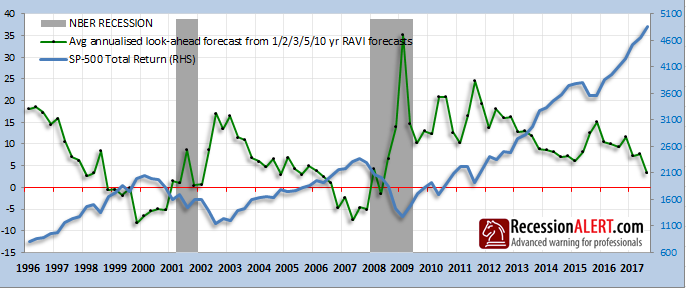
We can deduce that both the 5-year and the 3-year look-ahead models are forecasting around 4% annual growth for the SP500 from here on, which is pretty low. In fact it becomes pretty interesting to track the average annualized look-ahead forecast of all the models over time:
You can see that as the SP500 has been tracking upwards relentlessly, so the average annual forecasts have been declining of late. But more interesting is that when the average annual forecasts turn negative, it looks like, on the surface, we have a nice recession/bear market warning. Stock market valuation model as recessionary indicator – the idea is appealing!
So there you have it – we are in an era of weak forecasted SP500 returns with all the elevated risks associated with that. You need to decide if we are in a “new paradigm” of prolonged elevated valuations (its quite possible) and take your chances, or de-risk accordingly. Caveat Emptor
© 2016 RecessionAlert
Read more commentaries by RecessionALERT.com