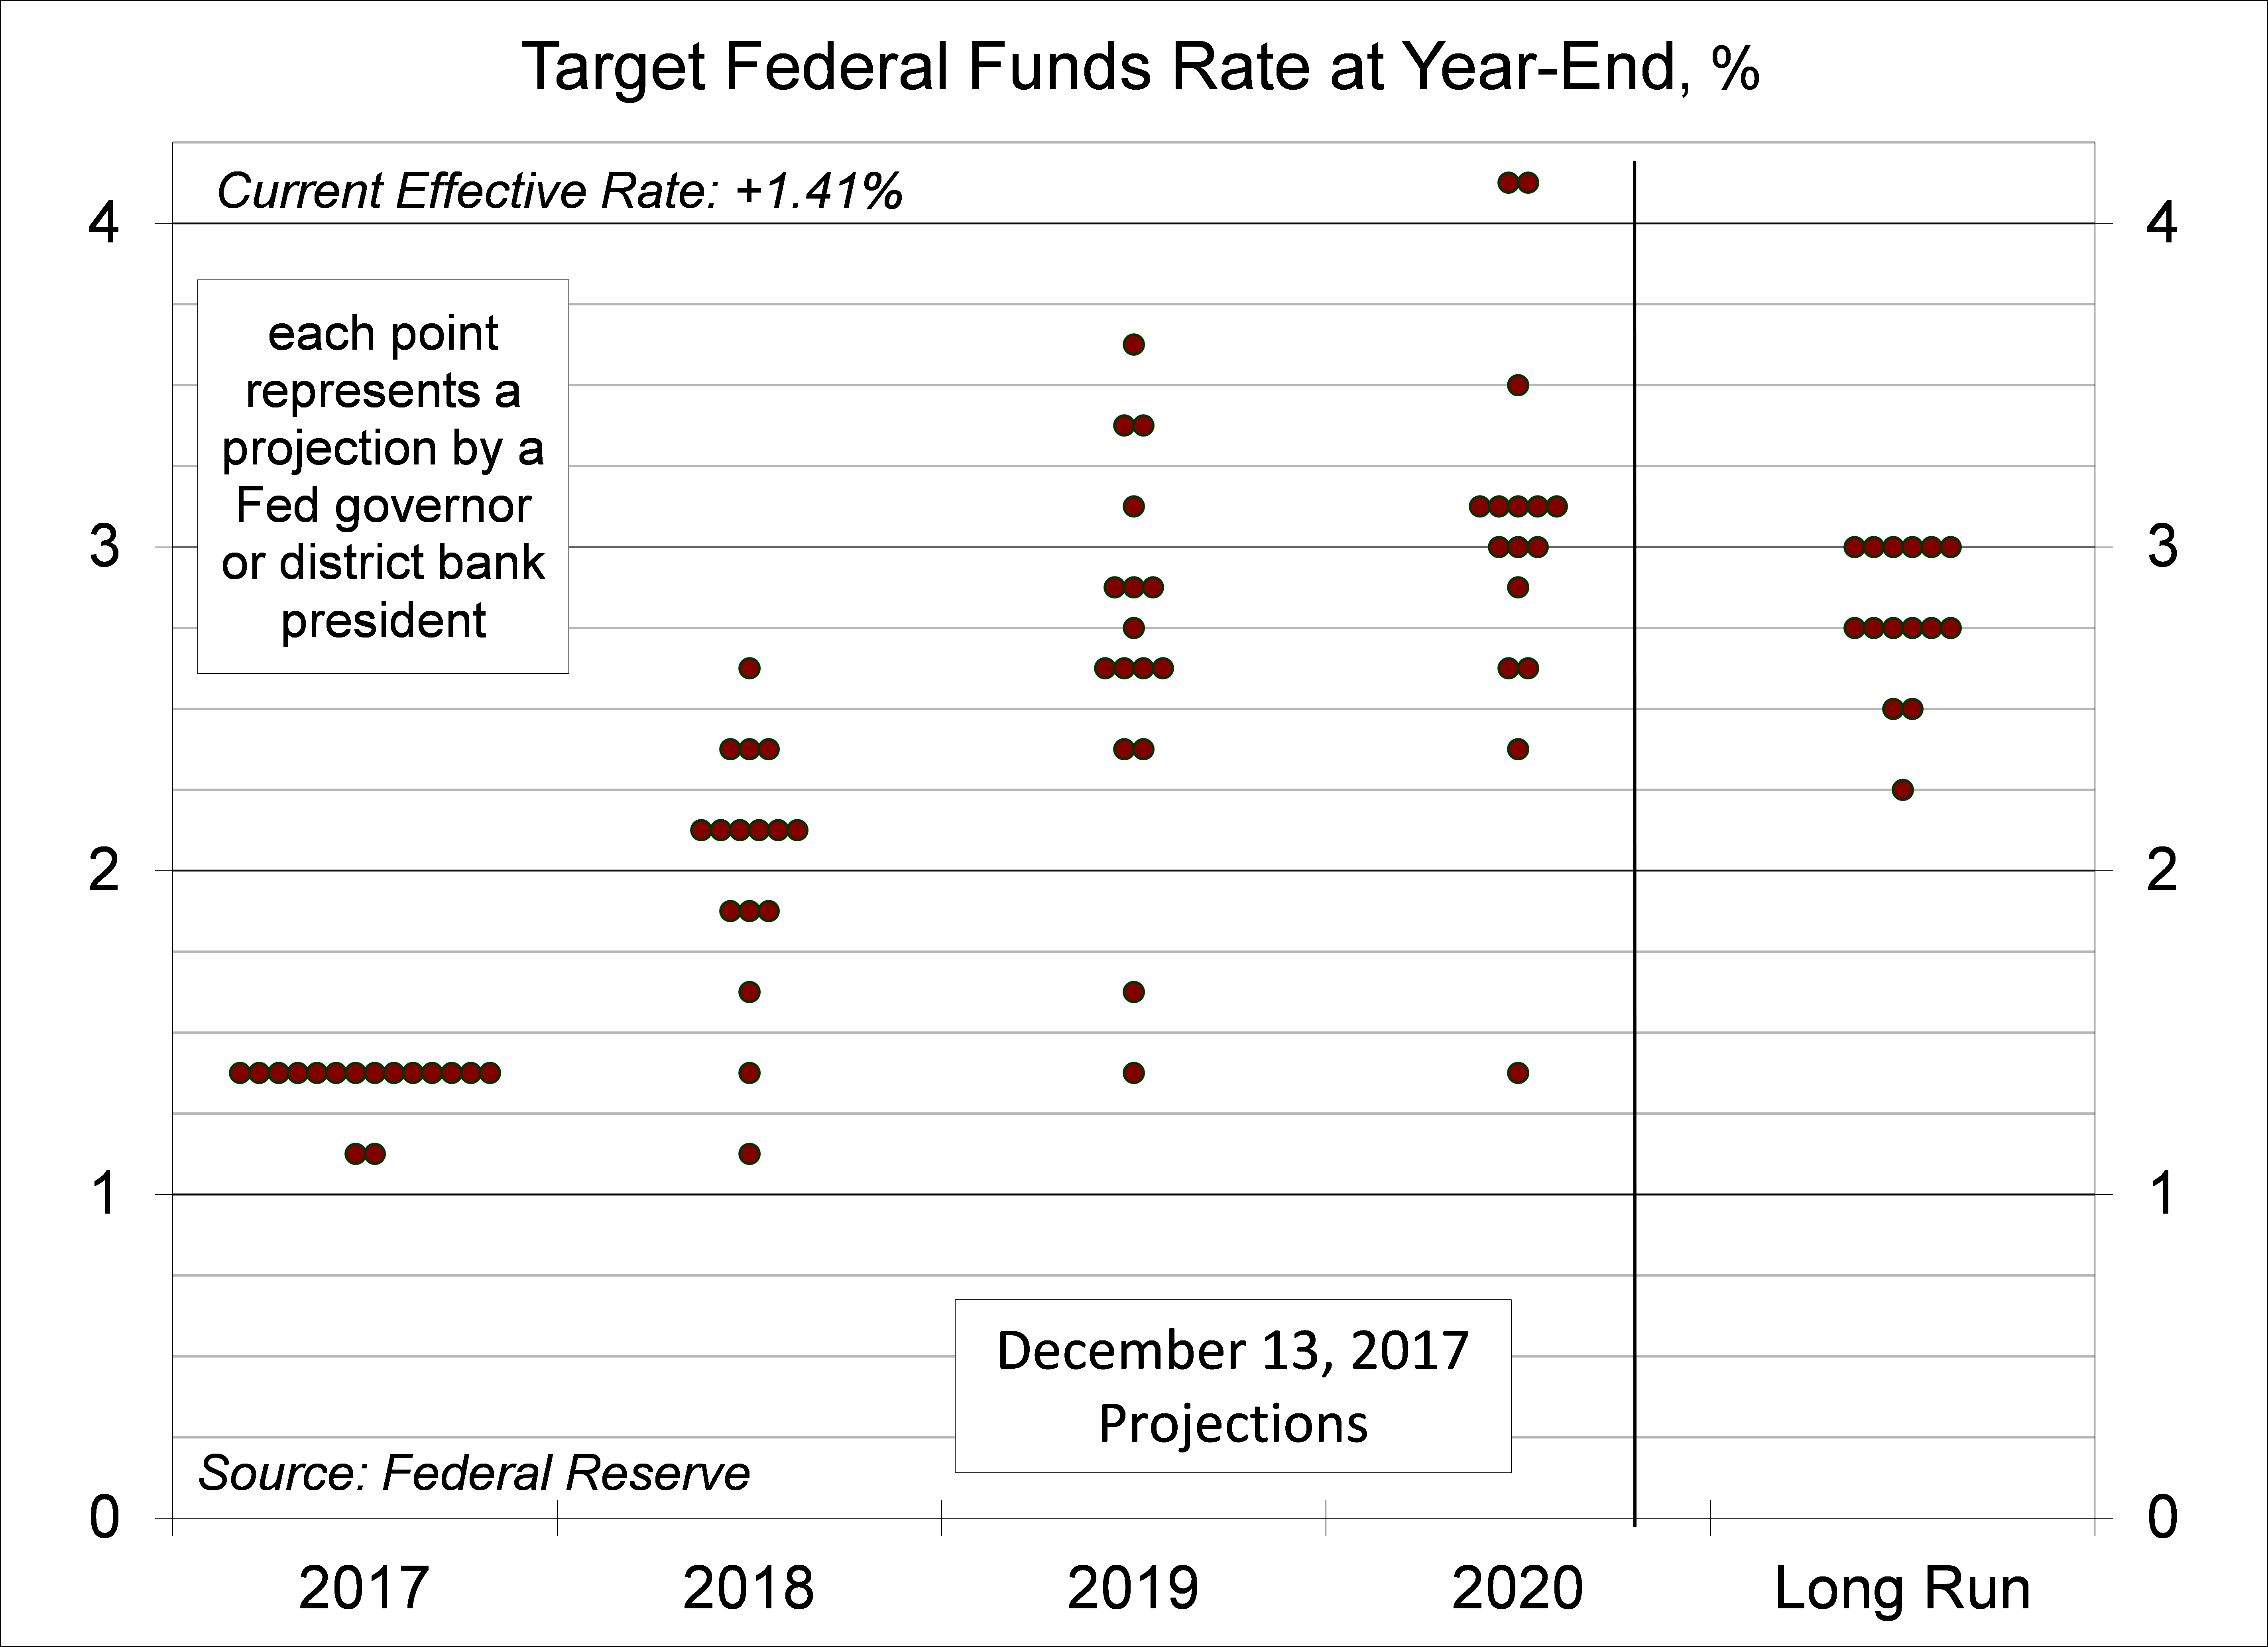
Four times per year, at every other Federal Open Market Committee meeting, senior Fed officials submit projections for growth, unemployment, and inflation. They also put forth their expectations of the “appropriate” federal funds rate for the end of the next few years. What do the dots in the dot plot tell us about the course of policy action? Not a lot.
Each dot in the dot plot represents a forecast of Fed governor or district bank president. Policy decisions are driven by Fed officials’ economic expectations, which are informed by the available data, so the policy outlook will change as information become available. The dots are not set in stone. In summarizing the December 12 Fed policy meeting outcome, much of the financial press reported the central banks is “flagging” three rate increases in 2018. Really? Look at the dots. They are all over the place. The median is three rate hikes, but most Fed officials do not expect three rate hikes (six are lower, four are higher). The policy outlook through 2019 is even more uncertain, but the dots for the eventual endpoint (the long-run) are relatively tight (2.75-3.0%).
There are some important issues related to the dot plot. Not all of the dots represent voting members of the Federal Open Market Committee (which is made up of the Fed governors, the New York Fed president, and four of the remaining district bank president). The four district bank presidents rotate on and off the committee at the start of the year. Two Fed officials, Chicago Fed President Evans and Minneapolis Fed President Kashkari, formally dissented at the December meeting and will rotate off the FOMC in 2018. Hence, the FOMC will be a bit less dovish. However, there will be a number of new senior Fed officials in 2018. There are three empty governor slots and New York Fed President Dudley will retire at the middle of the year. New officials may be more hawkish, but they may not be. Moreover, hawks may be less hawkish once they are seated.
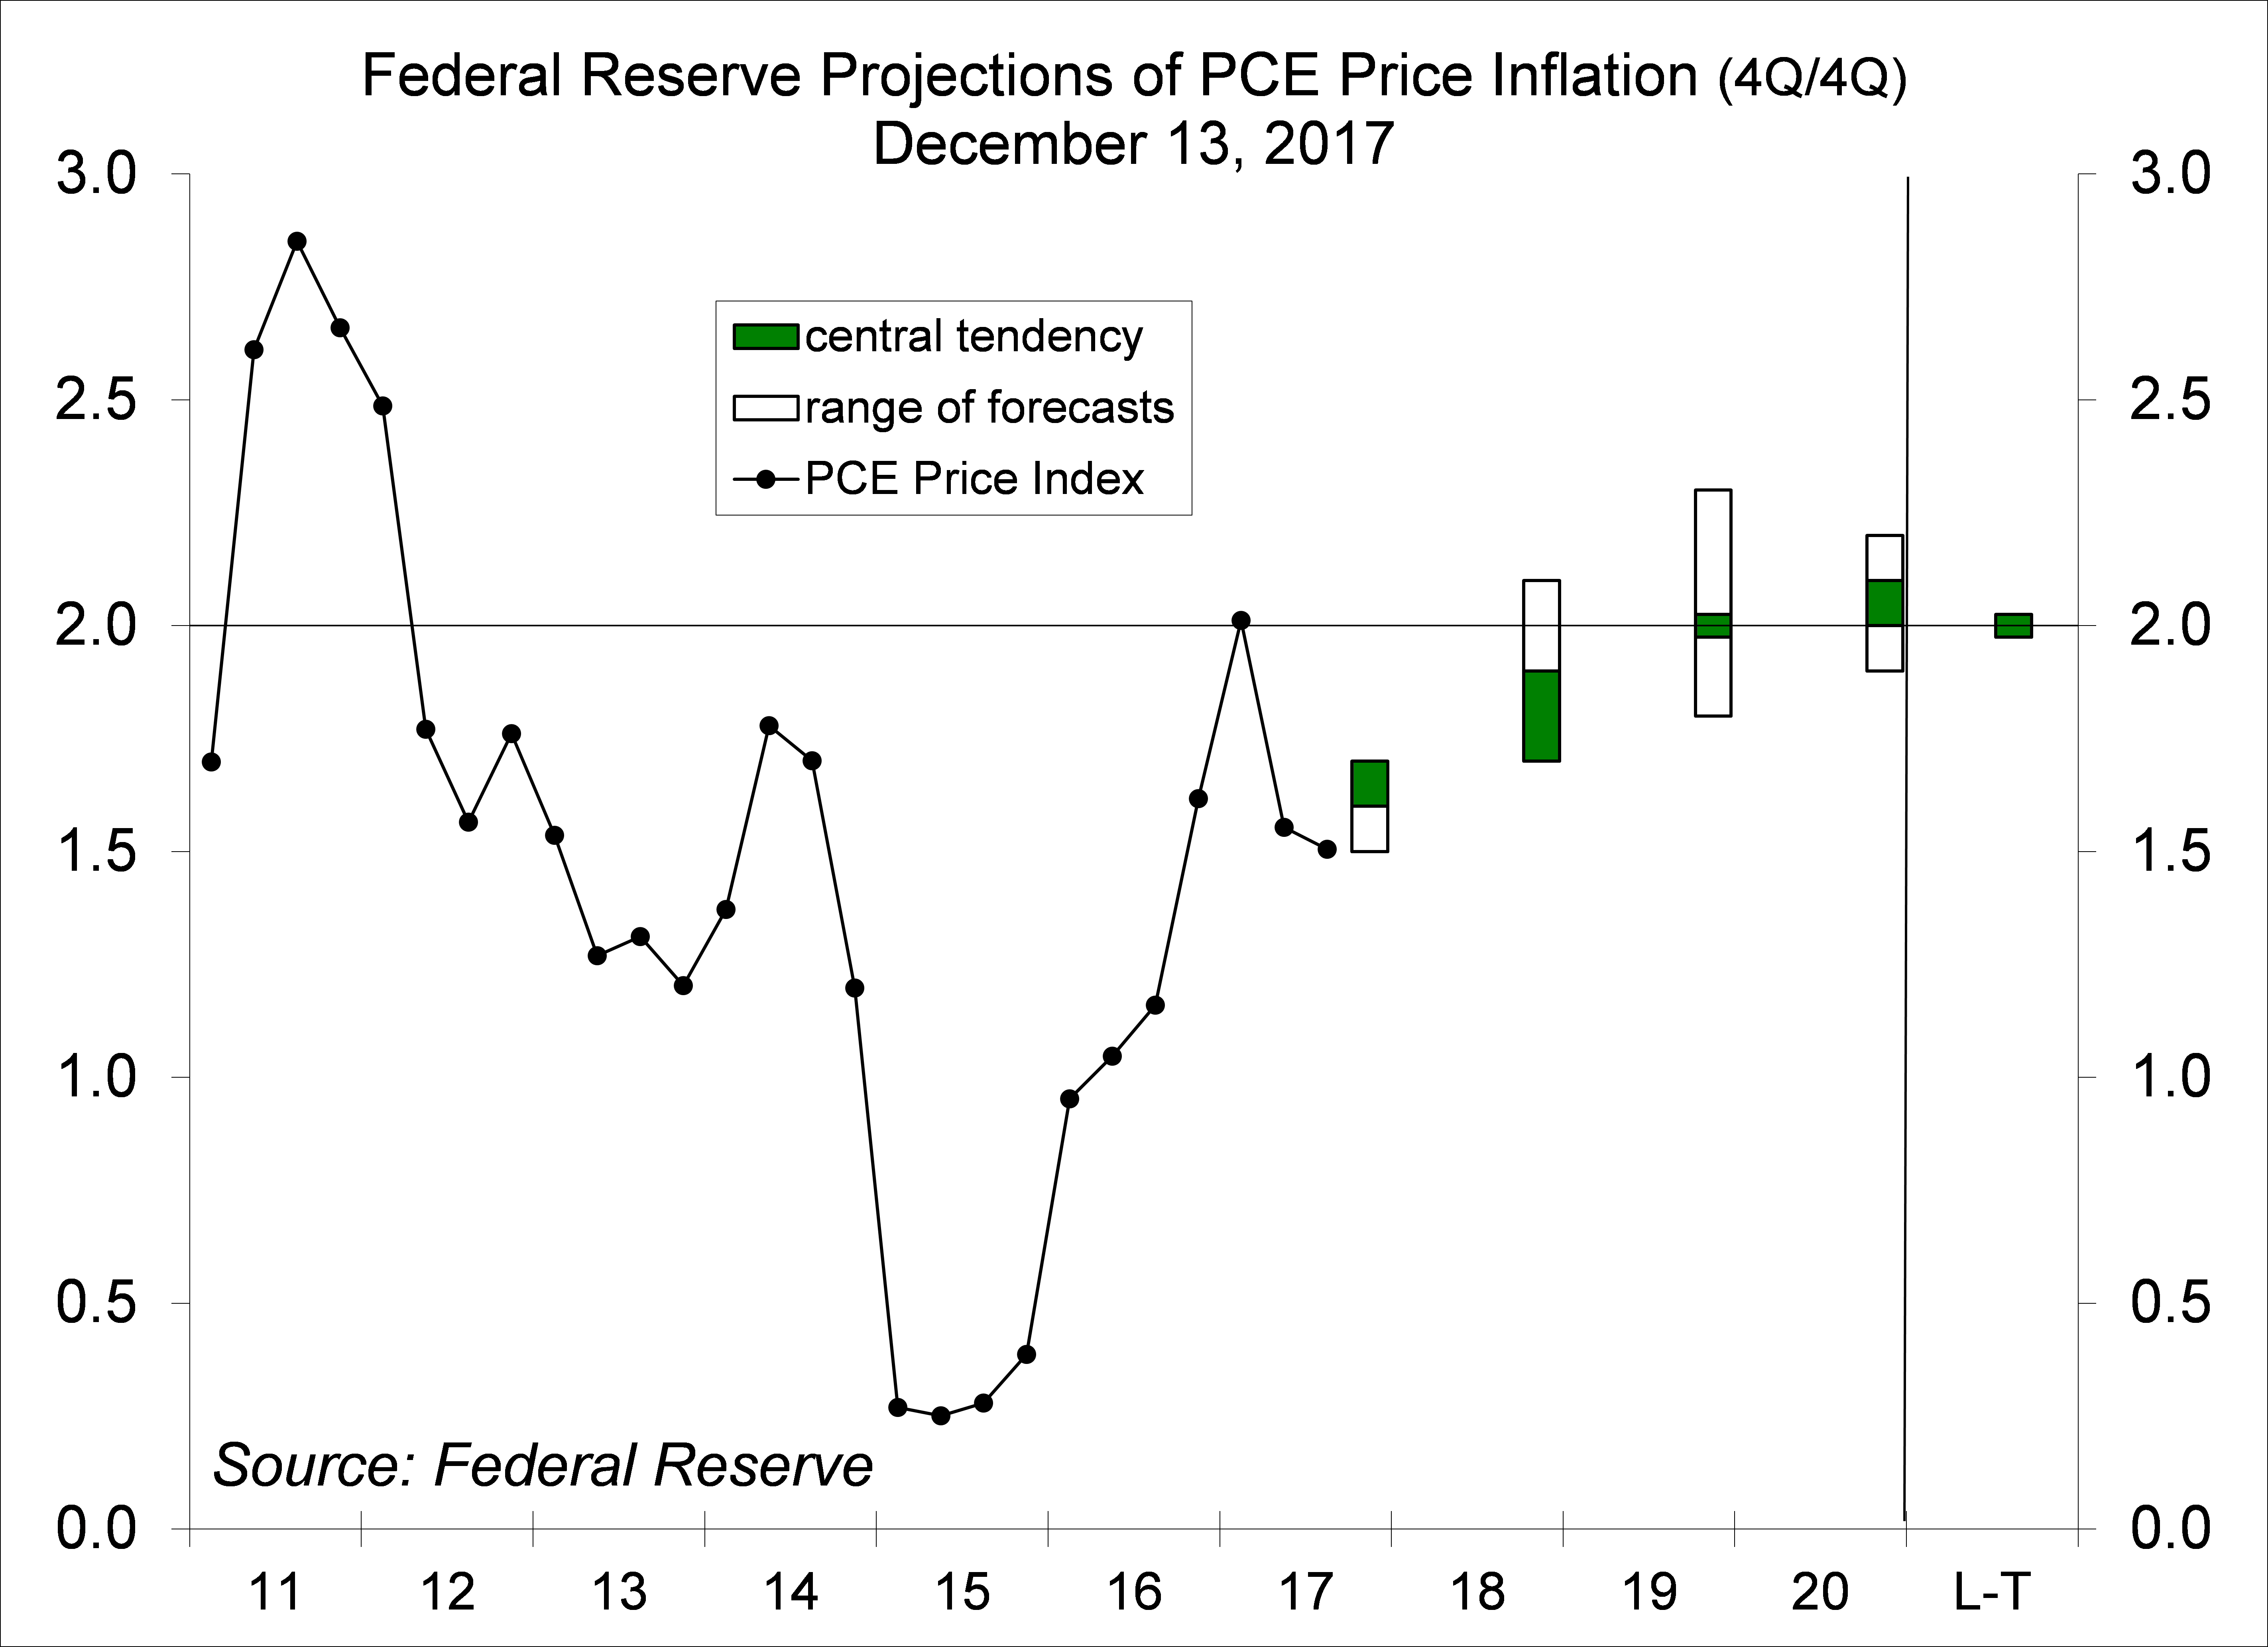
In the Summary of Economic Projections, Fed officials generally raised their forecasts of 2018 GDP growth, with most in the 2.2-2.6% range. Some officials factored in expectations of tax cut legislation, but generally, there were mixed views of the likely impact with differences largely due to the outlook for labor market slack. Note that while there is some optimism that corporate tax cuts and deregulation will lift capital spending, the longer-term growth outlook is dominated by slower labor force growth. Economic models, such as those developed by the Joint Committee on Taxation and Penn-Wharton among others, suggest that GDP growth over the next 10 years will be less than 0.1% per year higher (while the economic impact of corporate tax cuts may be small, the impact on earnings is significant).