Inflation may be starting to develop in the U.S., which has significant implications for the High Yield bond market.
The Fed’s stated inflation objective is 2% annually. Its preferred measure of inflation is the PCE—the Personal Consumption Expenditures price index issued by the Commerce Department. On March 1, the PCE for January 2017 was reported at 1.9, meaning the cost of goods and services increased 1.9% from January 2016. Note, too, the PCE’s strong upward over recent months:
- September 2016: 1.2
- October 2016: 1.4
- November 2016: 1.3
- December 2016: 1.6
- January 2017: 1.91
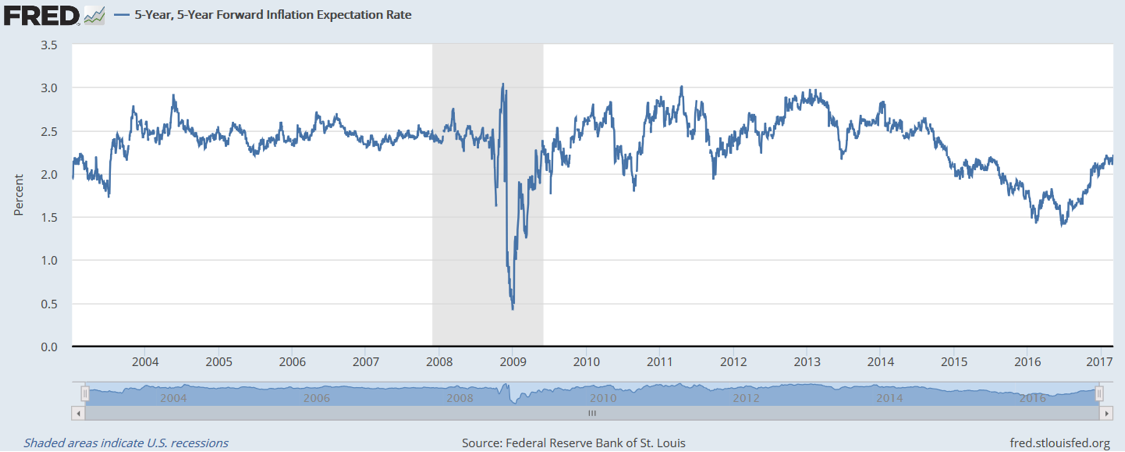
Another important inflation gauge is the St. Louis Fed’s “5-Year, 5-Year Forward Inflation Expectation Rate.”2 The St. Louis Fed describes the series as “a measure of expected inflation (on average) over the five-year period that begins five years from today.” The time series below shows these inflation expectations beginning in 2003. Note the increase since early 2016 to the index’s level of 2.22% as of March 1. The key point here is that expectations—as well as current reality—reflect inflation becoming established around the Fed’s target level.

Inflation’s Relationship to High Yield Bonds
As inflation takes hold, the Fed’s normal response is to raise policy interest rates to prevent inflation from spiking higher—with the effect of slowing the economy. Thus it’s no surprise that Janet Yellen’s remarks on March 3 expressed strong potential for a policy rate increase before the FOMC met on March 14-15. Most observers anticipate three separate interest rate increases this year and three in 2018—but the number could move to four or more this year if inflation gains momentum.
So what does a period of rising rates mean for High Yield bonds? This is a complex issue, in part because High Yield bonds are, functionally, a hybrid security. That is, their performance reflects aspects of the stock market as well as the bond market.
Interest rate factors
Let’s start with risks related to interest rates in the bond market, where credit spreads are now tight on a historical basis. With spreads tight, investors at the margin may decide to stop moving into the bond market, which could cause some price softening.
On the other hand, the narrow spreads appear to be justified: Moody’s Liquidity Stress Index appears to be trending lower; distressed bonds comprise a low percentage of total bonds outstanding; interest rate coverage is near all-time highs; and lower-rated CCC issues are at multi-year lows. Moreover, Fitch recently lowered its default rate projections.
In essence, these factors suggest that the most important risks in the bond market relate to interest rates—and therefore inflation. If, for example, 10-year Treasury yields significantly cross the 2.6% mark, we could see a wave bond selling that could affect High Yield along with other types of bonds. Two recent historical examples illustrate this type of risk:
-
The post-presidential election rate spike last fall. From September 30 to December 31, 2016, the benchmark 10-year Treasury yield rose from 1.60% to 2.45%--an expansion of 53%. When interest rates rise too quickly, bond prices can be negatively affected across the board and bring down High Yield bonds even if credit quality remains strong. We monitored that sharp increase in rates but with the view that the rising stock market was offsetting the effect on high yield bonds to some degree. Yields stabilized and high yield recovered, only to once again be affected during the recent move back to 2.6% for 10-year bond yields.
-
The 2013 “taper tantrum.” From August 1, 2012 to the end of 2013, the 10-year Treasury yield expanded a whopping 99%, from a level of 1.52% to 3.03%. At the time of the taper tantrum, yield spreads—that is, the difference between yields on High Yield bonds (which carry default risk) and long-duration government bonds—were narrow, reflecting relatively strong economic conditions. The market saw no real chance of economic recession occurring and pushing defaults higher to uncertain levels. But as the taper tantrum occurred, the rates on government bonds increased. Because yield spreads were already narrow, they couldn’t lessen further. That meant yields on High Yield bonds had to rise as well, thereby pushing bond prices down.
The takeaway point regarding interest rate risks to High Yield bonds is that speed of change matters. All fixed-income securities will be adversely affected if rates move higher faster than expected, as in the fall of 2016. Higher than expected inflation has the potential to create exactly that situation. This risk to High Yield exists regardless of the “stock-like” risks to the category, which we’ll turn to now.
Stock market factors
Historically, High Yield bonds follow stocks upward about three quarters of the time. The higher interest rates that correlate with economic strength (as the Fed combats inflation) generally affect Treasuries and Investment Grade bonds to a much greater extent.
So it’s important to closely monitor stock market trends when evaluating the relationship between inflation and High Yield bond outlook. As with stocks, stronger GDP growth can support price levels as domestic sales growth helps the financial positions of issuers.
The phrase “reflation trade” is currently popular and refers to rising inflation along with rising GDP as fiscal stimulus through tax cuts and infrastructure spending takes place. Markets assume these factors will spur greater demand for goods and services. “Success” also requires stable or expanding hiring, a pickup in corporate capital expenditures, and increased worker productivity. Despite optimism in the stock market—as reflected by new highs day after day—none of this is clear yet. We may see a gradual normalization of policy rates and stable inflation outlook, but this too is unclear and subject to incoming data points.
Technical indicators suggest markets are vulnerable to correction on any slowing down of the process of fiscal stimulus, such as Congress balking on a tax cut out of concern about higher federal debt levels. Or, the problem might simply be one of programs taking a long time to get in action. We’ve seen some declines in technical measures such as stock advance/decline figures and volume strength.
More dramatically, we’ve seen a sudden increase in stock market volatility in recent days—following a period of abnormally low volatility that indicated complacency. It wouldn’t be a surprise to see further reminders of just how volatile risk assets can be. In short, let’s not minimize that stocks have rallied and further price-to-earnings expansion will require follow through of fiscal stimulus that supports the valuation expansion and offsets higher rates and cost of capital.
Conclusion
Looking ahead, we will be watching interest rate increases—in response to inflation taking hold—potentially leading to a recession, perhaps in later 2018 or 2019. In the meantime, capital expenditures to improve the supply side and productivity may ward off inflation and keep the bull market in place. That said, the current stock market rally off the 2009 lows may be due for a slowdown; it is a tall order to see demand and supply side output equating to expansion in a steady manner, considering the low productivity levels that have been in place for years.
Matthew Pasts, CMT, is CEO and co-portfolio manager at BTS Asset Management (www.btsmanagement.com).
This commentary has been prepared for informational, educational purposes only. This material should not be construed as an offer to sell or the solicitation to buy securities or adopt any investment strategy, nor shall this commentary constitute the rendering of personalized investment advice by BTS Asset Management. This commentary contains views and opinions which may not come to pass. As such, nothing contained herein should be relied upon as investment advice, research, or a forecast. To the extent this material contains opinions, assumptions or discussions related to outlook, strategy, or different investment products, investors should not construe it as a substitute for the exercise of independent judgment. Investors must reach their own conclusions regarding the material presented, as the strategies and investments discussed may not be suitable for all investors. This material has been prepared from information believed to be reliable, but BTS Asset, Inc. makes no representations as to its accuracy or reliability. The views and opinions expressed herein are subject to change without notice.
2 Federal Reserve Bank of St. Louis, 5-Year, 5-Year Forward Inflation Expectation Rate [T5YIFR], retrieved from FRED, Federal Reserve Bank of St. Louis; https://fred.stlouisfed.org/series/T5YIFR, March 2, 2017.
© BTS Asset Management
© BTS Asset Management
Read more commentaries by BTS Asset Management