The U.S. economy is complex. Most people want to sum it up in one simple number: real GDP growth. However, that estimate has a number of flaws. Typically, there’s more going on under the surface in any government data report. The last several quarters of GDP growth are a good example.
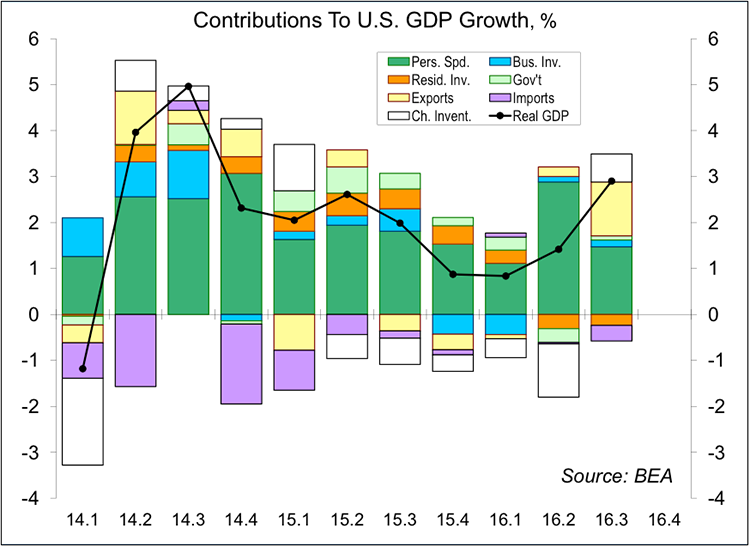
Real GDP rose 1.3% over the four quarters ending in 2Q16, but that understated the economy’s strength. A slowdown in inventory growth subtracted 0.6 percentage point and a wider trade deficit subtracted 0.2 percentage point. Underlying domestic demand was more like 2.1% (+2.3% if you also subtract the government sector). This flipped in 3Q16. A faster pace of inventory growth added 0.6 percentage point, while a narrower trade deficit added 0.8 percentage point. Ex-foreign trade and inventories, domestic economic growth was more like 1.4%, about half of the headline GDP growth figure (+2.9%). In other words, the economy was not as strong as the 3Q16 GDP growth figure would suggest, nor was it as weak as the 2Q15-2Q16 GDP data would seem to imply.
The third quarter GDP numbers will be revised (and revised again), but the story is unlikely to change much. Note that there is a fair amount of choppiness quarter to quarter, which may reflect difficulties in the seasonal adjustment (and the possibility that the seasonal pattern is changing more rapidly over time).
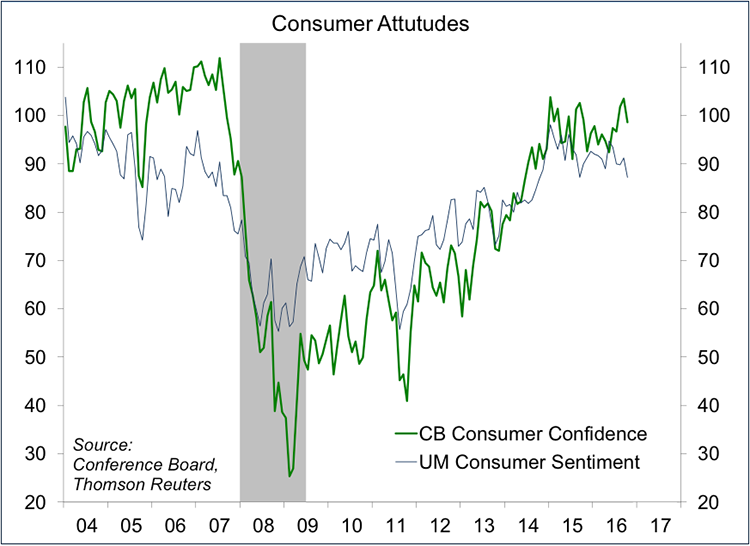
Inflation-adjusted consumer spending growth was weaker than anticipated in 3Q16, and the quarterly data imply either a weak figure for September, or downward revisions to July and August. While slower than in 2Q16, the 3Q16 pace was moderately strong. Yet, there appears to have been some loss of momentum in consumer spending. Some of that may reflect caution amid election-year uncertainty. Consumer attitude surveys suggest some concern regarding the overall economy, but continued optimism in personal finances.
Consumers don’t spend confidence. Consumers may spend out of wealth or borrow, but most expenditures are fueled by personal income. Yet, consumer attitude measures can provide some indication of the overall consumer outlook, implicitly incorporating expectations for the job market and other broader economic drivers. The two major consumer surveys, the Conference Board’s Consumer Confidence and the University of Michigan’s Consumer Sentiment, have remained relatively range-bound over the last couple of years. The Conference Board’s survey includes labor market perceptions, which were less optimistic in the initial results for October, but still relatively optimistic, especially in comparison to recent years.
What does the advance 3Q16 GDP figure mean for monetary policy? Not much. The Fed’s staff is adept at slicing and dicing the data and officials should be made aware of the underlying strength beyond the headline GDP figures. More importantly, Fed policymakers are focused on the labor market and the inflation outlook. Job growth has slowed this year, but partly due to a tighter job market (although wage pressures haven’t picked up by much). The inflation outlook is mixed, but generally moderate. Oil and gasoline prices were never going to fall forever, and overall inflation should trend higher. Yet, recent figures have continued to suggest mild deflationary pressure in consumer goods, while inflation in services has been dominated by rising shelter and medical care costs.
A November 2 rate hike by the FOMC is not out of the question. The conventional wisdom about the Fed wanting to avoid action around elections is wrong. Similarly, there’s no hard rule that rates can only be raised when there is a press conference scheduled. However, the FOMC refrained from moving in September because it could afford to wait for more information. That argument is still valid, making a December move more likely – but that will remain data-dependent.
© Raymond James
© Raymond James
Read more commentaries by Raymond James