- Emerging Markets in Improved Position
- Grocers' Groans
- U.S. Employment Report: Good, But Not Good Enough
In a world with globally mobile capital, monetary policy shifts in financial centers have a major impact on international asset prices, economic performance and policy. In May 2013, when then Federal Reserve Chairman Ben Bernanke raised the possibility of the Fed tapering its asset purchases, the market’s risk appetite declined and a risk sell-off ensued. Emerging markets (EMs) bore the brunt of this so-called “taper tantrum” and their policy makers were forced to take painful action to halt capital outflows and a currency freefall.
With the Fed getting closer to another interest rate increase, questions are being asked about the resilience of EMs, given the experience of three years ago. Fortunately, a review of their positions suggests a great deal of repair has occurred between now and then.
Vulnerability to capital flight is closely related to economic fundamentals. For instance, countries with high fiscal deficits, current account deficits and/or external debt (especially short-term debt) are much more sensitive to changes in global financial conditions. To assess whether the world will be better prepared this time, it is useful to look at shifts in these elements since the 2013 “taper tantrum.”
One of the key economic stories in the last two years has been the decline in oil prices, which has helped narrow global imbalances. Grouping EMs into oil importers and oil exporters helps isolate the drivers of fundamentals. Countries going through political uncertainty should be considered separately, since their performance has been affected by deterioration in the policy environment.
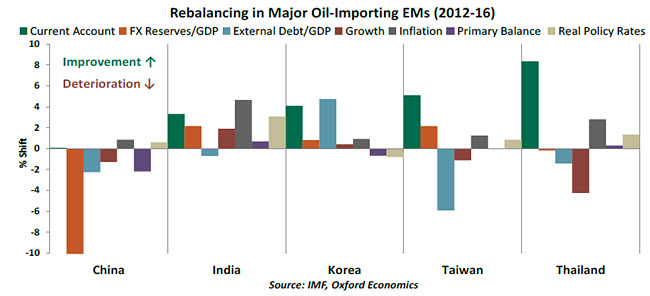
As we can see in the chart above, with the notable exception of China, oil-importing EMs have seen their current account balances improve and foreign exchange reserves increase, making those countries more resilient to external shocks. At the same time, external debt has increased in most oil-importing EMs, but ratios of external debt to gross domestic product (GDP) generally remain low, so external debt should not cause much concern.
On the domestic front, inflation has declined in all of these economies, while the growth performance is a mixed bag. India and South Korea have posted better growth figures, while China, Taiwan and Thailand have markedly slowed down.  During the “taper tantrum,” EMs with significant appreciation in real effective exchange rates (trade-weighted exchange rates adjusted for inflation differentials with trading partners) in the years leading to the sell-off were the ones to suffer the biggest currency depreciation. However, since most of these countries have seen their real exchange rates depreciate since 2013, a severe exchange rate adjustment during the next sell-off is much less likely. (India has been a notable exception, but the rupee’s appreciation points to India’s improved fundamentals and policy environment.
Predictably, the situation is less optimistic for oil exporters. Current account balances have deteriorated and external debt has increased across the board. (Debt is particularly high in Malaysia and Mexico.) The foreign exchange reserve situation is also problematic for some countries. Tighter U.S. monetary conditions would not only adversely affect access to global liquidity for these countries, but would likely worsen their overall economic position by making oil cheaper via a stronger dollar.
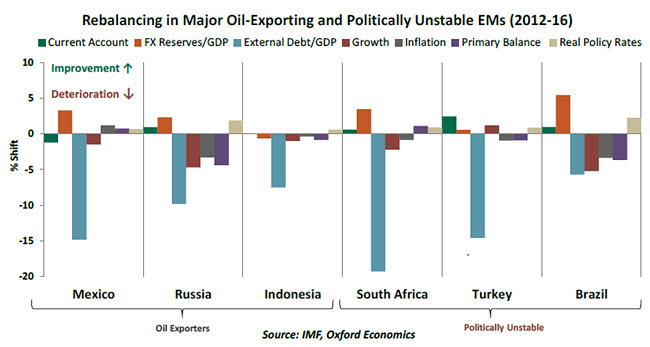
Countries going through political uncertainty have failed to capture the low oil dividend. Brazil has been a noticeable underperformer, having seen a conspicuous worsening in external debt, growth and inflation. As we discussed last week, the political situation in Brazil seems to be settling down, and having already experienced severe market adjustments, it is unlikely Brazil would see another major sell-off after the Fed raises rates.  At the same time, risk premiums for South Africa and Turkey remain high. While it would appear Turkey and South Africa have been able to shrug off the fallout from political instability, each country has a very high ratio of external debt to GDP. Combined with persistent current account deficits, this makes them particularly vulnerable to shifts in global liquidity and risk appetite. Russia, too, has seen its fiscal situation deteriorate, but it could have been much worse given its overreliance on oil.
While low oil prices were decisive in this global rebalancing, tighter policy has contributed as well. Real interest rates (central bank policy rate minus inflation) are higher today in many EMs. Fiscal support has been restrained as well. Primary deficits (fiscal deficits excluding interest payments) have either narrowed or have slipped only marginally.
China is an interesting case. Its sheer size buffers it from many of the slings and arrows that befall smaller EMs, but the markets are closely watching what Chinese policy makers are doing to readjust the economy.
Encouragingly, it appears the international economic system does have significant ability to self-correct and stabilize. It does not appear the emerging world, as a whole, is as vulnerable to tighter U.S. monetary policy as it was three years ago. Nonetheless, some countries bear close watching, and effective foreshadowing will be critical when the time comes.
Food for Thought
In any U.S. election cycle, there always is an increase in accusations that the nation’s economic numbers are rigged. If the statistics look too good to be true, the opposition cries foul. If they are disappointing, incumbents feel the heat.
Some complaints about economic indicators are perennial, however. The most common of these is the suspicion the consumer price index understates what people actually pay for things. “I don’t know what’s in that basket of goods they use,” one of my relatives is wont to say, “but what I’m buying is going up by 5% or 10% every year.” This anecdotal metric is known in some corners as “grocery store inflation.”
Well, those who have been aggrieved in this way might feel a little deflated at the moment. American food prices have been in the retreat and may continue to head downward.
The trend has several root causes:
- Record crop and dairy production. The International Grains Council recently reported the current global harvest will be the largest on record. Corn prices are at a seven-year low, and wheat prices have fallen about 25% since last summer. The glut of milk on the market has led some producers to dump the surplus on their fields; the U.S. government recently announced plans to purchase $20 million worth of cheese to help farmers.
- The strong U.S. dollar. Agriculture is one sector where the United States has a trade surplus; it exported $20 billion more than it imported last year. However, the U.S. currency has appreciated in the wake of international uncertainties and the divergence of central bank policy. (The Fed has been closer to tightening, while the ECB, the Bank of England and the Bank of Japan have been easing.) This has led some of our trading partners to shop elsewhere for food.

- Falling oil prices. One source estimated the ingredients for the average American meal travel 1,500 miles to reach our tables. It takes a lot of fuel to traverse such a great distance; fortunately for consumers, the price of gasoline has fallen from $3.50 per gallon to $2.20 per gallon in the last two years.
 Grocery chains have been challenged as well. Profit margins in the business, always very thin, have come under additional pressure. Several food wholesalers and retailers cited falling food prices as a cause of profit pressure last quarter.
 When the Fed assesses inflation, it typically focuses on the “core” rate, which removes food and energy prices. This is justified because of the volatility typically experienced by these two categories, which tends to distort the price level over short intervals. However, persistent recent declines in both food and energy prices must certainly be contributing to downward trends in inflation expectations.
The challenges faced by the U.S. food industry are likely to persist, and bear watching. Selfishly, though, I am happy about what’s been going on. Like many, I enjoy a good cut of beef every now and again, especially if it is grilled to a nice medium-rare. A year ago, you needed to take out a second mortgage to serve rib-eyes. Today, you cover the cost out of regular income, as long as you are willing to eat crackers for dinner during the balance of the week.
Summer Jobs
The August U.S. employment report pared back expectations of a September monetary policy move by the Federal Open Market Committee. Data between now and December should place the Fed in a better position to lift the policy rate. There are no alarm bells from this report signaling the need to take policy tightening steps in September.
Indicators from the household survey were largely unchanged. The unemployment rate held steady at 4.9% as did the participation rate (62.8%) and the broad measure of unemployment (U6, 9.7%).

Payrolls increased 151,000 in August and revisions to June (+271,000) and July payrolls (+275,000) were minimal. All of the improvements in hiring were from the service sector. August employment estimates often require upward revisions, because seasonal factors (vacations, school holidays) challenge the survey process. We’ll watch to see whether this will be the case this time around.
 Factory (-14,000) and construction (-6,000) employment fell in August. The 150,000 increase in service sector employment reflects increases in payrolls at food services and drinking places (+34,000), the financial industry (+15,000) and the health care sector (14,000). Professional and business sector employment (+22,000) moved up and government employment rose as well (+25,000).
 The workweek was shorter by 0.1 hour at 34.3 hours. Average hourly earnings rose 3 cents to $25.73, putting the year-over-year increase at 2.4% in August. This is a step back from recent readings, which were around 2.6%. The wage deceleration feeds into inflation estimates, which pulls them away from the Fed’s 2.0% inflation target.
In general, the August employment data largely denotes solid labor market conditions. Research indicates adding between 75,000 and 100,000 jobs per month is sufficient for a steady unemployment rate. Today’s estimate is well above this range and the three-month moving average of job growth at 232,000 is a sign of a strong labor market. Barring adverse international developments or downward surprises in the data, a December increase in the federal funds rate remains likely.


