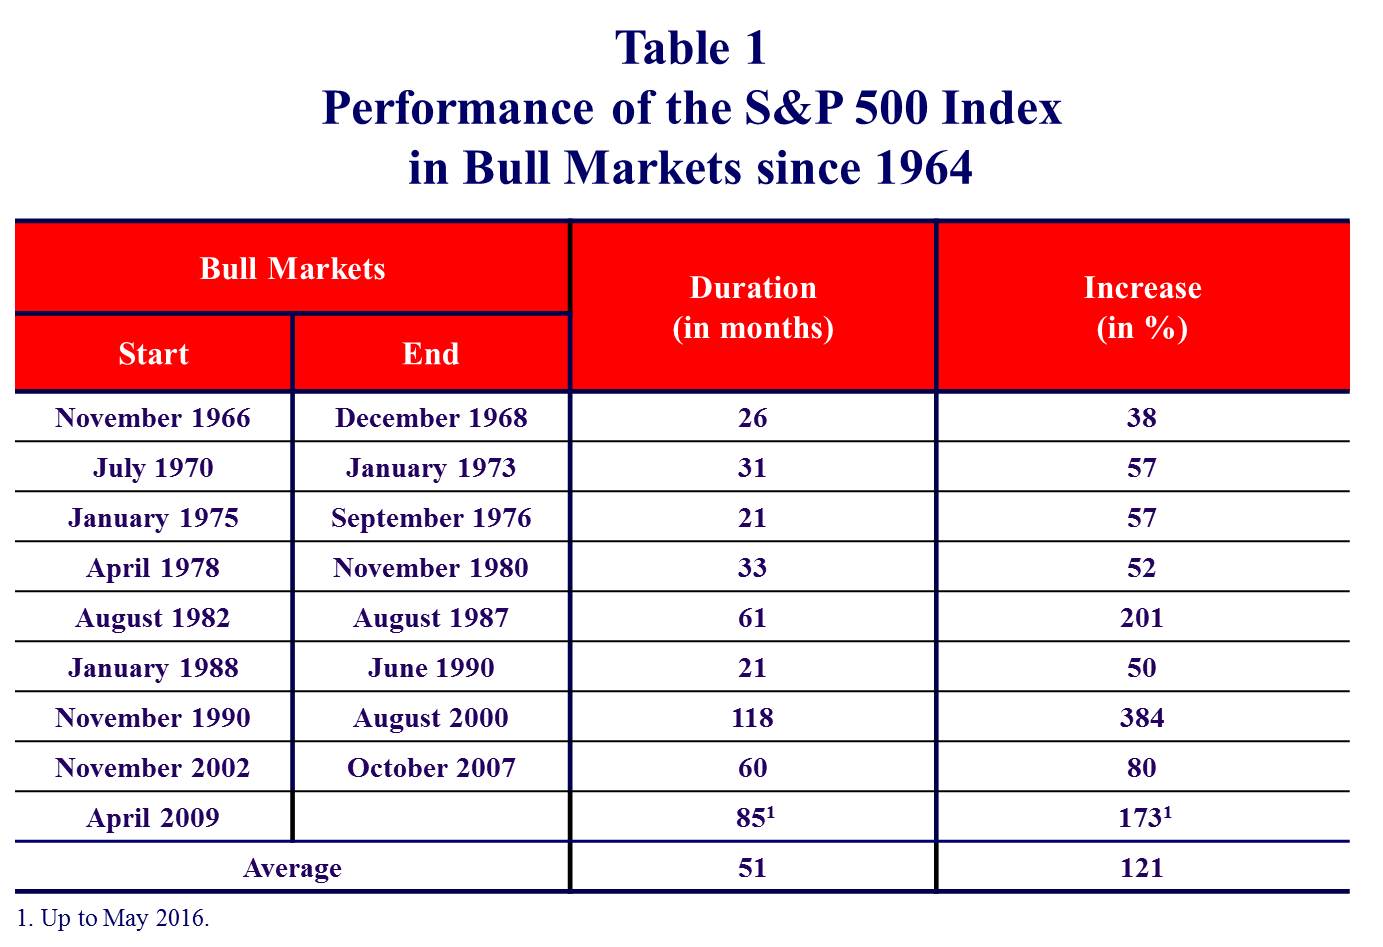
The current U.S. bull stock market is now seven years old and began its eight year last April. The S&P 500 stock price index has risen by 173% (based on monthly average data) from the last bear market through of March 2009 (see Table 1). This gain implies that the current bull market recorded a larger increase and rose for a longer period than most of the previous bull markets over the past fifty years. While the duration of the current bull market has well surpassed the historical average by close to three years, there is no way to predict how long it will last. But we do know that this bull market will eventually come to an end and a new bear market will arise.
In December 2010, the Forecasting Advisor began to calculate in real-time the probability for the S&P 500 stock price index of entering a bear market phase with its proprietary stock market cycle model, which provides unique and insightful intelligence on the likelihood of a shift in the U.S. stock market cycle. In practice, this means that at the start of each month the probability of entering a bear market was calculated for the current month and the subsequent month, using a number of U.S. economic indicators, such as a proprietary coincident index of economic activity, the unemployment rate, interest rates, the price-to-earnings ratio, and consumer confidence. (The model predicts the start of a bear market if the probability equals to or exceeds the usual 50% threshold. Otherwise, the bull market is projected to continue.)
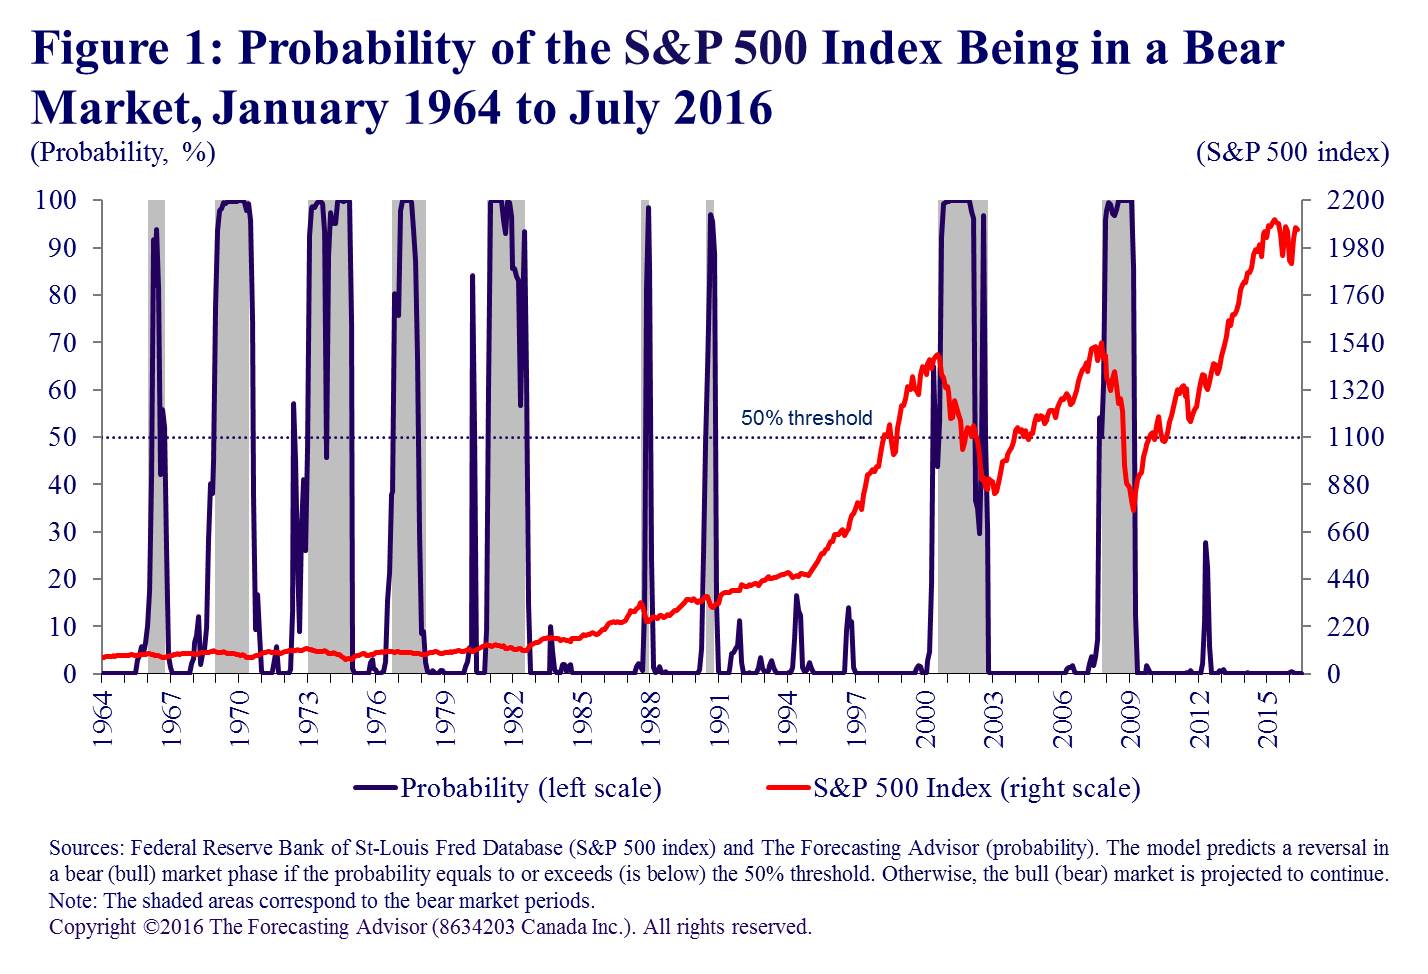
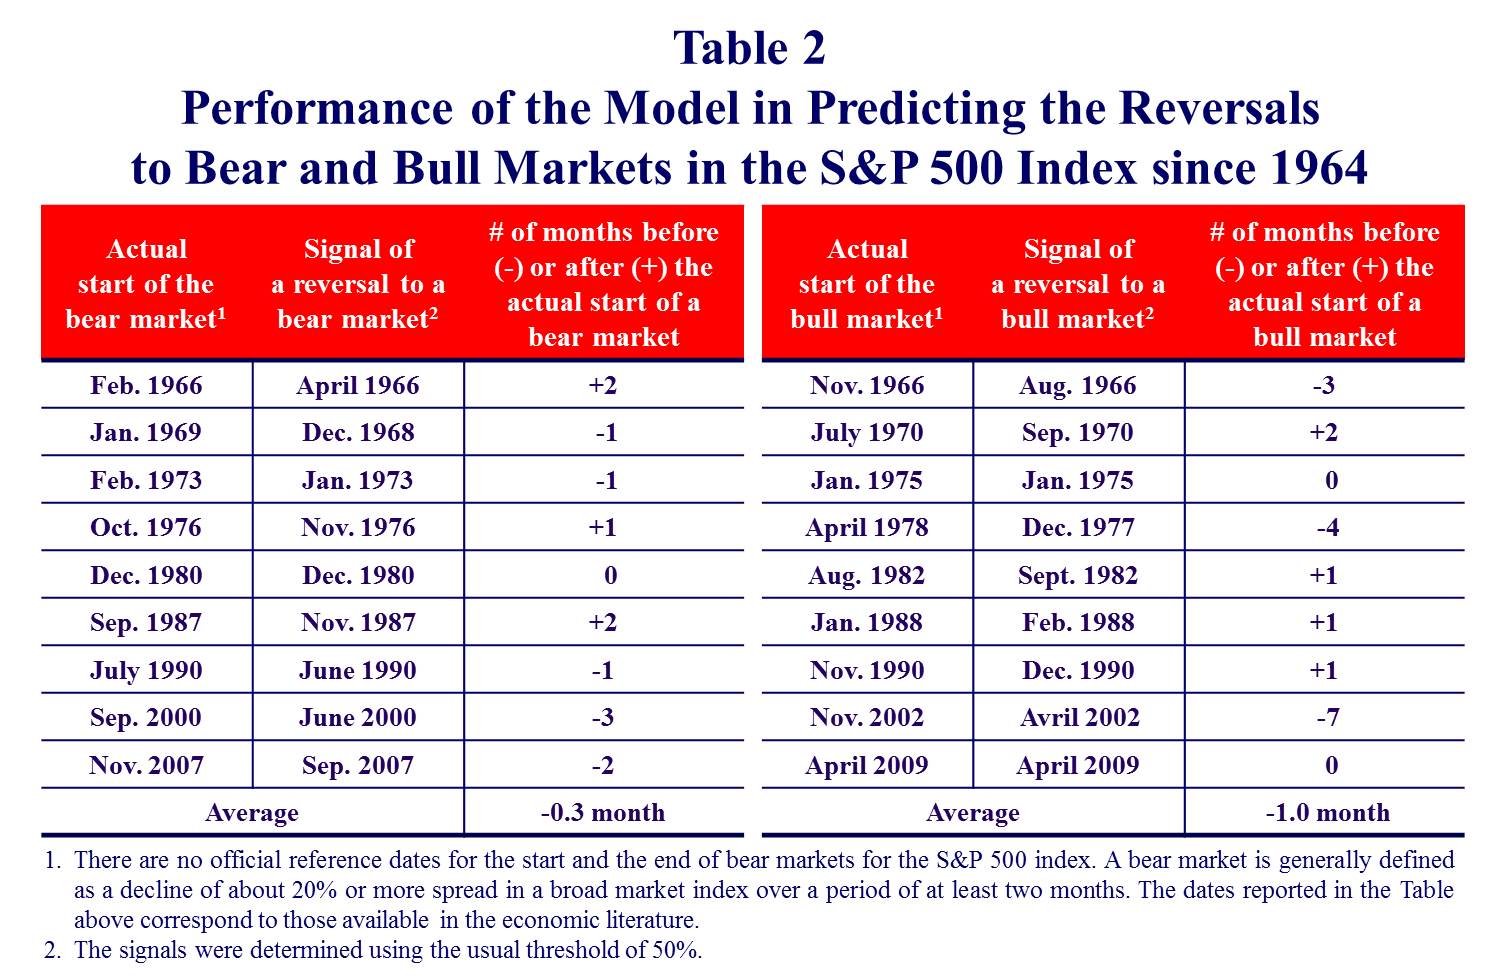
Figure 1 illustrates the performance of the model in predicting the shifts to bull and bear markets over the past fifty years. The model does very well in predicting all the reversals from a bull (bear) to a bear (bull) markets during that period. On average, the model signals the start of a bear market with a lead of less than a month before its actual start and the start of a bull market with a lead of one month (see Table 2). The description of the model and its performance can be obtained from: http://www.theforecastingadvisor.com/background-papers.php).
Short-term Outlook for the U.S. Stock Market Cycle
The Forecasting Advisor stock market cycle model is used here to assess the risk of entering a bear market in the next two months. More specifically, the model calculates the probability for the S&P 500 stock price index of entering a bear market for the months of June and July. The probabilities were calculated on June 3rd using a number of U.S. economic indicators, such as a proprietary coincident index of economic activity, the unemployment rate, interest rates, the price-to-earnings ratio, and consumer confidence.
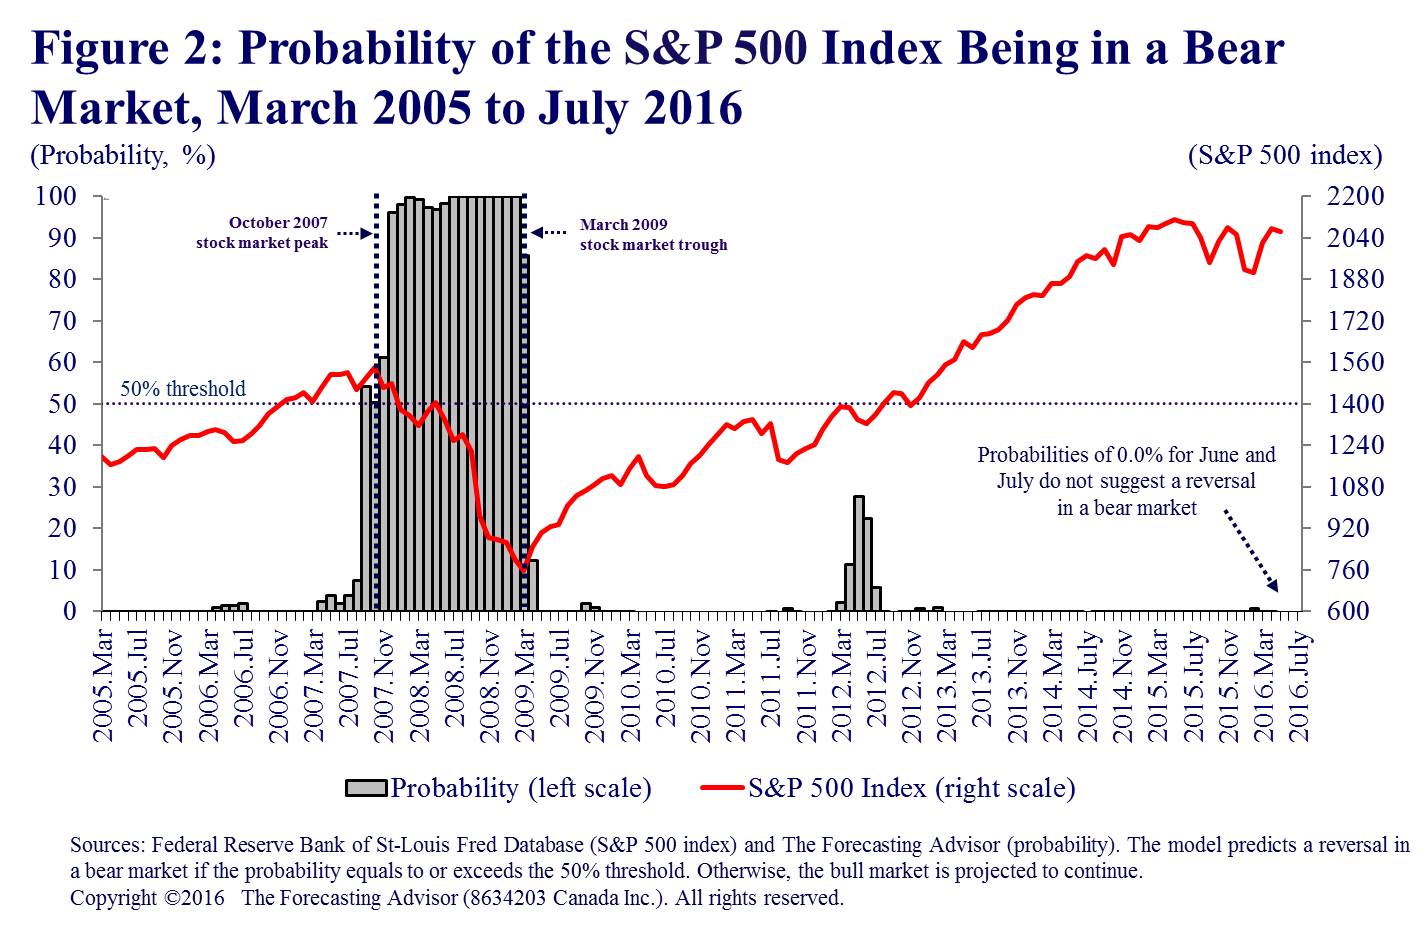
As shown in Figure 2, the probabilities of entering a bear market in June and July are at zero per cent. Thus, the start of a new bear market is not hanging over our head. In the months ahead, the model will continue to provide unique and insightful intelligence on the likelihood of a shift in the U.S. stock market cycle to a bear market phase.