At the start of each month, the U.S. Institute for Supply Management (ISM) releases data on the state of the manufacturing and non-manufacturing industries of the U.S. economy for the previous month. The data are closely followed by economists, portfolio wealth managers, and the financial media as they provide the earliest reading on the current state of the economy.
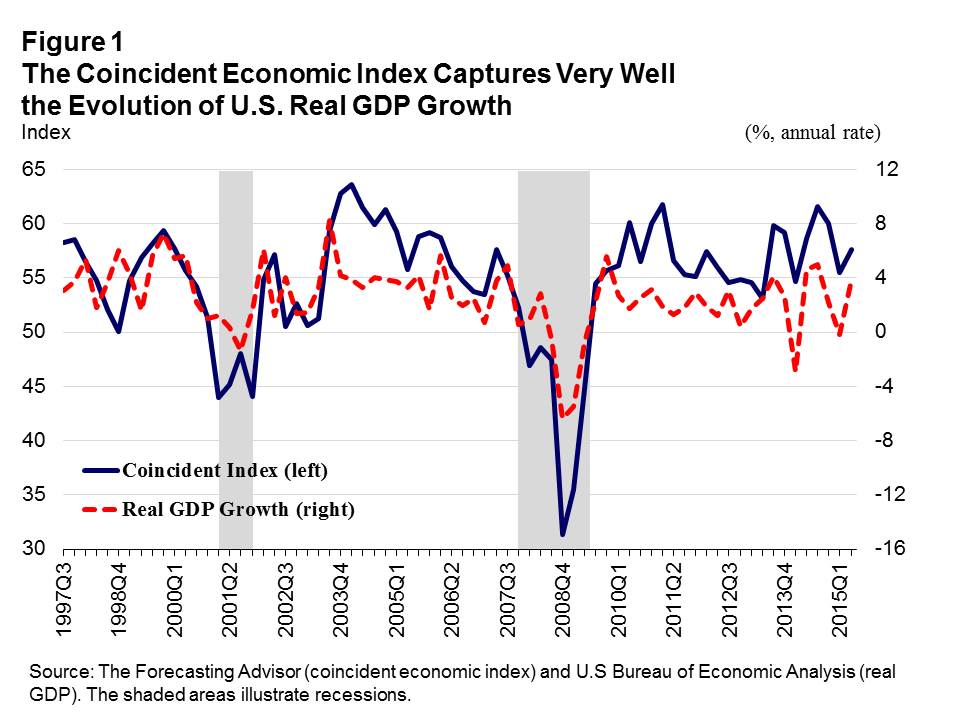
The ISM provides data for a number of indicators related to the manufacturing and non-manufacturing industries, such as production, employment, new orders, inventories, exports, imports and prices. A number of indicators from the manufacturing and non-manufacturing surveys are used by The Forecasting Advisor to construct a monthly coincident economic index from July 1997.1 Figure 1 shows the evolution of the coincident economic index and real GDP growth from the third quarter of 1997 to the second quarter of 2015. It reveals that the coincident economic index is highly correlated with the evolution of U.S. real GDP growth during that period. More specifically, the coincident economic index tracks very well the periods of weakening, particularly during the recession of 2008-2009, and the periods of strengthening in real GDP growth between 1997 and 2015. Since the ISM data are never revised during the year2 and timely, the coincident economic index is undoubtedly a very valuable indicator to assess the current state of the U.S. economy.
The Current State of the U.S. Economy
The Forecasting Advisor model is used here to forecast the rate of change in real GDP for the third quarter of 2015 and to determine the current state of the U.S. economy. The official first estimate of real GDP growth for the third quarter will be released by the U.S. Bureau of Economic Analysis on October 29.3
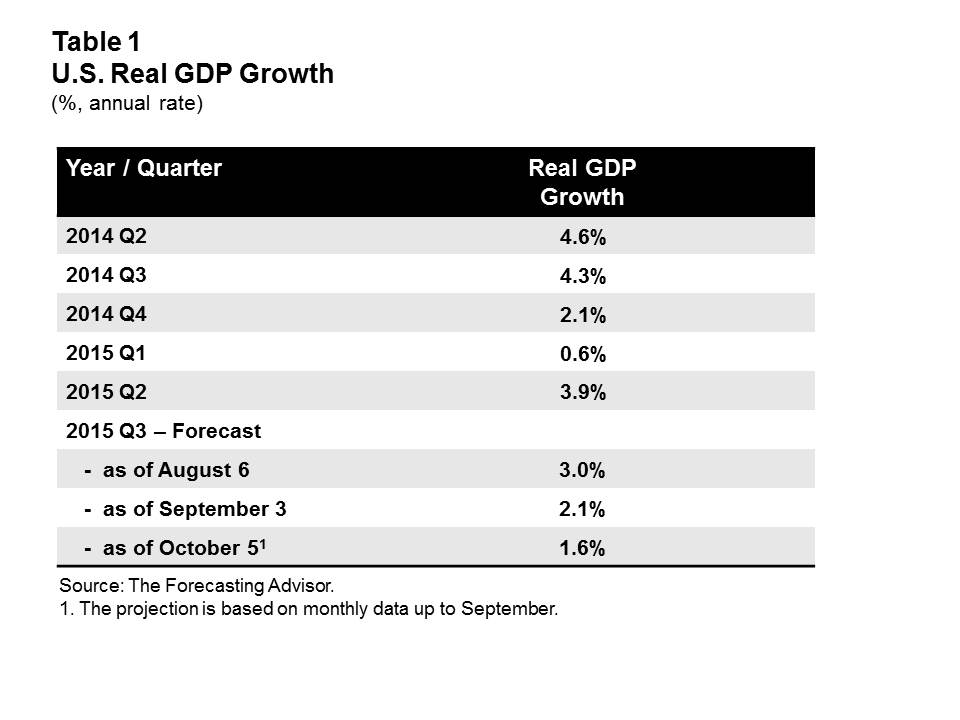
The forecast for the rate of change in real GDP in the third quarter of 2015 is reported in Table 1 below. The model projects an increase of 1.6% (annual rate) in real GDP. This represents a substantial slowing from the gain of 3.9% (third estimate, annual rate) in the second quarter. The deceleration in the pace of economic activity partly reflects the adverse direct and indirect impacts on the economy of the 20% drop in oil prices during the third quarter. The next projection from the model will be for the fourth quarter 2015 and it will be released on November 4.
 Forecasting Performance of the Model
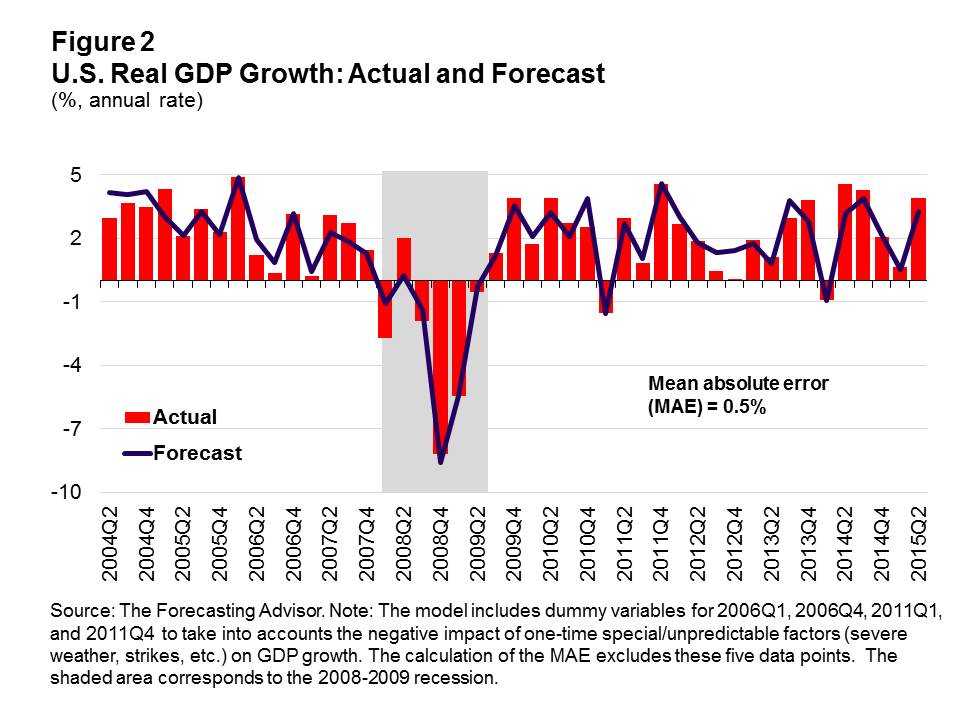
Figure 2 shows the performance of the model in predicting the annual rate of change in real GDP between the second quarters of 2004 and 2015. The model does very well both prior to and during the last recession as well as during all the current expansion. On average, the mean absolute error is 0.5% (annual rate) per quarter over the full period. For example, the forecast for the second quarter of 2015 was 3.3% compared to the current official estimate of 3.9%. Thus, the model correctly predicted the surge in the rate of increase in the second quarter. The ability of the model to predict well the direction of the rate of change in real GDP (i.e. the acceleration and deceleration in the pace of economic activity) from one quarter to the next is evident not just for the second quarter of 2015, but also for the full period. Indeed, the model predicted correctly 85 per cent of the time the direction of the rate of change in real GDP from one quarter to the next between 2004 and 2015.4
Looking ahead, the projections from the model should provide insightful intelligence and valuable leading information on the current state of the U.S. economy during the course to the start of the next recession.
1 Data from the non-manufacturing survey are only available from July 1997. Manufacturing data are available from January 1948.
2 The ISM data are revised in January of each year because of the calculation of new seasonal factors for the previous four years. The change in the values of the ISM data is minimal.
3 The first estimate of real GDP growth is always upward or downward, and very often significantly, in the following two months with the release of the second and third estimates. In addition, the quarterly estimates of the rate of change in real GDP are revised in the “annual revision” each July and in the following two annual revisions. This means that, for a given quarter, the ‘final value’ of the rate of change in real GDP is known only after a very long lag.
4 The calculation is done with real GDP data available as of September 2015.
© Robert Lamy, The Forecasting Advisor.