I expect rates will trend higher in the second half and the #Fed will move in September.
Global CIO Commentary by Scott Minerd
Market observers keen to anticipate the Federal Reserve’s next move are wise to follow the trail of verbal breadcrumbs laid down by St. Louis Fed President James Bullard, a policymaker I hold in high regard. When Fed policy seems uncertain or even inert, Dr. Bullard’s public statements have historically been a Rosetta stone for deciphering the Fed’s next move.
For example, in July 2010, Bullard wrote in a report ominously titled “Seven Faces of the Peril” that it was evident the Fed’s first round of quantitative easing had not been sufficient to stimulate the economy. In the report, which was widely picked up by the financial press, Bullard warned about the specter of deflation in the U.S. economy, and that the U.S. was “closer to a Japanese-style outcome today than at any time in recent history.”
That summer, months ahead of any Fed decision to proceed with QE2, it was Bullard who began a drumbeat of steady public messages about the necessity of a second round of easing. By August, the Fed was not talking about whether it should implement a new round of QE, but how. In November 2010, the Fed announced its plan to buy $600 billion of Treasury securities by the end of the second quarter of 2011. If you followed Bullard, you were expecting it.
While Bullard is not a voting member of the Federal Open Market Committee this time around, I still view him as an important policy mouthpiece. That is why it was so interesting when he underscored Fed Chair Janet Yellen’s comments at a press conference following the committee’s Dec. 16-17 meeting in an interview with Bloomberg, saying that the disappearance of a specific word—“patient”—from the Fed’s statement may be code that a rate increase will come within the next two FOMC meetings. He reiterated the point in a subsequent speech, saying “I would take [“patient”] out to provide optionality for the following meeting…To have this kind of patient language is probably a little too strong given the way I see the data.” When Bullard, the man who told us months in advance to expect QE2, goes to great length to describe when the Fed will raise rates, I tend to pay attention.
While Bullard says the Fed could raise rates by June or July (and I wouldn’t rule that out), I think the likelihood is closer to September and that the central bank will likely raise rates twice this year. Whenever “lift off” actually occurs, we’ve long been anticipating that this day would come. It is a particularly interesting time for investors to consider increasing fixed-income exposure to high quality, floating-rate asset classes, such as leveraged loans and asset-backed securities. The good news is there is still time to prepare for when the Fed finally runs out of patience.
Historical Outperformers During Periods of Rising Rates
With the first Fed rate hike drawing closer, floating-rate credit securities look set to offer more attractive returns. During the last three periods of rising interest rates (1994, 1999-2000, and 2004-06), floating-rate securities delivered higher average total returns than traditional fixed-income securities.
Average Returns During Periods of Rising Interest Rates*
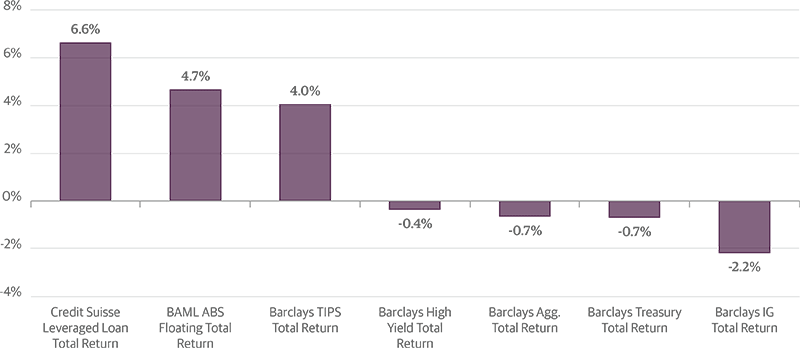
Source: Bank of America Merrill Lynch, Barclays, Credit Suisse, Guggenheim Investments. *Note: Periods of rising rates are defined as a cumulative change of the three-month Libor rate in excess of 100 basis points, and excludes the 2007-2008 financial crisis. Data as of 2/10/2015. Performance displayed represents past performance, which is no guarantee of future results. Performance will vary over different market cycles. Index information is provided for illustrative purposes only and are not meant to represent the performance of any product or strategy. Referenced indices are unmanaged and not available for direct investment. Index returns do not reflect any management fees, transaction costs or expenses.
Economic Data Releases
U.S. Payrolls Report Strong Across the Board
- Nonfarm payrolls beat expectations in January, up 257,000. The prior two months were revised up by a combined 147,000 after annual benchmark revisions. January showed strong gains in construction, retail, and healthcare.
- The unemployment rate rose in January to 5.7 percent due to the labor force participation rate improving to 62.9 percent.
- Average hourly earnings surprised to the upside in January, rising 0.5 percent from December. The annual growth rate rose to 2.2 percent, the highest since August.
- Job openings rose to 5.03 million in December from 4.85 million, and the opening rate reached the highest level since 2001. The hire rate also increased while the quit rate remained unchanged.
- Initial jobless claims rose to 304,000 for the week ending Feb. 7, up 25,000 from the prior week.
- Retail sales disappointed in January, down 0.8 percent following December’s 0.9 percent decrease. Sales excluding autos, gas, and building materials were also under expectations at 0.1 percent.
- The NFIB Small Business Optimism Index unexpectedly declined in January, down from 100.4 to 97.9 and the percentage of firms planning to increase employment ticked down to 14 percent.
Euro Zone Data Muddles Along, China Trade Data Worrying
- Industrial production in the euro zone was flat in December, under expectations after three months of increases.
- German industrial production inched up in December by 0.1 percent, matching November’s gain.
- German exports rebounded strongly in December, rising 3.4 percent.
- French industrial production had the best monthly growth in 13 months in December, rising 1.5 percent.
- Industrial production in the U.K. decreased 0.2 percent in December, causing output to fall to a four-month low.
- Chinese trade data was much worse than expected in January, with exports down 3.3 percent year over year and imports plunging 19.9 percent.
- China’s Consumer Price Index dropped to 0.8 percent year over year in January, while the Producer Price Index plunged further to -4.3 percent due to lower commodity prices.
- Japan’s Economy Watchers survey showed slight improvements in January, with both the current and outlook indices rising.
Important Notices and Disclosures
This article is distributed for informational purposes only and should not be considered as investing advice or a recommendation of any particular security, strategy or investment product. This article contains opinions of the author but not necessarily those of Guggenheim Partners or its subsidiaries. The author’s opinions are subject to change without notice. Forward looking statements, estimates, and certain information contained herein are based upon proprietary and non-proprietary research and other sources. Information contained herein has been obtained from sources believed to be reliable, but are not assured as to accuracy. No part of this article may be reproduced in any form, or referred to in any other publication, without express written permission of Guggenheim Partners, LLC. ©2015, Guggenheim Partners. Past performance is not indicative of future results. There is neither representation nor warranty as to the current accuracy of, nor liability for, decisions based on such information.
The securities/instruments discussed within this material may not be suitable for all investors. Fixed income investments are subject to credit, liquidity, interest rate and, depending on the instrument, counterparty risk. These risks may be increased to the extent fixed income investments are concentrated in any one issuer, industry, region or country. The market value of fixed income investments generally will fluctuate with, among other things, the financial condition of the obligors on the underlying debt obligations, general economic conditions, the condition of certain financial markets, political events, developments or trends in any particular industry and changes in prevailing interest rates. In general, any interest rate increases can cause the price of a debt security to decrease and vice versa. Floating rate loans and securities involve special types of risks, including credit rate risk, interest rate risk, liquidity risk and prepayment risk. Additionally, they may have restrictions on resale and may trade infrequently on the secondary market. As a result, they may be more difficult to value, buy, or sell.
Index Definitions:
Credit Suisse Leveraged Loan Index is designed to mirror the investable universe of the U.S. dollar-denominated leveraged loan market.
Barclays U.S. Treasury Index includes public obligations of the U.S. Treasury with a remaining maturity of one year or more.
Barclays U.S. Aggregate Bond Index is a broad-based benchmark that measures the investment grade, U.S. dollar denominated, fixed-rate taxable bond market, including Treasuries, government-related and corporate securities, MBS (agency fixed-rate and hybrid ARM passthroughs), ABS and CMBS.
BAML Floating Rate Total Return
Barclays U.S. ABS Floating Rate: A-Rated Index consists of the A-rated securities that are included in the Barclays U.S. ABS Floating Rate Index, an index that represents securities of the four largest floating rate ABS collateral types: student loans, credit cards, home equity loans and auto loans.
Barclays TIPS
Barclays Capital U.S. Treasury Inflation Protected Securities
The index includes all publicly issued, U.S. Treasury inflation-protected securities that have at least one year remaining to maturity, are rated investment grade, and have $250 million or more of outstanding face value.
Barclays U.S. Corporate High-Yield Index measures the market of USD denominated, non-investment grade, fixed-rate, taxable corporate bonds. Securities are classified as high yield if the middle rating of Moody’s, Fitch, and S&P is Ba1/BB+/BB+ or below.
Barclays U.S. Corporate Investment-Grade Index represents securities that are SEC-registered, taxable, and dollar denominated. The index covers the U.S. corporate investment-grade fixed income bond market.
(c) Guggenheim Partners


