Municipal Bond Outlook - Institutional Fixed-Income Sector Report
Volatility induced by headline events has created attractive price dislocations in the municipal bond market, which may now present the best buying opportunity for investors since late 2010.
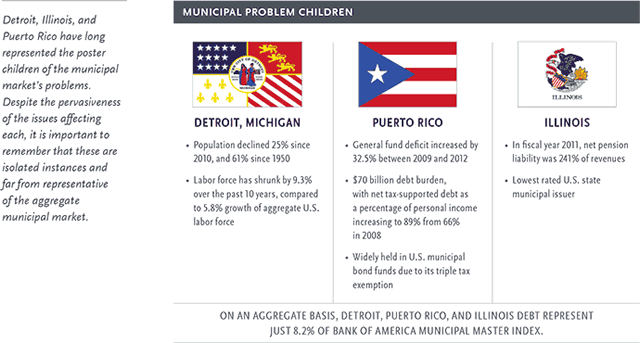
The structural issues that have plagued the municipal sector for decades have received widespread media coverage over the past three years. The severity of pension shortfalls, the sector’s worst kept secret, finally came to light and individual investors responded by withdrawing $50 billion from municipal bond funds in 2013. Despite the significant obstacles facing specific issuers, such as Illinois, Puerto Rico, and Detroit, these isolated instances are not representative of the highly diverse $3.7 trillion municipal market.
Current sentiment is reminiscent of December 2010, when dire forecasts of widespread defaults resulted in $16 billion of municipal bond fund outflows over a two-month period. At the time, we stated that the “blanket misperception of credit deterioration across the asset class has led to wider spreads for even the most creditworthy municipal debt issuers.” (See "Opportunities in Municipal Finance" Q4 2010) Actual default activity paled in comparison to the magnitude predicted, and market hysteria subsequently abated. The sector produced 11 percent annualized returns in 2011, outpacing both equity and corporate bond markets. We believe current headline risk has created a similarly attractive opportunity for fundamentally driven investors.
REPORT HIGHLIGHTS:
- With $50 billion in capital withdrawn from municipal bond funds this year, individual investors are clearly operating under a “sell first, ask questions later” mentality, similar to what occurred following Meredith Whitney’s now infamous prediction of financial Armageddon in the municipal market in late 2010.
- The financial media’s fixation on troubled issuers has created the perception that fiscal conditions are deteriorating across the United States. In reality, the overall fiscal picture is improving as U.S. state and local tax revenues in the second quarter of 2013 rose 8.9 percent, the 14th consecutive quarter of growth.
- We see attractive opportunities in areas of the market recently vacated en masse by investors, such as intermediate to longer-duration bonds, and select revenue bonds of distressed cities. For investors with the ability to decipher the complex municipal market, we believe current market dislocations offer the opportunity for attractive returns.
Municipal Market Scorecard as of Month End
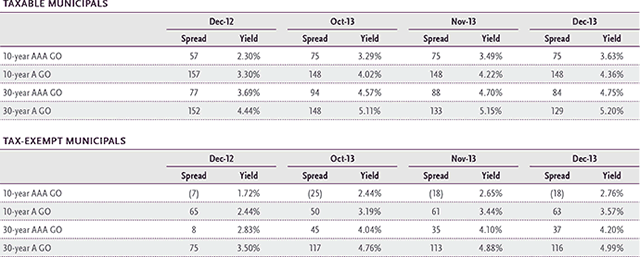
Source: Thomson Reuters. Spreads relative to treasuries for taxable municipals, and LIBOR for tax-exempt municipals. Data as of December 06, 2013.
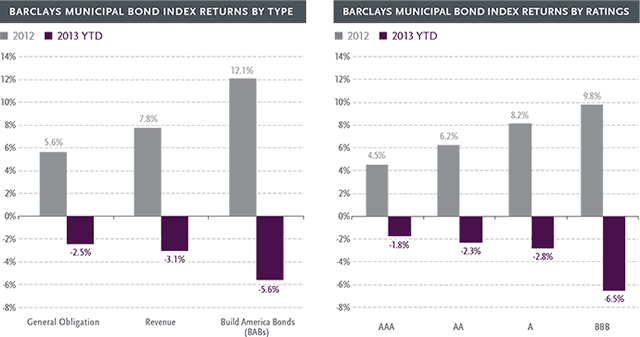
Source: Barclays. Data as of December 06, 2013.
“The municipal market finds itself at a critical inflection point. From tapering fears to municipal bankruptcies, the resolve of investors has been tested. In response, mutual funds have experienced massive outflows, similar to 2010, when dire default forecasts shook investor psyche. We believe the market’s strong aversion to risk during this time of interest-rate uncertainty has created attractive investment opportunities, particularly in the long end of the curve.”
- Scott Minerd, Global CIO
Seeing the Forest From the Trees
Volatility induced by headline events has created attractive market opportunities
The financial media’s fixation on troubled issuers has created the perception that fiscal conditions are deteriorating across the United States. In reality, the overall fiscal picture is improving as U.S. state and local tax revenues in the second quarter of 2013 rose 8.9 percent, the 14th consecutive quarter of growth. However, the pace of recovery has been uneven, underscoring the need for security-level analysis. Rather than conducting the requisite analysis needed to bifurcate the truly at-risk issuers from the healthy ones, it appears that many investors have chosen instead to flee the municipal market. With $50 billion in capital withdrawn from municipal bond funds this year, individual investors are clearly operating under a “sell first, ask questions later” mentality, similar to what occurred following Meredith Whitney’s now infamous prediction of financial Armageddon in the municipal market in late 2010.
Historically, the performance of the market has largely been driven by expectations on tax policy and interest rates, with credit risk a distant, tertiary concern. Actual municipal bond defaults since 2011 total $16.4 billion, representing just 0.4 percent of the $3.7 trillion market – contrary to the prediction of “sizable defaults totaling hundreds of billions of dollars.” While defaults still remain low on an absolute basis, and relative to investment-grade corporate bonds, increased credit risk, nonetheless, represents a significant paradigm shift in the psyche of the municipal investor. The recent spate of municipal bankruptcies (Jefferson County, Alabama in November 2011, Stockton, California in July 2012, and Detroit, Michigan in July 2013) represents unfamiliar territory for an investor base not accustomed to dealing with significant credit risk.
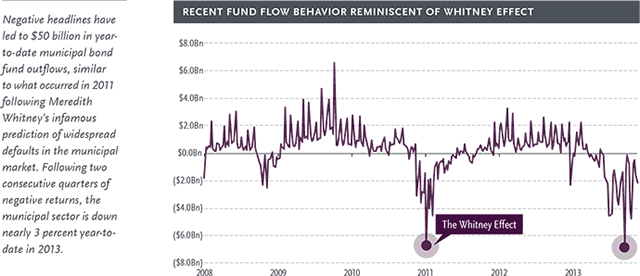
Source: Lipper. Data as of September 30, 2013.
In 2005, 57 percent of municipal bonds were ‘wrapped,’ or insured by monolines, guaranteeing interest and principal payments to investors. Given this additional layer of security, 79 percent of bonds in the Barclays Municipal Bond Index were rated ‘AAA’ that year. Such pristine ratings gave investors a false sense of security, masking the inherent risks and complexity of the sector. Amid solvency concerns of the leading monoline insurers following the 2008 financial crisis, municipal insurance quickly become a relic of the past: today only 5 percent of bonds are insured.
Diminutive Size Belies Its Complexity
Fragmented nature of issuer and investor bases creates market dislocations
Although less than half the size of the corporate bond market, the municipal market has roughly six times as many issuers and approximately 1.5 million securities compared to 40,000 for the corporate bond market. Municipal bond issuance is diversified regionally, by sector, and repayment source, with issuance generally taking one of three forms.
- General obligation (GO) bonds are secured by the pledge of the municipality’s full faith, credit, and taxing power. The primary source of repayment for GO bonds is property taxes at the local level and a combination of income tax and sales tax at the state level.
- Revenue bonds are secured by claims on non-tax revenues derived from tolls or fees associated with the project or facility being financed by the bond issue. Projects financed by revenue bonds generally include water/sewer facilities, public power/utilities, airports, and toll roads.
- Appropriation-backed bonds are secured by a “promise to pay” backed by legislatively approved appropriations. Typically, appropriation bonds carry a rating one notch lower than an issuer’s GO bonds since the sources of interest and principal payment can be directly, and possibly, adversely, impacted by legislation.
The composition of the investor base has evolved considerably over the past 30 years. In 1980, banks’ share of the municipal market totaled 40 percent. By the end of 1990, their share had fallen to 12 percent, largely due to new regulations. For example, a provision of the Tax Reform Act of 1986 limited banks’ deduction of interest expense on borrowed capital used to purchase municipal bonds. Banks now represent 11 percent of the market. Individual investors (through either direct investment or through mutual funds) currently comprise 73 percent of the municipal bond market, compared to 15 percent ownership of investment-grade corporate bonds. High net-worth individuals are particularly attracted to municipal bonds due to the sector’s high credit quality and tax-exempt status. Municipal bond interest income is exempt from federal taxes and, in some cases, also from state and local taxes.
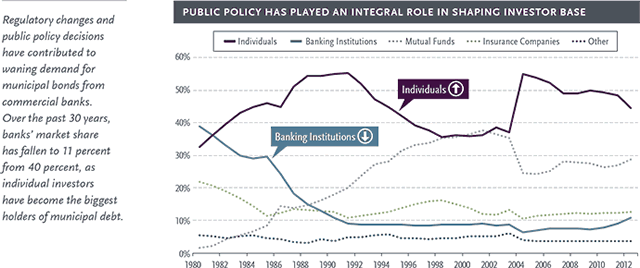
Source: Federal Reserve. Data as of June 30, 2013.
The Barclays Municipal Bond Index contains bonds from all 50 states, in addition to the District of Columbia, Guam, and Puerto Rico. Given the inherent challenges in analyzing such a diverse array of investments, each subject to its own unique set of risk considerations, an investor base dominated by individual investors seems incongruous. Historically, exceptionally strong credit quality has helped overcome this investment hurdle. Since 1970, the average 10-year cumulative default rate is 12 basis points, compared to 278 basis points for investment-grade corporate bonds. However, with credit concerns rising, the importance of individual security selection is magnified and made more difficult by structural challenges such as unfunded pension liabilities, population trends, and other post employment benefits (OPEB).
Structural Headwinds
Pension Concerns Cast a Long Shadow on U.S. Fiscal Health
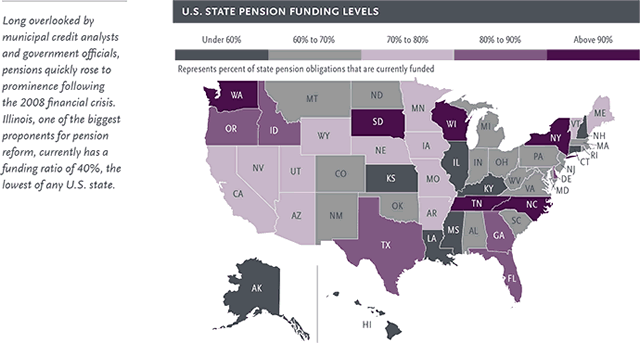
While the revenue side of the U.S. fiscal ledger exhibits gradual but steady improvement, it is the liability side that investors must be wary of. Long overlooked by municipal credit analysts and government officials, pensions quickly rose to prominence following the 2008 financial crisis as unfunded obligations ballooned. Estimates on the magnitude of pension funding shortfalls vary dramatically, primarily due to differences in asset return assumptions. A recent study by Northwestern University puts the total unfunded pension liability for U.S. cities and counties at $574 billion, adding to the $3 trillion in estimated U.S. state unfunded pension liabilities. Illinois, one of the biggest agitators for pension reform, has a funding ratio of 40 percent, the lowest of any U.S. state.
Source: U.S. Census Bureau. Data as of September 30, 2013.
The intense scrutiny placed on pension obligations has obscured investors’ attention from OPEB burdens, which we believe pose as significant a risk. A November 2013 report by Pew Charitable Trusts showed that the 30 most populous metropolitan U.S. cities faced $225 billion in aggregate unpaid commitments – $121 billion for pensions and $104 billion for OPEB. OPEB are retiree benefits covering healthcare costs. Relative to pension liabilities, the lack of transparency regarding OPEB has led to decreased attention from rating agencies, investors, and politicians.
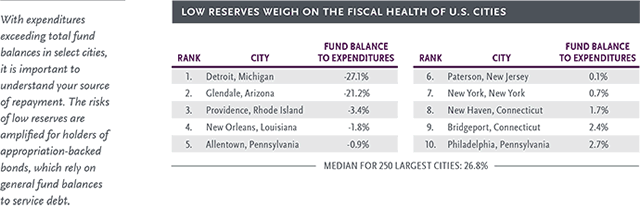
Source: Wall Street Journal. Data is based on the public filings of the 250 largest U.S. cities that have reported their 2012 financial results as of August 2013.
The widespread coverage of the municipal sector in the financial media has put investors on alert, seeking to identify the “next Detroit.” However, the next significant credit event in the municipal market is unlikely to catch investors by surprise, just as Detroit’s travails were fairly well telegraphed. Unlike credit events in the corporate bond market that can arise suddenly, the factors contributing to Detroit’s $18 billion bankruptcy (growing debt, large pension liabilities, the economic deterioration of the auto industry, etc.) were easily observable for decades.
Since 1950, the city of Detroit has experienced a 61 percent drop in population, resulting in large debt burdens being serviced by an increasingly smaller tax base. Detroit’s direct debt equals 12 percent of the city’s property valuation (rising to 23 percent when including pension obligations). The experiences of Detroit, Illinois and Puerto Rico serve as catalysts for change, usually in the form of pension reform or renewed fiscal conservatism. The challenges faced by the municipal sector have shed light on its complexity, which has long been underappreciated. Current fiscal headwinds in select municipalities can offer investors, who are able to identify strong, improving credits, an attractive entry point to the municipal markets.
Source: Moody’s, Bloomberg. Data as of September 30, 2013.
Investment Implications
Turning Current Challenges Into Future Opportunities
The market’s disproportionate fixation on select credit issues creates opportunities for sophisticated investors with the ability and resources to evaluate credits throughout the highly diverse $3.7 trillion municipal market. Devising an investment strategy to take advantage of current market dislocations relies both on optimal positioning on the yield curve as well as identifying credits offering strong structural protection. Amid the massive wave of bond fund outflows, there has been a reallocation of capital by individual investors. The majority of this year’s net municipal bond fund withdrawals have come out of longer-maturity funds. This can be partly attributed to interest-rate concerns, given the higher duration of longer-dated bonds, but the composition of the investor base has also played a role.
As the market share of individual investors has increased to 73 percent from 34 percent in 1980, this has created a dearth of demand for longer-term municipal bonds. Individual investors are naturally predisposed to shorter-dated debt to meet their near-term income needs. Additionally, property & casualty (P&C) insurance companies, another key buyer of municipal debt, also prefer shorter-term bonds as they seek to maintain a liquid, high-quality portfolio to meet unexpected liquidity requirements. Devoid of a natural buyer, longer-dated bonds represent an area of the municipal market we find attractive. The 5s/30s single A-rated slope (the difference in yield between 30-year and 5-year tax exempt municipal bonds) has widened by 120 basis points since the start of the year, while the corresponding U.S. Treasury slope has remained flat.
Below, we have included our Municipal Market Heatmap detailing the areas we find attractive. While it has become easier, over the years, to evaluate the fiscal health of U.S. states, the analysis remains increasingly more difficult at the city and county level given the localized nature of issues. We view this as a potential opportunity as local bonds typically trade cheap to comparable state issued bonds. While varying from state to state, the yield pickup between local GOs and state GOs is, on average, 25 basis points. The yield pickup increases when comparing state GOs to local appropriation-backed bonds.
Another one of our investment themes is our preference for bonds secured by revenue streams over local appropriation-backed debt. Bonds backed by dedicated revenue streams cannot be diverted by the city, regardless of the city’s solvency status. The stigma associated with distressed cities tends to impact essential service bonds, which may be structurally sound. These situations can provide investment opportunities where capital can be deployed at yields 50 to 75 basis points higher relative to comparable credits without the associated headline risk. Bonds backed by water and sewer utility systems are good examples as they have proven to be well-insulated from impairment, even in situations of local government bankruptcies, such as Detroit or Stockton. Since utilities provide an essential service, delinquencies tend to be muted even in economically strained areas.

Source: Guggenheim Investments. Data as of September 30, 2013.
Without understanding the specific source of repayment, it is difficult to make informed investment assessments on the risks of a particular municipal bond. Similar to corporate credit, hierarchy within the capital structure matters. For example, being an unsecured creditor to the general fund of distressed municipality is materially different than owning a secured claim backed by a dedicated revenue stream within that same municipality.
Analyzing a complex and fragmented market where many issuers have significant structural challenges takes a significant amount of resources. Absent these resources, it is difficult to see the trees through the forest, which explains the massive withdrawals from municipal bond funds. Given the 27 percent year-to-date rally in equities, the municipal sector’s negative performance has investors questioning its investment merit. However, we believe this is an inopportune moment to allow headline noise to color one’s fundamental view. We see attractive opportunities in areas of the market recently vacated en masse by investors, such as intermediate to longer-duration bonds, and select revenue bonds of distressed cities. For investors with the ability to decipher the complex municipal market, we believe current market dislocations offer the opportunity for strong returns.
IMPORTANT NOTICES AND DISCLOSURES
Past performance is not indicative of future results. There is neither representation nor warranty as to the current accuracy or, nor liability for, decisions based on such information. This article is distributed for informational purposes only and should not be considered as investment advice, a recommendation of any particular security, strategy or investment product or as an offer of solicitation with respect to the purchase or sale of any investment. This article should not be considered research nor is the article intended to provide a sufficient basis on which to make an investment decision. The article contains opinions of the author but not necessarily those of Guggenheim Partners, LLC its subsidiaries or its affiliates. The author’s opinions are subject to change without notice. Forward looking statements, estimates, and certain information contained herein are based upon proprietary and non-proprietary research and other sources. Information contained herein has been obtained from sources believed to be reliable but is not guaranteed as to accuracy. This article may be provided to certain investors by FINRA licensed broker-dealers affiliated with Guggenheim Partners. Such broker-dealers may have positions in financial instruments mentioned in the article, may have acquired such positions at prices no longer available, and may make recommendations different from or adverse to the interests of the recipient. The value of any financial instruments or markets mentioned in the article can fall as well as rise. Securities mentioned are for illustrative purposes only and are neither a recommendation nor an endorsement. Individuals and institutions outside of the United States are subject to securities and tax regulations within their applicable jurisdictions and should consult with their advisors as appropriate. Guggenheim Investments represents the following affiliated investment management businesses of Guggenheim Partners, LLC: GS GAMMA Advisors, LLC, Guggenheim Aviation, Guggenheim Funds Distributors, LLC, Guggenheim Funds Investment Advisors, LLC, Guggenheim Partners Investment Management, LLC, Guggenheim Partners Europe Limited, Guggenheim Partners India Management, Guggenheim Real Estate, LLC, Security Investors, LLC and Transparent Value Advisors, LLC. Guggenheim Partners Investment Management, LLC (GPIM) is a registered investment adviser and serves as the adviser to the strategy presented herein. GPIM is included in the GIPS compliant firm, Guggenheim Investments Asset Management, and is also a part of Guggenheim Investments. This material is intended to inform you of services available through Guggenheim Investments’ affiliate businesses. No part of this article may be reproduced in any form, or referred to in any other publication, without express written permission of Guggenheim Partners, LLC. © 2013, Guggenheim Partners, LLC.


