When investors feel like the stock market is toppy, as many do now, they often compare what they expect stocks and bonds to pay. The yield on stocks should offer a premium over bonds to compensate for higher risk, and it usually does. When this so-called equity risk premium shrinks or disappears entirely, investors take it as a bad omen.
Some say the equity risk premium is flashing that very warning now. Don’t rush to swap your stocks for bonds yet, though. The measure can be tricky to calculate, and after landing on a sensible approach, the stock market does not appear to be dangerously high.
It’s not entirely obvious how the equity risk premium should be calculated, but popular approaches make little sense. One compares the S&P 500 Index’s dividend yield to the 10-year Treasury yield. The result is alarming because the current dividend yield of 1.1% is a fraction of the 10-year yield of 4.5%.
The problem with that math, though, is the dividend yield doesn’t capture all the money companies make, which is ultimately what drives stock returns. Dividends represent only the portion of profits companies distribute to shareholders, and that portion has been shrinking for decades. The dividend yield is thus a weak gauge of the payoff from stocks.
A better and equally common approach substitutes earnings for dividends, but the resulting equity risk premium mixes apples and oranges because Treasury yields are nominal and earnings yields are real — interest payments on Treasuries don’t adjust for inflation whereas earnings yields are driven in part by changes in prices.
For a like comparison, earnings yields should be measured against real Treasury yields as reflected in breakeven rates. The 10-year breakeven, which is the difference between plain vanilla and inflation-protected 10-year Treasuries, is 2.2%. That’s a far lower hurdle for earnings yields than the nominal 10-year Treasury yield of 4.5%.
After making those adjustments, investors are left with the thorniest question of all, which is how to pin down profits. The earnings yield changes significantly based on the numbers one chooses. Earnings estimates for the next 12 months produce a yield of 5%, whereas earnings results for the past 12 months cut the yield to 4%. Cyclically adjusted earnings, which are typically an average of inflation-adjusted earnings over the past 10 years, slash the yield further to 2.6%, barely above the real 10-year Treasury yield.
Each measure has its merits, but none are fully satisfying. Forward estimates best reflect companies’ current earnings power, but they mostly extrapolate from recent results, so they’re not good at anticipating turns. Trailing one-year profits reflect actual results, but annual earnings can be volatile, making the earnings yield noisy. A multiyear trailing average of earnings smooths out the volatility, but it understates earnings most of the time because profits usually rise.
That understatement can be huge when earnings growth is higher than usual, as it has been for several years. Trailing one-year earnings have exceeded cyclically adjusted earnings by an average of 11% since 1881, according to data compiled by Yale University professor Robert Shiller. They’re more than 60% higher today. That’s because S&P 500 earnings have grown by a blistering 13% a year since 2021, when they recovered from their pre-pandemic lows. That’s nearly double the growth rate since the 1950s and more than triple the longer-term rate going back to the 1870s.

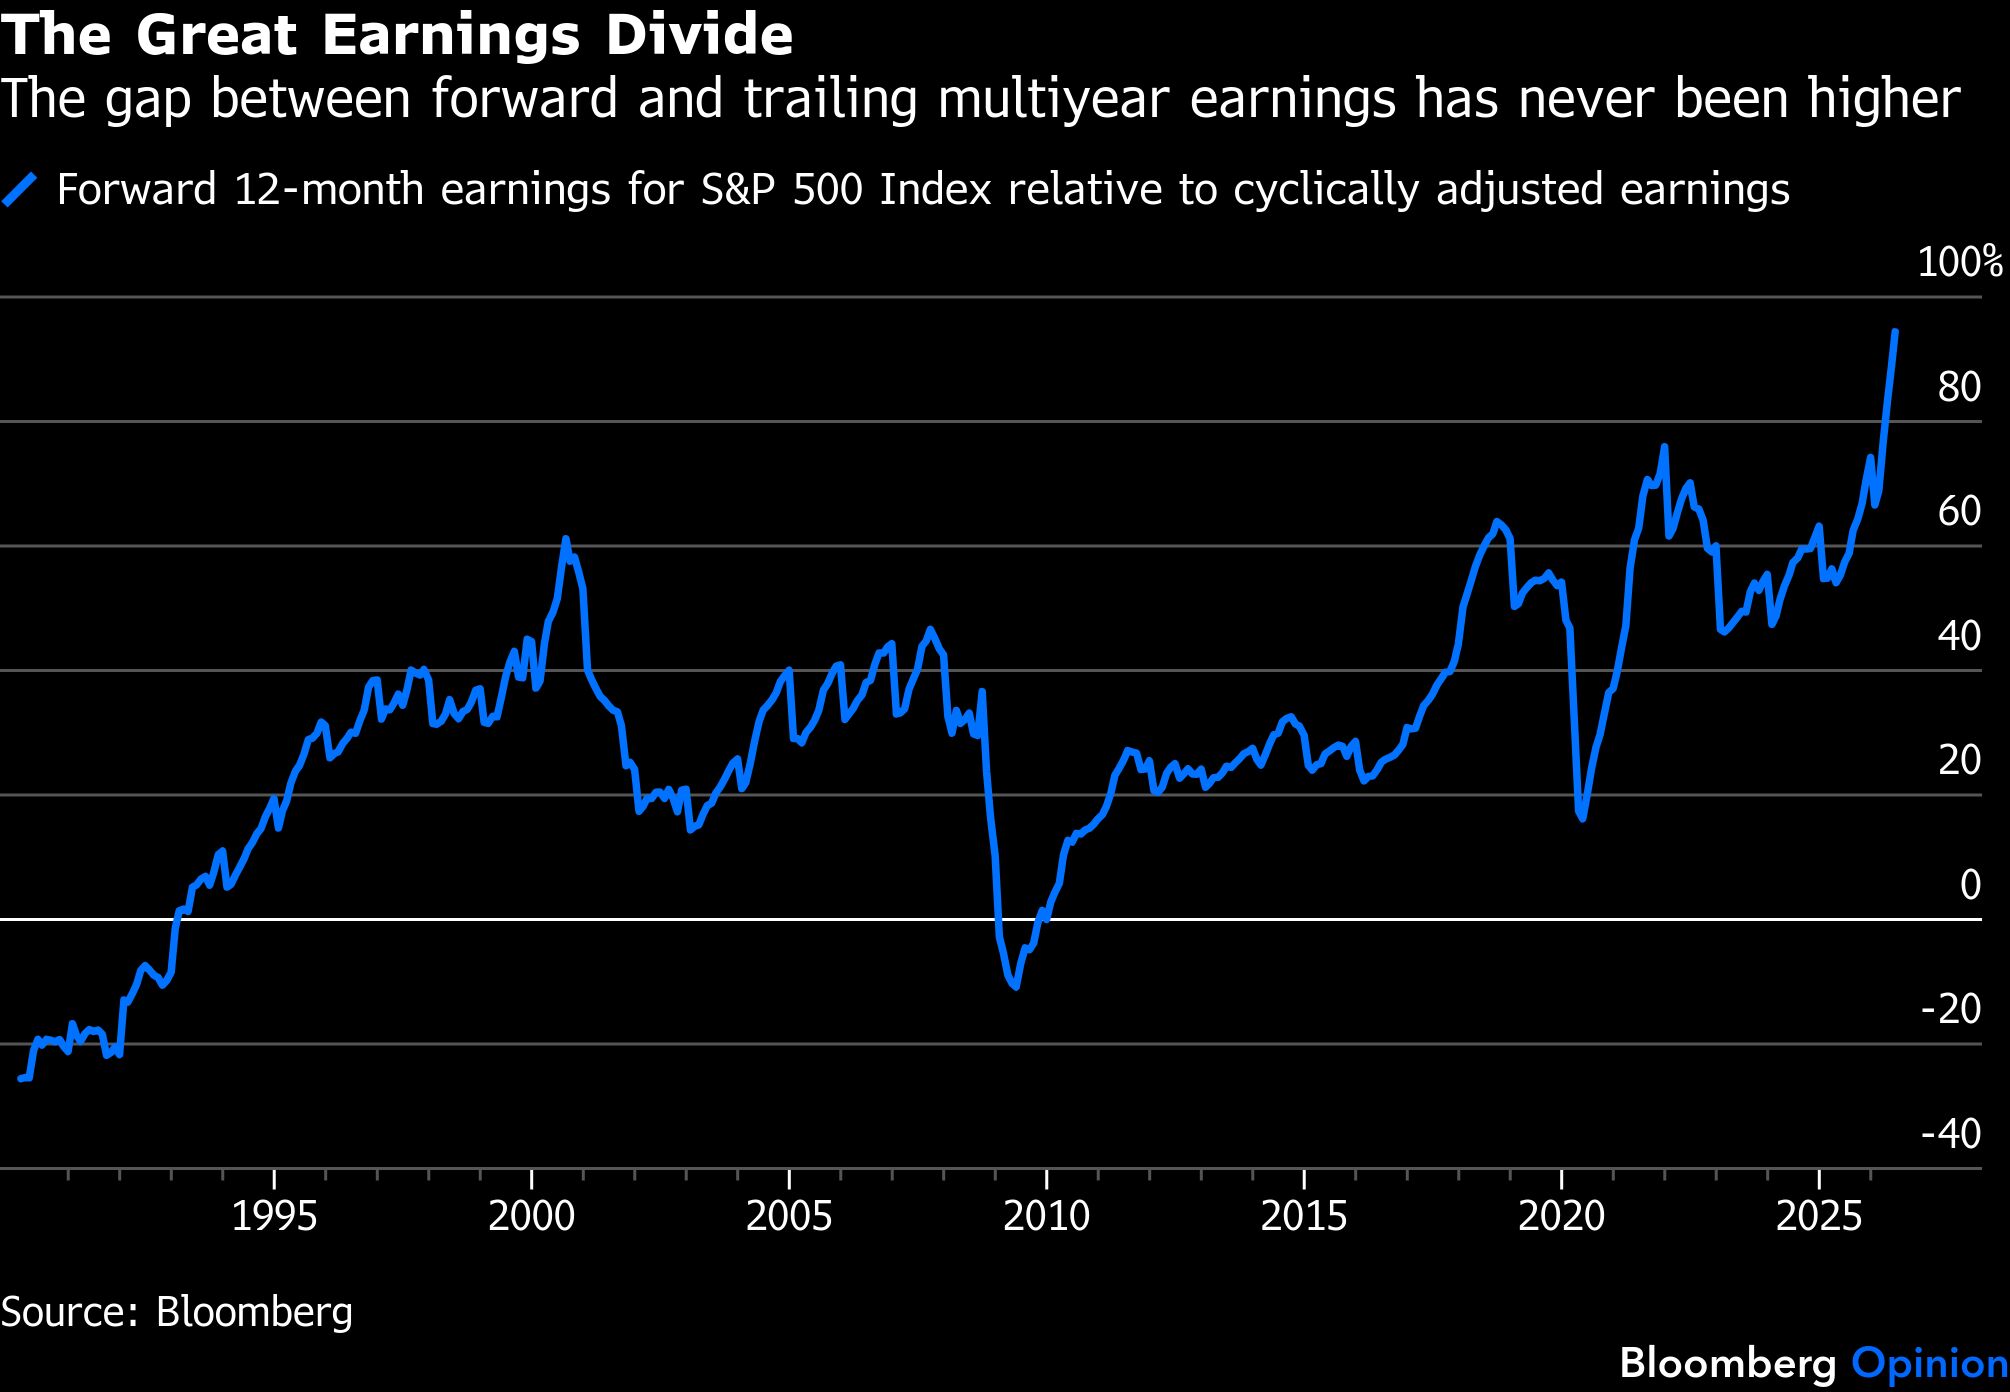
Expectations are sky-high on the heels of recent growth. Consensus estimates for S&P 500 earnings are $365 a share over the next 12 months, nearly double cyclically adjusted earnings of $188, according to numbers compiled by Bloomberg. That’s by far the biggest spread between the two back to 1990, the first year for which analyst estimates are available.
Neither is likely right. Much of the recent earnings growth has been generated by the big technology companies that continue to churn out reliably fat profits, so cyclically adjusted earnings are probably too conservative. On the other hand, historical earnings volatility strongly suggests that growth will slow or that profits will pull back at some point, so forward estimates may be too optimistic.
One way to balance the two considerations is to blend past and future. I have proposed normalizing earnings with an eight-year average consisting of five years of historical earnings and three years of forward estimates. That produces S&P 500 earnings of $333 a share, or an earnings yield of 4.5%.
The resulting equity risk premium of 2.3% over the current 10-year breakeven is below average but not hugely. In other words, the stock market is expensive but not alarmingly so. If the equity risk premium is your preferred guide to stocks and bonds, there’s still reason to think that taking more risk will pay.
A message from Advisor Perspectives and VettaFi: Discover something new! Click here to register for our upcoming webcasts.
Bloomberg News provided this article. For more articles like this please visit
bloomberg.com.
Read more articles by Nir Kaissar