Elevated market volatility means stocks are going down, right? Wrong.
I confess that when the VIX, the Cboe Volatility Index, spikes, I brace for stock market declines. Judging by investors’ anxious reaction to the VIX’s surge following President Donald Trump’s big tariff announcement last month, I’m far from alone.
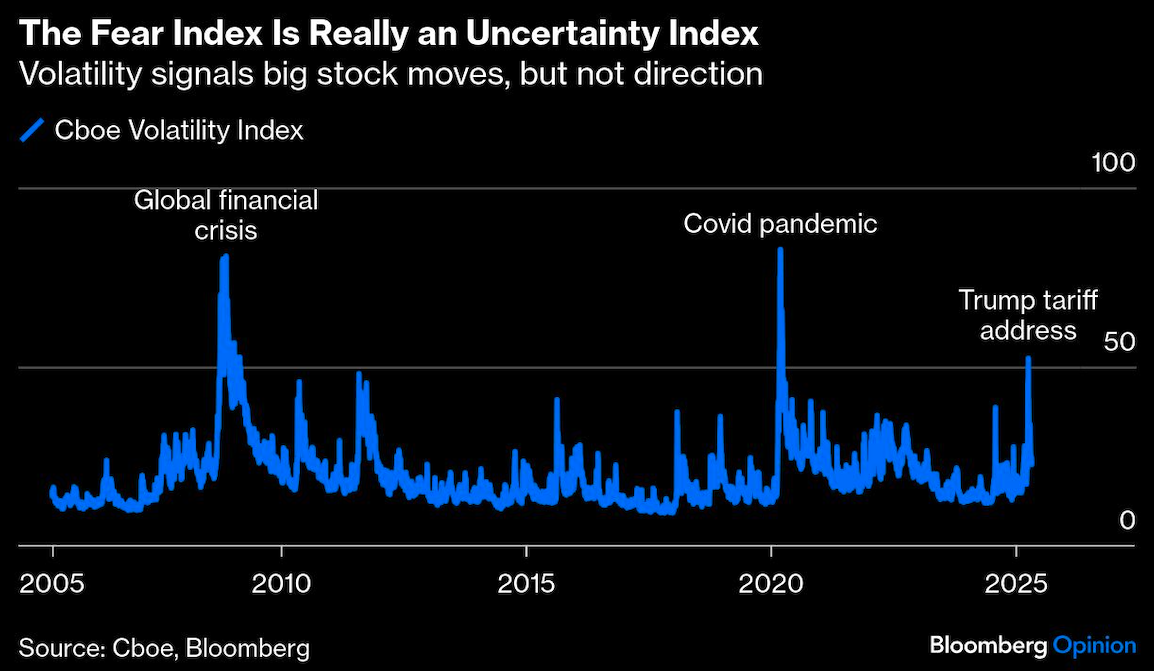
The VIX, a gauge of the S&P 500 Index’s expected 30-day volatility, nearly tripled over the four trading days that followed the White House’s announcement on April 2. It closed at 52 on April 8, the third highest level since its inception in 1990, exceeded only during the 2008 financial crisis and Covid pandemic.
As we now know, investors’ fear of an imminent stock market collapse was misplaced. The market hit bottom on April 8, the same day as the VIX peak. The S&P 500 is up 13% since then through Monday, a huge gain in a short time. The VIX correctly signaled higher than usual volatility — that changes in stock prices would be bigger than normal. It’s just that those big moves turned out to be gains rather than losses, contrary to what many investors expected.

That shouldn’t be surprising. Volatility measures the degree of price changes, not directionality. High volatility can mean big price changes up or down, just as low volatility implies smaller price changes in either direction. So, when the VIX is elevated, big gains could follow just as plausibly as heart-stopping declines, as the market reminded investors these past weeks.
Knowing that, I’m not entirely sure why I tend to associate an elevated VIX with a declining market. Maybe I’m subtly swayed by the VIX’s ominous nickname, the “fear index,” a nod to the panic that grips investors when the VIX spikes.
The negative association is mostly unwarranted. While the VIX has been a good gauge of near-term volatility, it has not reliably signaled the market’s direction. Since 1990, the VIX has been highly correlated with the S&P 500’s forward 30-day volatility, as measured by annualized standard deviation (0.69). But there has been almost no correlation between the VIX and the S&P 500’s subsequent 30-day price performance (0.1).
In fact, taking investing cues from the VIX is likely to be a losing proposition because the market moves higher most of the time regardless of the VIX’s level. I ranked the VIX’s daily values in descending order since 1990 and broke them into quintiles. For the top quintile, meaning the one with the highest levels, the S&P 500 was up 68% of the time over the following 30 days. That win percentage was almost identical for the bottom quintile and nearly the same for the middle three.
Given the disconnect between the VIX and the market’s direction, a better nickname would be “uncertainty index.” Uncertainty is usually at the root of volatility, after all, and like volatility, uncertainty doesn’t imply a result. Sometimes uncertainty ends terribly, as it did during the financial crisis, and sometimes it passes harmlessly, as it did after fears of a US debt default in 2011. Mostly it just hangs around ambiently while businesses continue to grow earnings, which is why the market grinds higher most of the time regardless of the VIX.
It’s important to distinguish, however, between the level of the VIX and changes in the VIX. A rising VIX is highly negatively correlated with a declining market, and vice versa (-0.68 comparing concurrent 30-day changes in the VIX and the S&P 500). But investors can’t predict the VIX’s direction reliably any more than they can the market. And by the time the VIX is elevated, the market declines have usually passed.
That’s exactly what happened last month. The S&P 500 nosedived as the VIX rose. By the time the VIX looked alarmingly high, the bottom was in. That doesn’t mean the market’s sudden pivot was inevitable, obviously, but the VIX’s history suggests that the odds favored a rebound.
So where are we now? The VIX is at around 24, less than half its level on April 8 but still higher than its long-term average of closer to 19. That probably means more volatility ahead, a sentiment echoed by a growing number of corporate executives who say that continuing uncertainty around tariffs makes it harder to plan and forecast.
It’s easy to see why the VIX has been bracing for bigger than usual market moves. Trump’s sweeping tariffs are a huge gamble with uncertain and potentially significant outcomes. If they ultimately result in deals that reduce trade barriers for US companies, the market is likely to celebrate. But if an extended trade war raises the cost of doing business, stocks won’t be so happy.
That uncertainty may result in a higher VIX than anyone wants for a while longer. Just don’t assume it means the market is headed lower.
A message from Advisor Perspectives and VettaFi: To learn more about this and other topics, check out some of our webcasts.
Bloomberg News provided this article. For more articles like this please visit
bloomberg.com.
Read more articles by Nir Kaissar