Constructing Anti-Fragile Portfolios Amidst Financial Repression
Membership required
Membership is now required to use this feature. To learn more:
View Membership BenefitsAdvisor Perspectives welcomes guest contributions. The views presented here do not necessarily represent those of Advisor Perspectives.
"Investing is simple, but not easy." – Warren Buffett
"Perhaps, however, it was the epoch that made the man as opposed to the man that made the epoch." – Bill Gross
In a benchmark-driven investment world, the manager’s primary task is frequently drowned in the noise of a short-term relative performance derby1. So, what is the investment function's primary task? It boils down to preserving and growing client's wealth at inflation-adjusted rates, consistent with long-term returns of the requisite asset class, and to do so without taking undue risk of a “permanent loss of capital”.
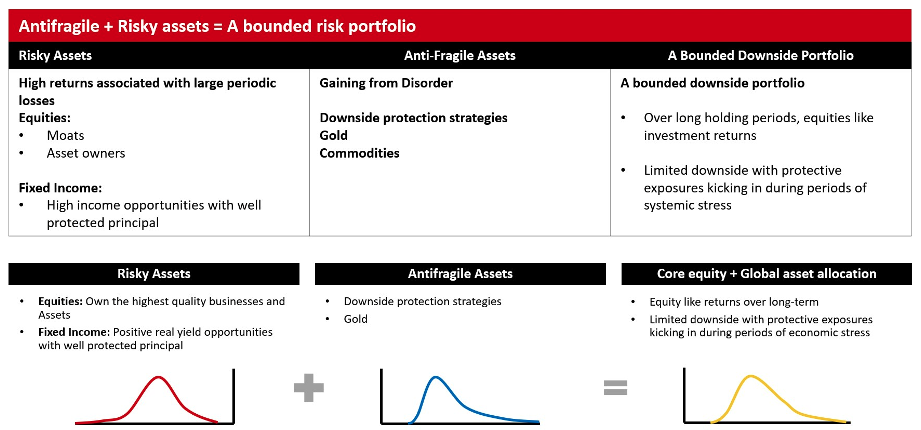
The anti-fragile portfolio. The chart below illustrates the types of assets required to construct a portfolio designed to do well across different investment and economic environments.
Figure 1: An illustrative portfolio allocation
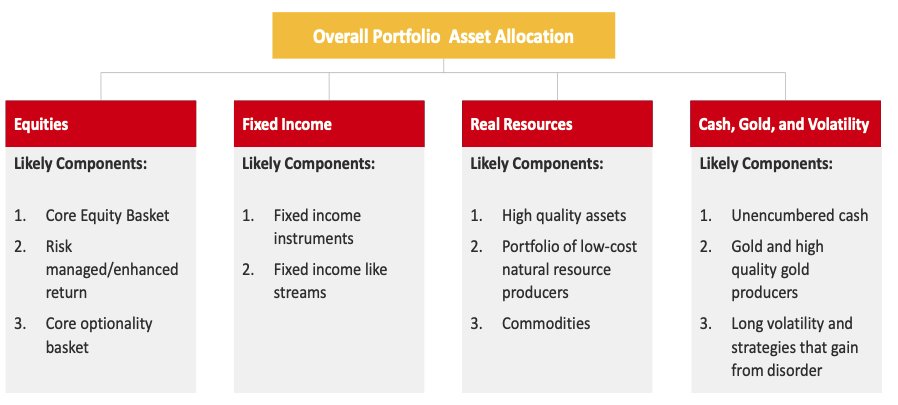
To build portfolios that are genuinely robust across market environments, we need to combine various asset classes, especially asset classes with relatively low correlations.
Three problems: Investment and economic environment
As we survey the investment world, three problems inhibit an investors' ability to construct robust portfolios that can generate healthy inflation-adjusted returns. First is the equity pricing bubble. The broader equity markets are priced for poor prospective returns – well below the historical real returns from equity. Two, the credit – fixed income bubble. Interest rates are close to zero or negative in most advanced economies. Indeed, "real" rates are in negative territory for all significant economies, developed as well as emerging. And three, an unchecked appetite to resort to quantitative easing (QE). While the coronavirus pandemic drove policymakers to engage in extensive stimulus packages and even more QE, the trend towards the depreciation of cash has been in place for much of the past two decades (indeed since centuries across various civilizations)!
Problem #1: Equity Bubble
Much of the U.S. equity market is priced for poor 10-year returns. The mispricing is much more acute for companies thought of as “disruptors,” the so-called new economy businesses. Indeed, such companies have been priced for abysmal returns not just in the U.S. but globally. At the same time, a handful of businesses that own or operate high-quality assets or possess franchises not designated as “disruptors” are priced for healthy returns – a rather bipolar market behavior.
Overallocation to US equities. As we discussed here2, over the last century, U.S. equity markets were one of the two best-performing markets across all developed economies. The investment industry touts the U.S. equity market returns as representative for overall equity market returns driving a larger share of investment wallets to equities. Of course, what is ignored, especially during periods of runaway bull markets, is the risk associated with such investments. As we showed in the article referenced above, there is nothing "normal" about equities' downside risk. An important point relevant to investors with long horizons is that the bad equity outcomes are associated with really poor economic outcomes. Just when the rest of an investor’s wealth and income are stressed, an investment portfolio would be experiencing a large drawdown as well.
Whereas U.S. equities accounted for 15% of the global equity market capitalization in the year 1900, the higher comparative return has driven that proportion to greater than 50% by 2016. Indeed, the U.S. equity market's weight has climbed even further, as evidenced by the MSCI ACWI Index, wherein the U.S. accounted for 57% of the global weight as of December 31, 2020.
Figure 2: Relative sizes of world equity markets, 1900 vs. 20163
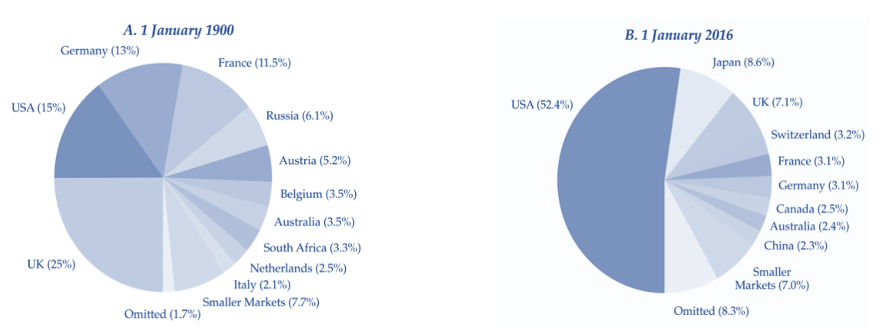
If you are so inclined to bet on U.S. equities' continued superior performance, think of the resultant global equity market capitalization mix. Indeed, a similar superior performance of U.S. equities will result in the U.S. accounting for nearly 80% of global equity capitalization over the next hundred years.
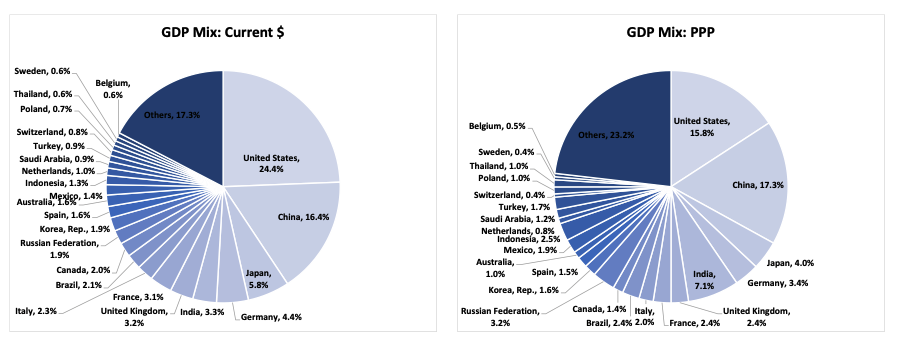
This will further accentuate the already wide gap between the US GDP weight and equity market capitalization weight. As is seen in Figure 3, the US accounts for only about 25% of world GDP. When considered in purchasing power parity (PPP) terms, it accounts for about 16% of world GDP. If the developing world continues to grow faster – as is likely – that proportion will decline further.
Figure 3: Global GDP Mix – Current Dollars and PPP (Source: Data from World Bank, MAEG's calculations)
U.S. equities: Priced for poor expected returns. Since the coronavirus crisis low in March 2020, U.S. equities have staged a recovery that is nothing short of astounding. Over the past nine months, U.S. equities have moved up by nearly 75%. As managers focused on long-term investment returns, one of the most fundamental rules of investing is that you should expect to earn lower returns when you pay a higher price for a security. While it is indeed true that the lower expected return on equity securities may be higher still than that in fixed income securities, the absolute returns that one should expect do decline as the price being paid for a security rises.
The chart below shows the 12-year estimated nominal returns for the S&P 500 as calculated by Hussman Strategic Advisors. The 12-year estimated returns for the S&P 500 are currently in the same zone as that experienced during the tech bubble and the peak just before the Great Depression.
Figure 4: John P. Hussman’s Estimated 12-year nominal annual total returns for the S&P 500 4
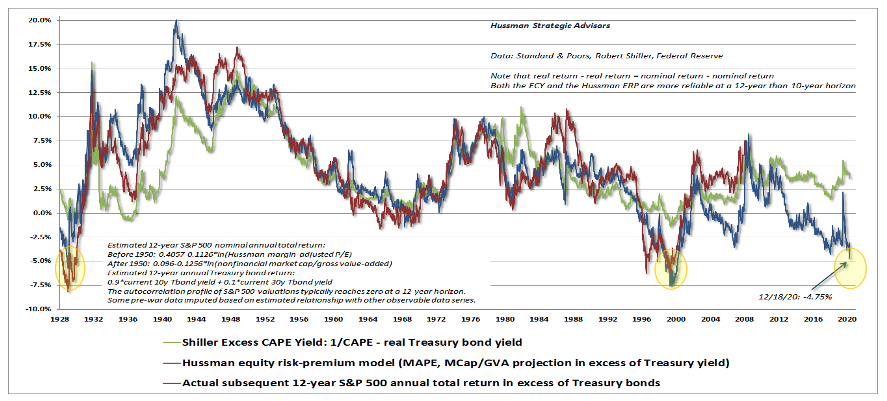
None of this means that equity markets have peaked and will start a decline anytime soon. Financial markets can stay irrational for longer than we estimate! It does however mean that investment allocations require careful consideration and only to those specific pockets that are priced to earn 9%+ returns over holding periods extending to 10 years.
Investment mispricing – Value versus growth and U.S. versus rest of the world. Whereas the broader equity markets are priced for poor returns, there is an important mispricing that has developed over the past decade. New economy businesses are priced at extremely high valuations. At the same time, old economy businesses have been priced at the other extreme. This is seen in the extreme performance differential between “value” and “growth” stocks. As shown in Figure 5, value has sustained its worst performance against growth of the past 90 years. Notably, after sustaining an extended period of poor performance, the relatively poor performance accelerated further downwards over the last three years.
Figure 5: Value vs. Growth – Annualized factor returns (Source: Kenneth R. French, US Research Returns Data, French/Fama 3 Factors)
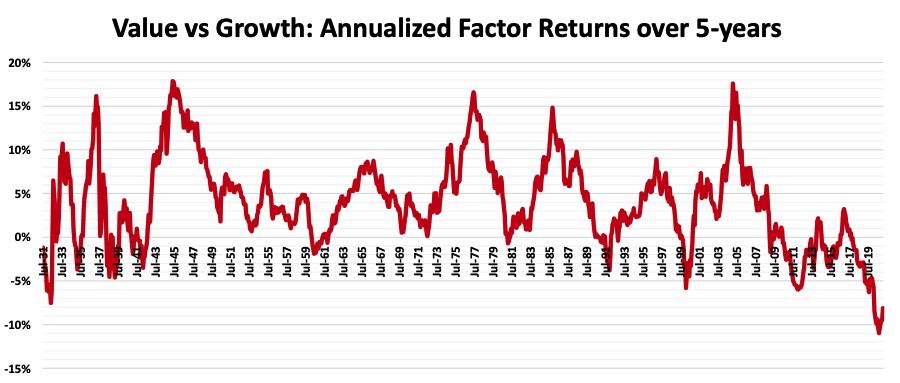
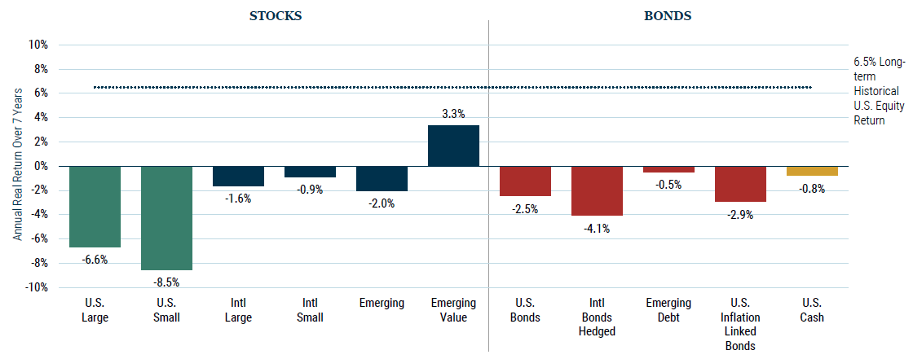
Figure 6 shows the forecasted seven-year “real” returns for various asset classes as per GMO. U.S. equities are priced for much lower returns when compared to their international brethren. Off all asset classes tracked by GMO, emerging value is priced for the best intermediate-term returns.
We corroborate GMO’s estimates and similarly find U.S. equities to be priced for much worse returns than other developed and emerging markets. At the same time, we see several high-quality businesses classified as old economy while possessing best-in-class industry positions being priced for healthy investment returns.
Figure 6: GMO’s Forecast of 7-year returns for various asset classes as of November 30, 20205
Problem #2: The fixed income bubble
Fixed income has no income in it, with interest rates artificially pegged to the zero bound. At the same time, debt levels across corporates and sovereigns are reaching out to new highs.
At its core, ownership of a fixed-income security like a bond means lending money to a borrower. When we lend money out, we essentially forego current consumption in favor of future consumption. Foregoing current consumption requires an incentive, a compensation for accepting consumption in the future over the present. The required lending rates are composed of four components that can be segregated in two primary parts as below.
-
Time preference component
- Compensation for inflation
- Compensation for foregoing current consumption
-
Investment component
- Compensation for credit risk accepted
- Excess investment return
Figure 7 shows interest rates in the U.S., Germany, Japan, and Switzerland. Having trended lower for nearly 40 years, rates worldwide have reached close to zero or have turned negative. When that happens, the very first component of the required return, compensation for inflation itself, is questionable. When accepting such low rates, investors make an implicit assumption that inflation will stay close to zero or negative for extended periods. Of course, the idea of compensation for other components doesn't even arise unless one is pricing a deep and extended deflation.
Figure 7: Interest Rates in Developed Markets6
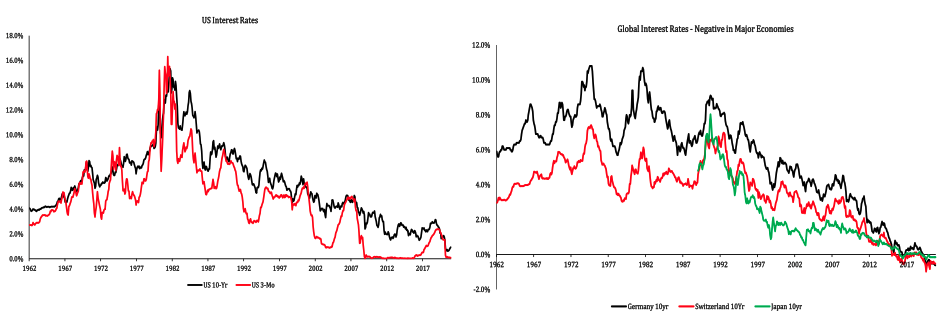
One of the reasons driving investors to accept such poor returns, and in case of negative yields, eager to pay a borrower for the privilege of lending money, is their belief that they can sell their holdings to someone else at even lower yields – most likely the central banks! What has made the pricing of interest rates the most extreme in recorded history is the added belief that central banks will not allow rates to rise materially and most astonishingly – inflation will not return. This belief in the power of central bankers ignores the lessons of history. It also makes the bubble in interest rates one of the biggest in our lifetimes.
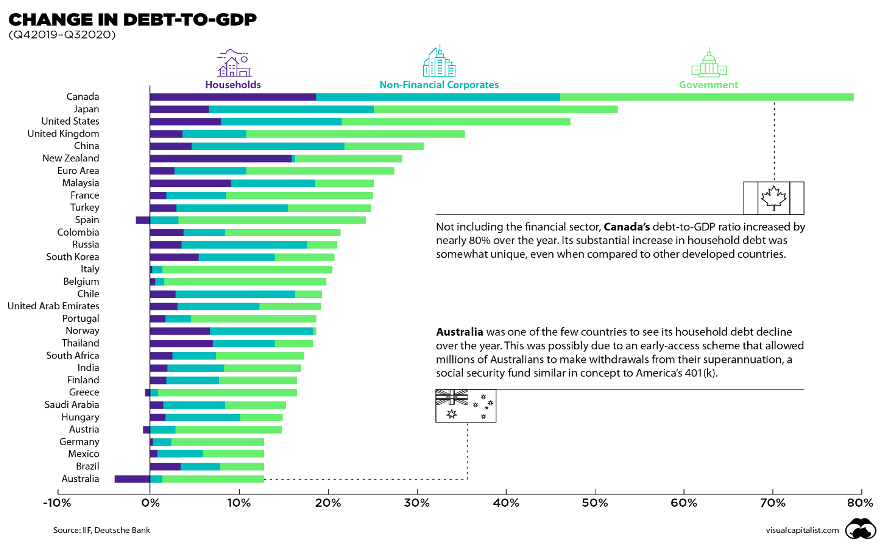
While rates have stayed in extremely low territory, debt levels have continued to rise. As per the Institute of International Finance7, in Q3 2020, overall debt-to-GDP ratios jumped to 432% in developed markets and 250% in emerging markets, with China reaching 335%. Figure 8 shows the change in the debt-to-GDP ratio between Q4 2019 and Q3 2020. The coronavirus pandemic has driven leverage levels to rise rather substantially.
Figure 8: Change in Debt-to-GDP8
Problem #3: Depreciation of cash
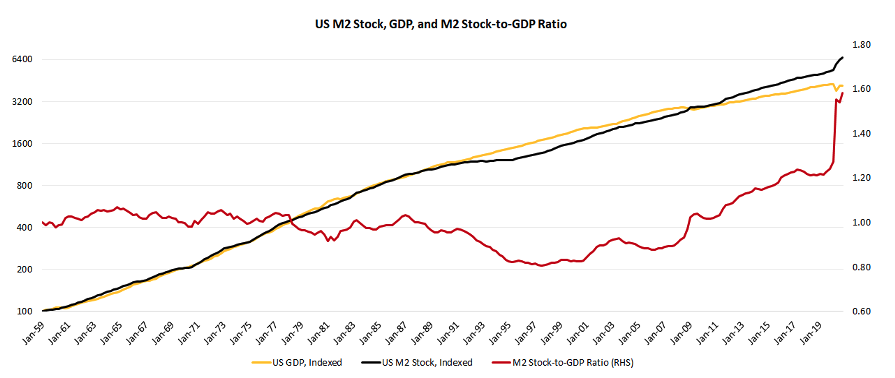
Figure 9 shows the evolution of the U.S. GDP, M2 Money Stock, and the M2 Stock-to-GDP ratio over the past six decades. Whereas the ratio oscillated around one for the first three decades, it trended lower during the 1990s as the economy grew faster than the money stock. However, ever since the tech bubbles bursting, policymakers have found a new elixir in the form of an ever-expanding money supply. The result is that the money supply has grown much faster than the GDP. The coronavirus crisis has seen an extreme jump in the M2 Stock-to-GDP ratio, which now stands close to 1.6x, a far cry from an average of around 1x between 1960 and 2010.
Figure 9: US M2 Stock-to-GDP Ratio9
This devaluation of cash raises significant risk to the value of money itself and gives rise to the possibility of changes to the monetary structure – either extreme inflation or extreme deflation. Further compounding asset allocation decisions is that, as against providing compensation for such risks, cash has a negative real (and in some cases negative nominal returns), much like fixed income securities.
Constructing sensible portfolios in such an environment
As the discussion above highlights, the task of constructing multi-generational portfolios isn't as straightforward as combining a bunch of assets or relying on the traditional 60:40 portfolios to do the job. Sensible portfolio construction in such an environment requires careful consideration of risks, expected returns and a willingness to shun index benchmarks.
We suggest that the appropriate approach to portfolio construction is to combine a core equity strategy with an opportunistic asset allocation strategy.
The core equity strategy should ensure that it does not invest in any business with a poorly structured balance sheet or has a business model that depends on “free money” policies. On the other hand, the asset allocation strategy should identify and put together a basket of assets that have a high probability of surviving through varied economic outcomes and generate a healthy investment return in the interim.
The core equity strategy
The core equity strategy should invest in two sets of high-quality businesses. One, businesses that are not exposed to disruption, have deeply entrenched franchises, and are priced for a healthy investment return. Two, “disruptors” that have well-established franchises and are priced for a reasonable return.
Importantly, by investing in a selected basket of the highest quality businesses that have durable competitive advantages, clean balance sheets, and healthy corporate governance, it will generate superior risk-adjusted returns across economic environments.
Keeping with our view of U.S. equities being poorly priced, it should have much lower exposure to the U.S. and larger exposure to other countries. We recommend exposure to U.S. equities be limited to a handful of businesses which are priced well to allow for healthy 10-year investment returns.
The core equity strategy should be designed to act defensively during profound market dislocations. The defensiveness of such a strategy will be embedded into the quality of businesses underlying the portfolio so constructed. The highly desired nature of their products and services combined with a sound balance sheet will allow them to survive through deflationary deleveraging. Those with poorly structured balance sheets will go astray. On the other hand, we expect these carefully selected businesses to generate superior "real" performance during inflationary periods driven by a superior ability to pass on cost increases.
Global asset allocation strategy
The global asset allocation strategy should comprise multiple asset classes within an opportunistic approach.
Equity. Its equity allocation should be comprised mainly of deep value positions. it should employ a distinct approach to its equity investing that focuses on:
- Asset owners as against earnings-driven businesses: this ensures that there is significant realizable value even if the company goes bust
- Businesses that operate within the cheapest half of the cost curve: there is a margin of safety for the business as half of the industry's capacity operates at a higher cost
- Business value driven by the source of value: Infrastructure Assets, Reproducible Assets (steel, paper, refining, etc.), Endowed Assets (REITs, E&P, Mining, etc.), and Regulated Assets
- Bespoke valuation tools like replacement costs of assets (RCA), net asset value (NAV), liquidation value, etc. as against multiples-based valuation heuristics.
Fixed-Income. In an environment of financial repression, investors have to contend with challenges in constructing fixed-income cash flow streams. One solution we propose is to invest in a highly selective basket of businesses that own extremely high-quality assets that generate annuity-like cash flows. The fixed-income like cash flows of these businesses lend them the characteristic of quasi-fixed income securities. Note that we do not recommend a general allocation to utilities. Investors need to be highly selective in their selection of such businesses. We suggest focusing on following attributes:
- Owners of extremely high-quality assets:
- Toll-like businesses that own the highest quality of the assets with strong balance sheets; and
- Businesses that operate in asset-intensive industries (e.g. ports, airports, telecom towers, transmission & distribution and pipelines) and have leading cost positions that will likely sustain over an extended future.
- Priced for reasonable returns with a minimum 10-year estimated "real" return of 6.5% per annum; and
- Fixed-income-like cash flows.
Gold, long vols, and commodities. We recommend a core position in gold and gold equities. Additionally, opportunistic investing in derivatives when volatility is underpriced and futures when underlying commodities are mispriced in relation to the industry’s average and top-quartile cost of production allows the investor an ability to construct low-cost hedges against significant financial dislocations and inflationary outcomes.
With the devaluation of money raising risks around currency debasement, gold should act as an essential “antifragile” asset, a role that it has played rather effectively over centuries. We suggest a two-pronged approach to build this portion of the portfolio. One, via ownership of the lowest cost gold producers who have a long life of mine assets and sound balance sheets. And two, ownership of physical gold with gold that is separately held and stored. The mix of the two will depend on the market environment and the relative pricing of gold mining equities and gold bullion.
A bounded downside portfolio
Figure 10 shows the combination of a core-equity and asset allocation strategy. Combining the two should result in a portfolio that generates equity like returns over extended holding periods while limiting the downside. We recommend a mix of one-third core equity and two-thirds asset allocation. The downside limitation will become especially important as and when the three portfolio construction problems discussed earlier come home to roost.
Figure 10: Combined Portfolio
Summary
The task of constructing sensible multi-generational portfolios has been rendered murkier by asset price inflations caused by the extreme expansion of central bank balance sheets and unchecked government stimulus packages. Cash itself has seen rising risks related to extreme money supply expansion and a consequent rise in the monetary system's debasement.
In the wake of such an environment, investors need to be careful in their asset allocation decisions. They will need to make highly selective investment choices that are associated with healthy estimated 10-year returns. The core equity and asset allocation strategies, as discussed, are designed to identify specific pockets of opportunities. When appropriately implemented, they will allow investors to construct sensible investment portfolios.
Baijnath Ramraika, CFA, is a cofounder and the CEO & CIO of Multi-Act Equiglobe (MAEG) Limited and is the Executive Director at Sapphire Capital. Contact him at [email protected]. Baijnath’s thoughts and ideas can be read at his blog at www.symantaka.com
Prashant K. Trivedi, CFA, is a cofounder of MAEG and the CIO and Chairman of the Multi-Act Group of Companies.
MAEG is an investment manager and manages the Global Moats Fund, the Global Select Value Fund, the Global Select Private Credit SPC, and the Global Moats Investments LP.
1 “Like dogs chasing their own tails, most institutional investors have become locked into a short-term, relative-performance derby.” – Margin of Safety, Seth Klarman
2 The Biased History that Drives Excess Allocations to Equities, Advisor Perspectives, Baijnath Ramraika and Prashant K Trivedi
3 Source: The Biased History that Drives Excess Allocations to Equities, Advisor Perspectives, Baijnath Ramraika and Prashant K Trivedi
4 A Good Response to a Bad Situation, Hussman Funds: https://www.hussmanfunds.com/comment/mc201220/
5 GMO 7-Year Asset Class Forecast, February 28, 2021: https://www.gmo.com/americas/research-library/gmo-7-year-asset-class-forecast-february-2021/
6 Data source: Board of Governors of the Federal Reserve System (US) and World Bank via FRED
7 Source: Global debt to hit record $277 trillion by year end on pandemic spending splurge: IIF | Reuters
8 Source: Chart: Debt-to-GDP Continues to Rise Around the World (visualcapitalist.com)
9 Data source: Board of Governors of the Federal Reserve System (US) and U.S. Bureau of Economic Analysis via FRED
Membership required
Membership is now required to use this feature. To learn more:
View Membership Benefits