Advisor Perspectives welcomes guest contributions. The views presented here do not necessarily represent those of Advisor Perspectives.
In our previous article, The Biased History that Drives Excess Allocation to Equities, we discussed the idea that using US data as a proxy for overall market returns leads to an over-allocation to equities. Over the course of the past two centuries, the U.S. economy acquired a larger significance within the overall global economy. At the same time, its financial markets enjoyed a much larger success than that of most other countries.
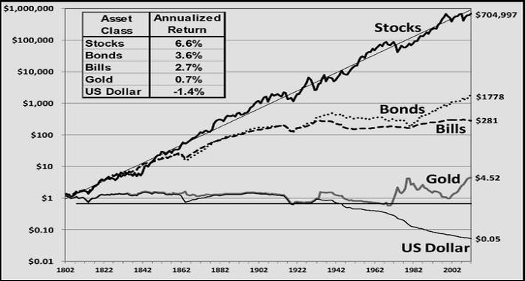
One of the most frequently used charts and data points, when it comes to equity returns, comes from Jeremy Siegel. The chart below, from Stocks for the Long Run, shows the inflation-adjusted returns from U.S. equities, bonds, bills, gold, and the dollar.
Figure 1: Long run inflation-adjusted returns from U.S. stocks, bonds, bills, gold, and the dollar
Source: Jeremy Siegel, Stocks for the Long Run, 5th edition1
As we showed in the article referenced above, U.S. equities generated a 6.9% annualized inflation-adjusted return between 1870 and 2020. Indeed, across various time periods of 100-years plus length, U.S. equities have generated inflation-adjusted returns of 6%-7%. However, as we pointed out in that same article, using U.S. stocks as a proxy for global stock returns has an upward bias, as the U.S. stock markets have been one of the most successful markets of the past two centuries.
Global stock returns: Evidence from 17 advanced economies
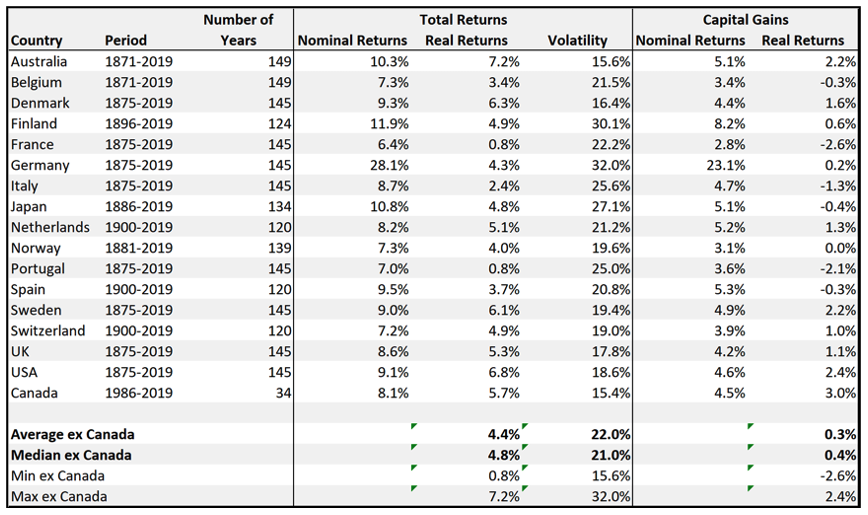
Table 1 shows the performance of 17 advanced economies from 1871-20192. Country-level returns are not centred on the U.S. outcome. Indeed, the average as well as median return of these 17 advanced economies were well below that of the U.S. stocks with inflation-adjusted annualized returns of 4.5% and 4.9% respectively.
Table 1: Inflation-adjusted total returns for stocks by country over the past 150 years3
Figure 2 shows the above data in a graphical form. As is seen, only two of the 17 countries for which we have data experienced inflation-adjusted returns of 6.6% or more; the U.S. and Australia. All other countries are below that line – in many cases, well below that line.
Figure 2: Risk and inflation-adjusted total returns of stocks for the long run
Global stock returns: Not a homogeneous system
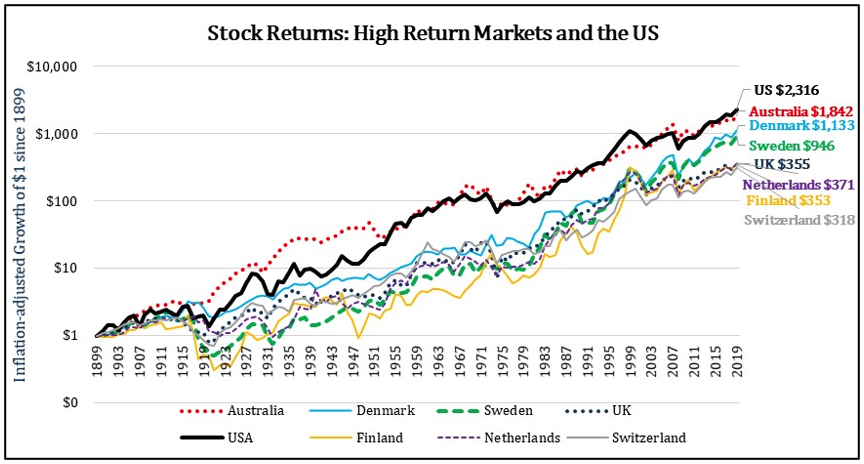
Figure 3 and Figure 4 show the growth of $1 invested in the various global equity markets4. Figure 3 includes countries that generated above-median returns as compared to the overall set. The U.S. stocks have been significantly superior to even the above-average group of advanced economy stocks.
Figure 3: Global stock inflation-adjusted total returns – High return markets and the U.S. stocks
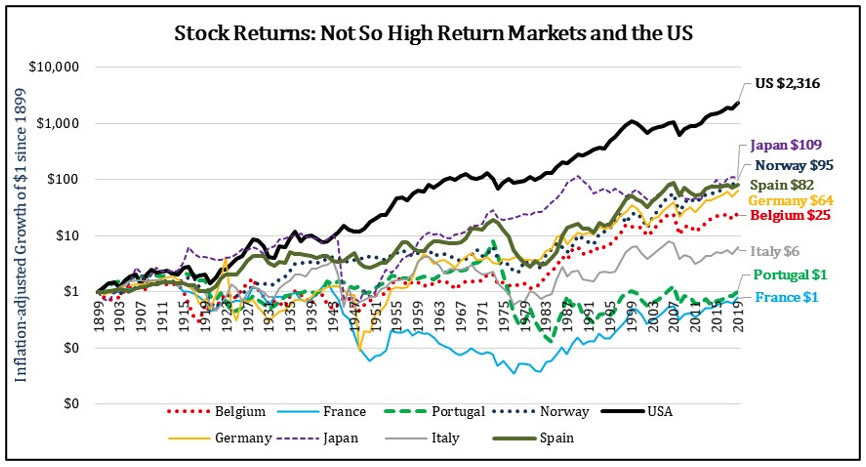
Figure 4 shows the performance of markets that were at or below the group’s median. Clearly, U.S. stocks are not a good proxy for country level returns.
Figure 4: Global stock inflation-adjusted total returns – Not so high return markets and the U.S. stocks
A global “advanced country” equity index
What equity returns has global stock portfolio generated over extended time periods? To answer that question, we build two global advanced country indexes using the country return level data presented thus far – an equal-weighted and a GDP-weighted index. Both the indexes are rebalanced at the start of each decade. The GDP weighted index is similar to market capitalization weighting. While not a perfect proxy for market-capitalization weighted index, it is a reasonable proxy.
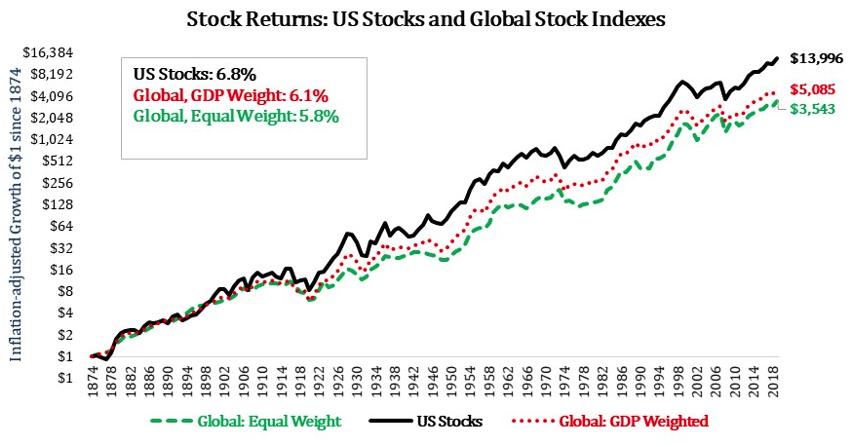
Figure 5 shows the inflation-adjusted performance of these global indexes. For easy comparison, we have also included performance of U.S. stocks. As is seen, inflation-adjusted total returns of owning global stocks, weighted by GDP or equally weighted, were lower by about 1% when compared to U.S. stocks. Importantly, the global portfolio was significantly superior to most of the individual country portfolios. Indeed, it was bested by only four countries, namely Australia, Denmark, Sweden, and the U.S.
Figure 5: U.S. and global stocks inflation-adjusted total returns
Investors were well served by letting go of their home country bias and constructing equity portfolios that are globally diversified. International stocks need to be a much larger portion of the portfolio than is likely represented in your portfolio and is recommended by your advisors.
Dividends and taxes
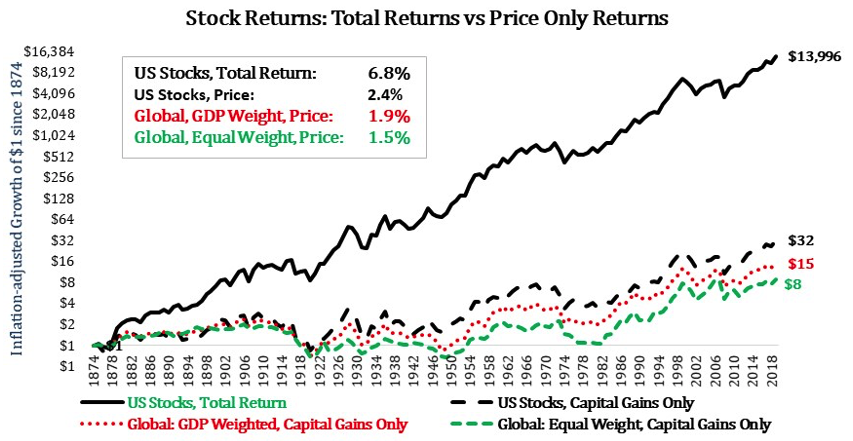
Figure 6 shows the price-only returns as against total returns for U.S. stocks. Excluding dividends has a very significant impact on investment outcomes. Investment returns excluding dividends drop by nearly 4% annualized. Investors need to reinvest their dividends back into their equity portfolio in order to fully benefit from equity returns.
Figure 6: Global and U.S. stocks – Total return vs price-only returns
Clearly, dividends have a significant impact on overall investment returns from global stocks. As Figure 5 reported, since the 1870s, global stocks generated nearly 6% inflation-adjusted “total” returns. The difference between total returns and price-only returns is accounted for by dividends. The impact of dividends on total investment returns was 4.2% annualized.
Dividends are subject to withholding taxes in most countries. Dividend withholding tax rates range from 15% to 30% for most major countries5. If we assume average dividend withholding tax rates of 20-25%, it will cut the overall returns from stock by about 1%.
Backing out the taxman’s share, the total inflation-adjusted return from stocks drops from about 6% to about 5%.
Impact of survivorship bias and emerging markets
Our analysis has been based on the 17 advanced economies listed in Table 1. We have not included emerging markets. As we have discussed previously (here), China and Russia resulted in a complete loss for equity investors, whereas Austria, a market that accounted for nearly 5% of the global GDP at the start of the last century, resulted in catastrophic losses for equity investors.
While we do not have data to appropriately model the impact of such inclusions, it is fair to assume that such inclusions will have a negative impact on overall equity returns. In our assessment, the impact of having a complete global equity return dataset will likely be of a magnitude of 0.25-0.5%.
Accordingly, over the very long run, equity investors should expect to realize total inflation-adjusted returns of 4.5 – 5% annualized. Be mindful of using that return estimate to any short period though.
Summary: Global stock returns - A realistic assessment
When making investment allocations, it is important to have realistic expectations regarding investment returns. As against the widely touted long-run expected returns from equities of 6.5%, we show that the true long-run equity returns from global stocks is likely in the range of 4.5 to 5%.
Clearly, U.S. stocks were one of the best performing markets of the past 150 years and investors who maximized their U.S. allocations would have benefitted from such decisions. However, as investors, we cannot eat past returns. If you have perfect foresight as to which county will have the best performing market for the next 100 years, it will likely make sense to direct much of your equity investment to that country.
For those of us who do not have that foresight, the most rational course of action is to invest in globally diversified equity portfolios.
Baijnath Ramraika, CFA, is a cofounder and the CEO & CIO of Multi-Act Equiglobe (MAEG) Limited and is the Executive Director at Sapphire Capital. As a portfolio manager, he manages the Global Moats Fund, the Global Select Value Fund, and the India Moats Fund. Contact him at [email protected]. Baijnath’s thoughts and ideas can be read at his blog at www.symantaka.com
Prashant K. Trivedi, CFA, is a cofounder of MAEG and the founder and chairman of Multi-Act Trade and Investments Pvt. Ltd.
MAEG is an investment manager and manages the Global Moats Fund, an investment fund that invests in a global portfolio of high-quality businesses with sustainable competitive advantages, and the Global Select Value Fund, a multi-strategy fund that invests in a basket of highest quality asset owners, deep value situations, and futures and fixed income securities.
Sapphire is an investment manager and manages the India Moats Fund, an investment fund that invests in a portfolio of Indian high-quality businesses with sustainable competitive advantages.
Multi-Act is a financial services provider operating an investment advisory business and an independent equity research services business based in Mumbai, India.
1 Reproduced from https://www.gurufocus.com/news/791807/jeremy-siegel-stocks-for-the-long-run
2 Data for this article was sourced from IMF, OECD, Factset, and Jorda-Schularick-Taylor Macrohistory database. Rates of return from 1870 to 2015 period in most cases have been sourced from Òscar Jordà, Katharina Knoll, Dmitry Kuvshinov, Moritz Schularick, and Alan M. Taylor. 2019. “The Rate of Return on Everything, 1870–2015.” Quarterly Journal of Economics. Forthcoming.
3 Data on Canadian stock returns is available only for a limited period (since 1986) and is sourced from Factset.
4 As our dataset has data only from 1900 onwards for Netherlands, Spain, and Switzerland, we have used 1900 onwards data for all countries for charts in this section to ensure consistency and comparability.
5 For a complete list of dividend withholding taxes by country, please refer https://www.spglobal.com/spdji/en/documents/additional-material/withholding-tax-index-values.pdf
More Global Markets Topics >
 Advisor Perspectives welcomes guest contributions. The views presented here do not necessarily represent those of Advisor Perspectives.