Nearly a decade after the onset of the global financial crisis, real economic growth remains constrained by high levels of household debt, particularly for those at the lower end of the income and wealth distributions. The build-up of indebtedness in these households prior to the onset of the crisis continues to cast a shadow over the real economy.
Quantitative easing (QE) policies by the Federal Reserve and other global central banks have revived asset price appreciation without addressing the burden of the bottom 80%. As long as “middle class” households continue to carry excessive debt burdens, real economic growth will not move much above 2%. Let’s take a look at these issues in this article; Part II will examine asset-allocation implications.
From the Golden Age to money market capitalism
From 1945 to 1970, the U.S. economy experienced strong real GDP growth, low unemployment, low inflation, high productivity growth and declining income inequality in what it often referred to as the economic Golden Age of capitalism. However, inflation began to rise in the mid-1960s (guns and butter), leading to the collapse of the Bretton Wood Monetary Accords and, eventually U.S. dollar weakness. Steps taken by the Volcker-led Fed at the end of the 1970s and the election of conservative governments in the U.K. and U.S. at the end of the 1970s prompted a shift toward free markets and neoliberal ideology, as various sectors, including finance, were deregulated and liberalized.
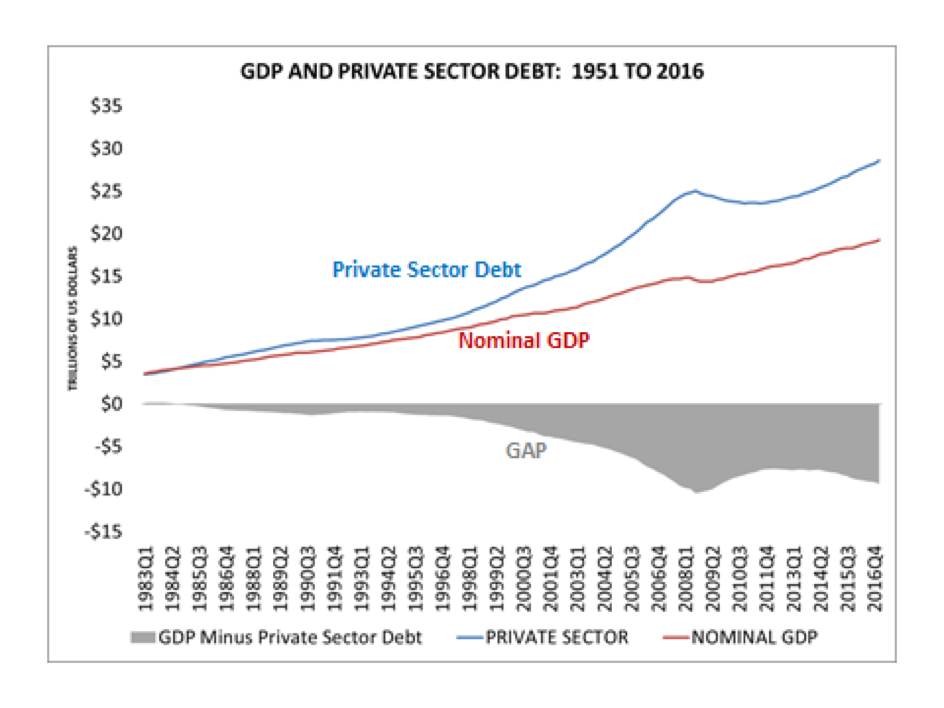
Financial market liberalization beginning in the 1980s increased (“democratized”) access to credit, prompting rapid growth in private sector debt relative to GDP. Having remained closely linked with GDP for the previous quarter century (see chart below), private sector debt ratios decoupled and began to rise during the 1980s. From 1983 to 2007, private sector debt rose from 96% to 172% of GDP; even today debt remains at 150% of GDP.

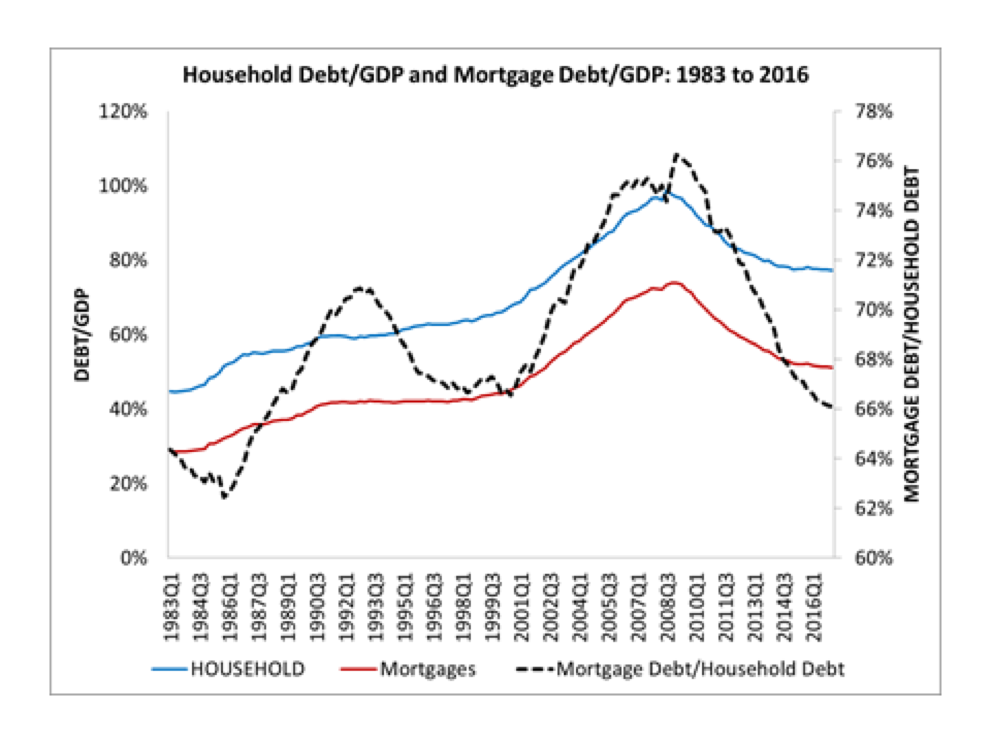
As debt rose relative to income, the manner in which that debt was used increasingly focused on finance, fueling asset price appreciation in lieu of the previous emphasis on productive activity and capital formation. Much of the debt that was created during this period was fueled by financial innovation, including securitization and later, subprime lending, and was allocated to real estate. From 1983 to 2008, mortgage lending more than doubled from 29% to 74% of GDP. And from 2000 to 2007, mortgage lending accounted for more than 82% of total household debt issued (for more details, see chart below).
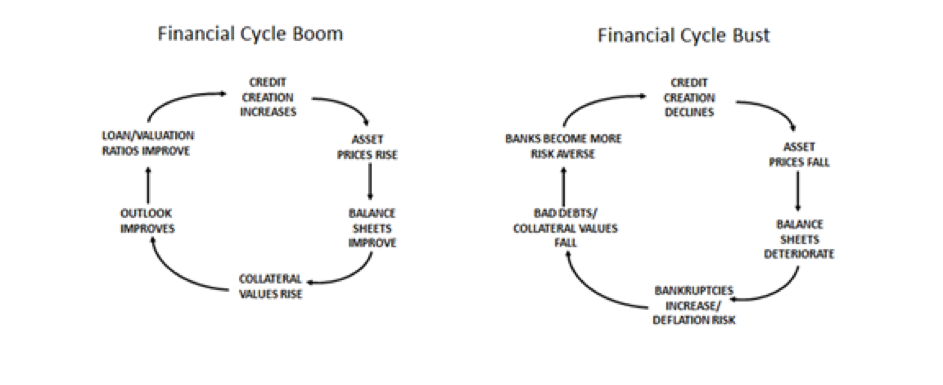
I have elaborated elsewhere (see here) on the implications of financial market liberalization for financial stability and growth. As access to credit eased and its use became increasingly speculative, credit growth became symbiotically linked to asset prices (see the stylized depiction in the figure below).
In a financial boom, increased credit creation fuels upward movement in asset prices as balance sheets strengthen, collateral values appreciate, and the outlook improves. This, in turn fuels creation of still more credit, etc. In the bust, the process reverses course. Interestingly, regulators and policy makers, operating under the illusion of free market ideology failed to understand this dynamic, so intervention only tended to occur once markets threatened to collapse. These feedback loops contributed to rising financial instability and boom-bust cycles in a number of asset classes.
The explosive growth of credit triggered a number of financial crises, including the stock market crash in 1987, thrift crisis (late 1980s), banking crisis (early 1990s), Russia/Long-Term Capital Management (1998) and the tech bubble (2000), to name a few. When market turbulence accelerated, the Fed would reduce short-term interest rates (the “Greenspan put”) and took other measures, as needed, placing a floor under asset class valuations that protected the interest of investors. This strategy worked well…..until it failed in 2008, when gravity reasserted itself.
Macroeconomic linkages: Household debt and income inequality
Edward Wolff, in Household Wealth Trends in the United States: 1962-2013: What Happened in the Great Recession, compared the income and wealth distribution for the top 20% of households with the bottom 80%. Barry Cynamon and Steven Fazzari, in Inequality, the Great Recession and Slow Recovery, distinguished the top 5% and bottom 95%, while acknowledging that the results are quite similar for the top 20% versus bottom 80%. I will focus on the bottom of the income and wealth distribution (80% or 95%), given its significant impact on real economic growth. .
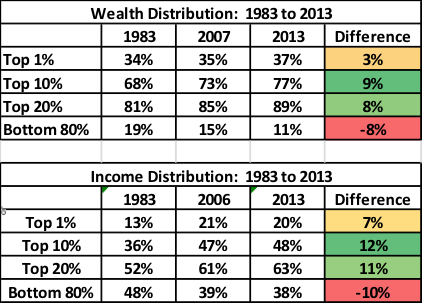
Income inequality began to rise during the 1980s due to the decline in labor income. As the table below illustrates, the share of wealth owned by the top 20% of households increased from 81% in 1983 to 89% in 2013. The share of income earned by the top 20% also increased from 52% in 1983 to 62% in 2013. In terms of net creation of wealth and income, the top 20% accounted for an extraordinary 99% of additional wealth and 103% of income created from 1983 to 2013. Middle class incomes on average plummeted throughout this period in relative terms.
Cynamon/Fazzari determine that household debt for the bottom 95% of households increased from 77% to a staggering 177% of GDP from 1989 to 2013. The rise in household debt is also closely linked to the decline in middle class incomes, as increased indebtedness became a substitute for lost income. Borrowing became the means to maintain consumption amidst declining incomes. According to Cynamon and Fazzari, the bottom 95% borrowed $6.6 trillion which helped offset the loss of $7.4 trillion in income. By borrowing in place of income for more than two decades, the middle class managed to maintain consumption, while delaying the inevitable slowdown in economic activity. Importantly, none of this would have been possible under a more restrictive financial regime.
From 1980 to 2006, the bottom 95% managed to maintain consumption, due to increased value of their homes and its Ponzi-like links to the feverish pace of borrowing (e.g., home equity withdrawals). In July 2005, Ben Bernanke, at the time a member of the Council on Economic Advisors, stated: “We’ve never had a decline in house prices on a nationwide basis.” From 2000 to Q2 2005, mortgage related debt had accounted for 82% of all new household debt and house prices had appreciated by 60%.
However, as Bernanke made that statement, the rate of house price appreciation began to slow. In nominal terms, house prices peaked in Q1 2006, and then proceeded to decline over the following years. In total house prices fell by $5.5 trillion, about the same amount as the stock market had declined during the tech bubble. Yet, the impact of the collapse in 2008 was far more devastating for the real economy.
Part of the reason was the deterioration in the balance sheets of the bottom 80%, especially given that about 60% of their wealth was in their homes. A second reason was that these exposures were highly leveraged and could be wiped out by a 20% decline in home prices. Mostly unable to access additional credit, many of these households chose to reduce consumption, which triggered a collapse in GDP growth (in the third and fourth quarters of 2008). By contrast, the tech bubble had little impact on aggregate demand and GDP, given that it was largely an affair for the top 20% (and thus, unlike the crisis in 2008, had virtually no impact on aggregate demand).
The global financial crisis began a decade ago and may appear somewhat irrelevant to market developments today. Edward Wolff notes that the bottom of the income distribution remains vulnerable, with debt today (as of 2013) equivalent to about 125% of income. In addition to real estate, debts today also incorporate student loans ($1.3 trillion) and auto loans ($1.1 trillion).
Since the crisis ended, real economic growth has remained in a range around 2%, well below historical levels, which are close to 3%. Real GDP growth will remain in this lower range for some time, with risks tilted toward the downside. If we think of the economy as an airplane in flight, it appears that only one engine has been operating since the crisis ended. In general, the middle class has a high propensity to consume out of income, but given massive debt burdens, are less able to perform their historic role as engines of aggregate demand. In my view, as long as middle class households remain highly leveraged, it is difficult to envisage how US growth can exceed 2%.
Conclusion
This slow rate of growth is linked to the stock of household debt and income inequality. Part of the political and economic dislocation within the U.S. can be traced back to the parlous state of middle class balance sheets and, arguably, a dearth of optimism about future prospects.
The QE policies engineered by the Federal Reserve heightened income inequality, given that the top 20% own close to 90% of all wealth. These policies have not addressed the excessive debts still being carried by the middle class. If the U.S. economy enters recession, or interest rates spike triggering a collapse in house prices, the impact on the bottom 80% once again could be severe. Asset-class prices (houses, equities, bonds and virtually every other asset class) are expensive across-the-board, relative to historical levels (with the possible exception of non-U.S. equities). And the Fed has signaled its intention to reverse QE and raise short-term rates. I will have more to say about the asset allocation implications in Part II.
John Balder is a co-founder and CIO at Investment Cycle Engine, Inc. His experience combines more than 25 years of work building innovative investment strategies at firms that included GMO and SSgA. He previously worked with the U.S. Treasury and the Federal Reserve Bank of New York after beginning his career with the House Banking Committee on Capitol Hill. His research focuses on the financial stability and the real world relationship between macroeconomics and finance. More information is available at www.icycleengine.com
Read more articles by John Balder