The Shiller cyclically adjusted price-earnings (CAPE) ratio is typically regarded as a stock market valuation measure. When the CAPE is high stocks are expensive and vice versa. But the CAPE itself is not a good stock market timer. However, it can be indirectly used for market timing by determining a cycle-ID as formulated by Theodore Wong.
Wong used double-leveraged long, inverse-unleveraged short and unleveraged-long synthetic ETFs based on the monthly average of the S&P 500 from 1900 to 2016, and showed very impressive hypothetical returns. My 1950-2016 back-test of the CAPE-cycle-ID model, using just the S&P 500 with dividends and money market funds, showed an annualized return of 11.9% versus 10.4% for buy-and-hold.
The Shiller CAPE can be determined at the end of every month. Inputs are the average value of the S&P 500 index for the month, earnings of the S&P 500, and the consumer price index (CPI). Using the CAPE, I developed a market timer according to a few simple rules.
The CAPE-Cycle-ID market timer
The construction and rules for my CAPE-cycle-ID model are summarized below. The rules differ from the Wong model only in respect to the investment choices and trading times.
Construction:
- A primary oscillator is constructed from the year-over-year rate-of-change of the CAPE (YoY-ROC-CAPE).
- The exponential moving average (EMA) of the YoY-ROC-CAPE is then calculated with a smoothing factor of 0.20 (EMA-YoY-ROC-CAPE).
- A secondary indicator is calculated from the month-over-month change of the EMA-YoY-ROC-CAPE (MoM-EMA-YoY-ROC-CAPE).
Rules:
- Score +1 when the EMA-YoY-ROC-CAPE is greater or equal to -13%, otherwise score -1.
- Score +1 when the MoM-EMA-YoY-ROC-CAPE is greater than zero or when it has a positive slope (i.e. when the current month level is greater than the previous month level), otherwise score -1.
- Sum the scores for each month. Possible combined scores are +2, 0, and -2.
- Invest in the stock market when the combined score is +2 or 0.
- Go to cash or bonds when the combined score is -2.
Trading Rules:
After a combined score change, trade on the first trading day of the following week.
Performance
I calculated a hypothetical fund SPY* based on the performance of the S&P 500 with dividends reinvested by splicing the data from the SPDR S&P 500 ETF (SPY) from 1993 to 2016, the Vanguard 500 Index Fund (VFINX) from 1980 to 1993, and before that from 1950 to 1980 daily data of the S&P 500 with monthly dividends taken from the Shiller CAPE data.
I simulated a hypothetical money market fund SHV* with the Federal Funds Rate from 1950 to 2007 and thereafter spliced the iShares Short Treasury Bond ETF (SHV) to it.
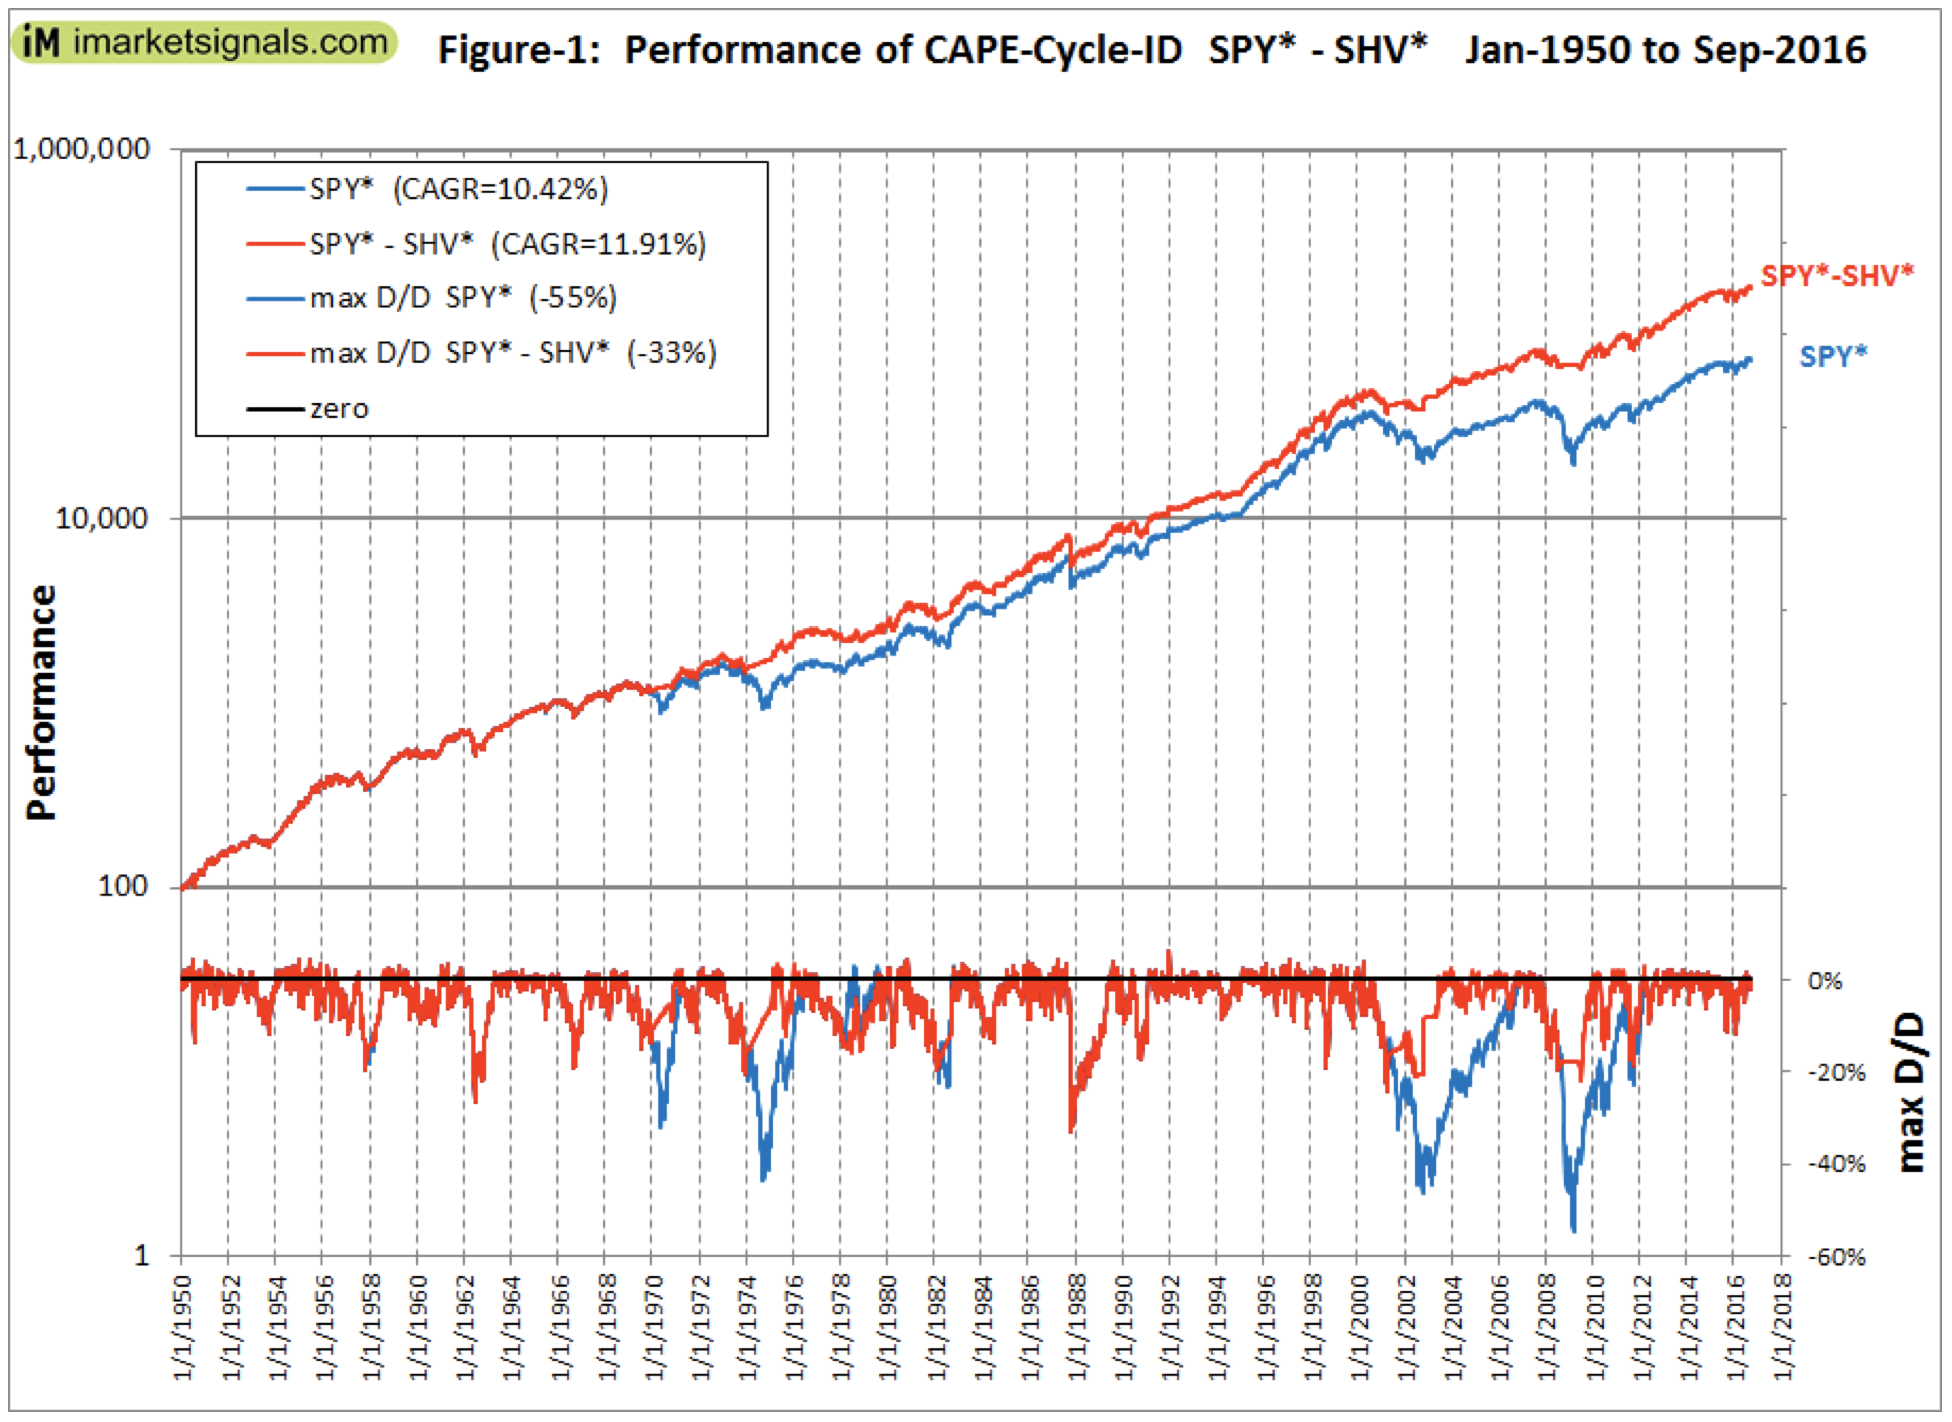
Over the period 1/3/1950 to 10/3/2016 the model, switching between SPY* and SHV*, showed an annualized return of 11.91% with a maximum drawdown of -33% in 1987. Buy-and-hold SPY* gave an annualized return of 10.42% with a maximum drawdown of -55% in 2009 (Figure 1).
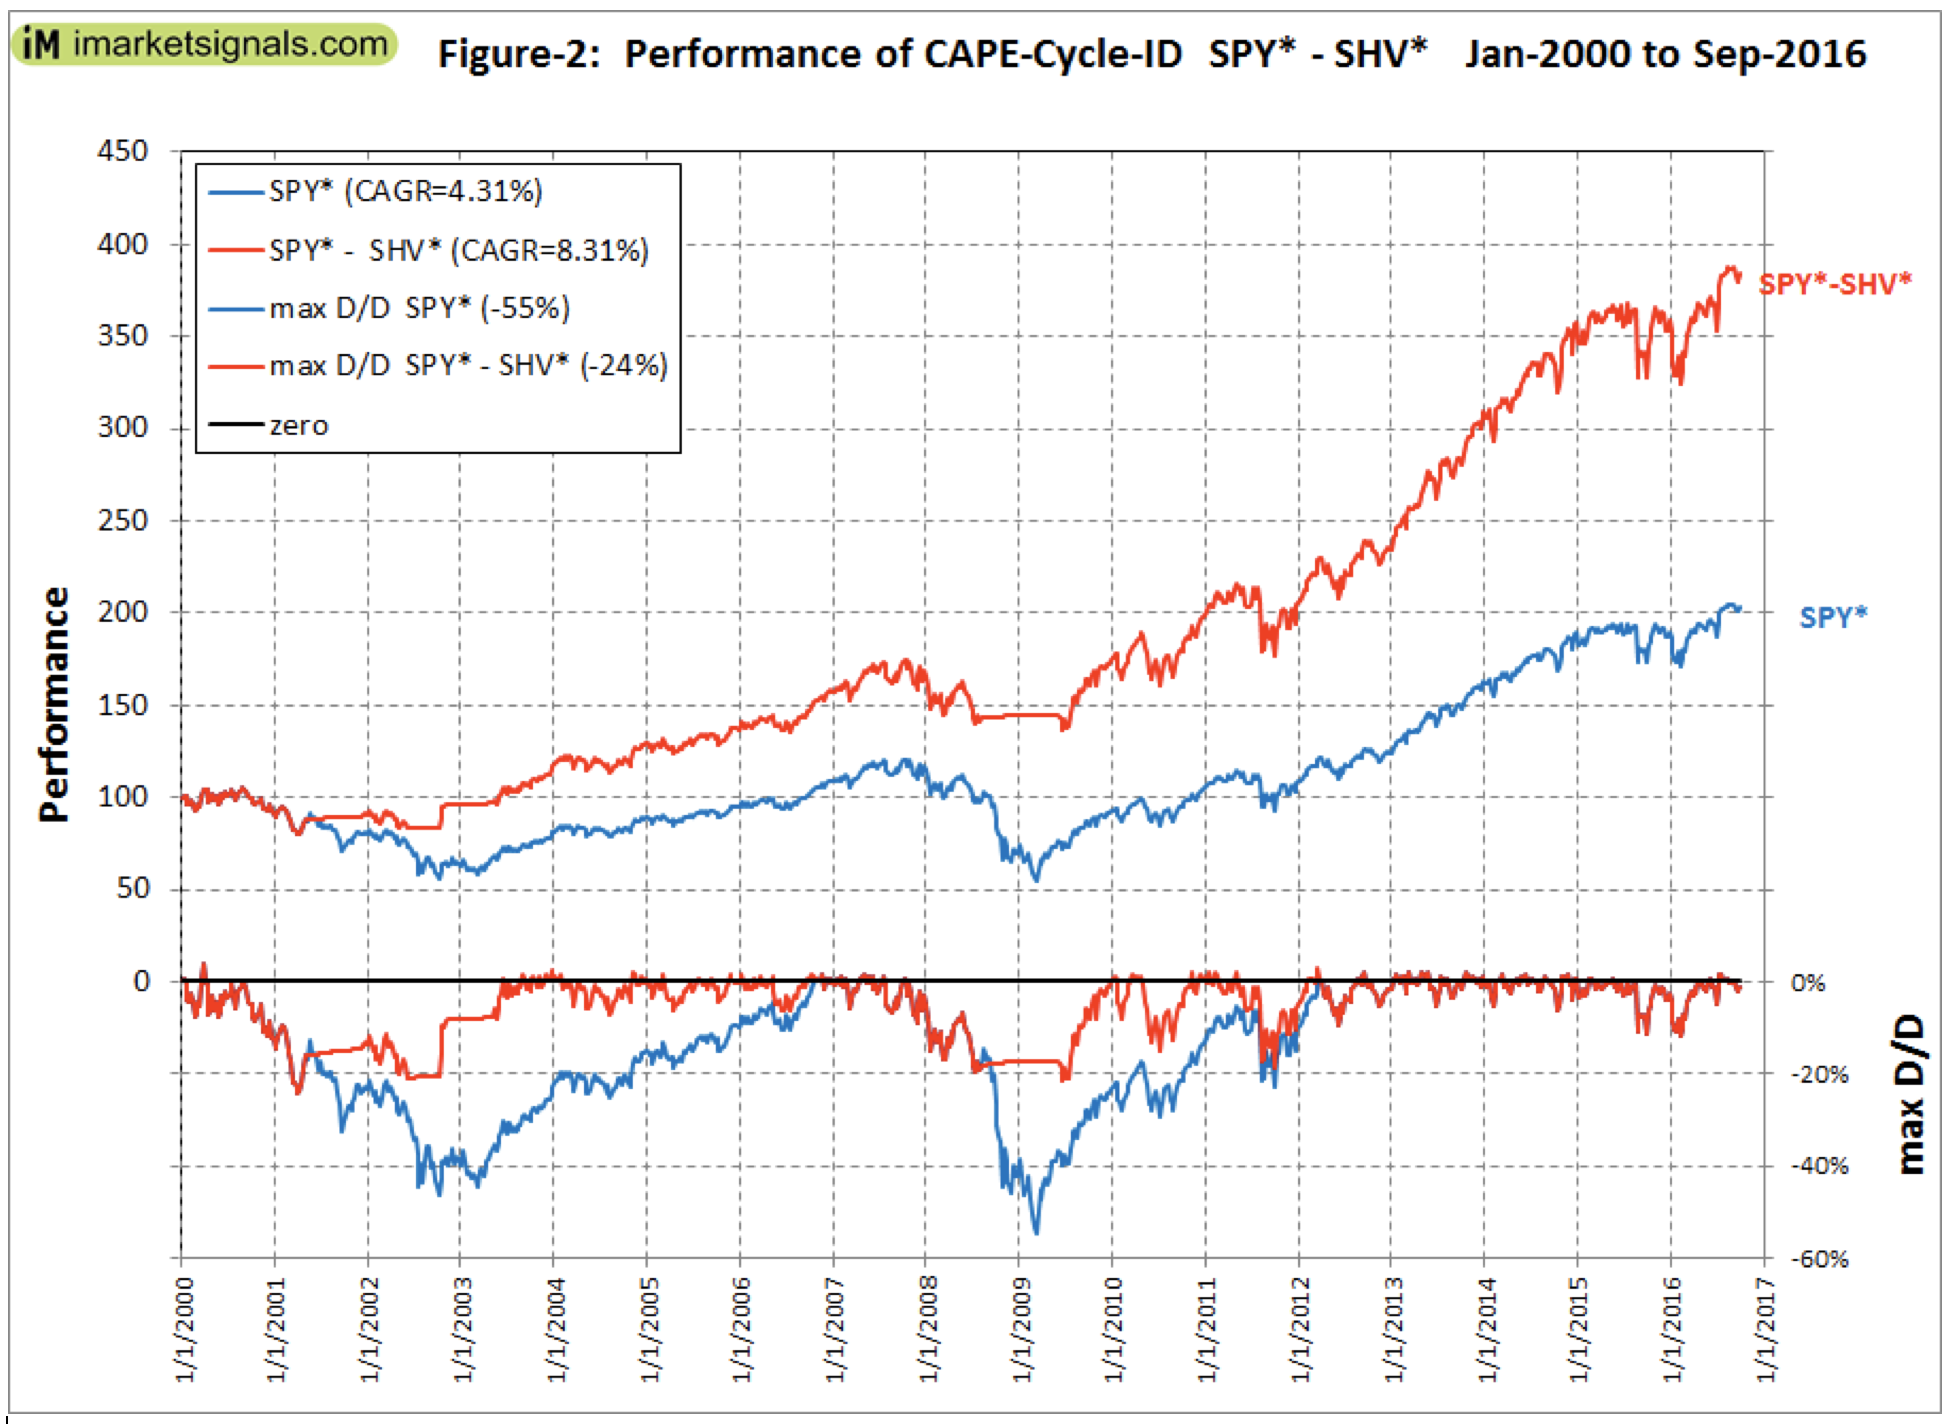
Over the period 1/3/2000 to 10/3/2016 the model showed an annualized return of 8.31% with a maximum drawdown of -24% in 2001. Buy-and-hold SPY* gave an annualized return of 4.31% with a maximum drawdown of -55% in 2009 (Figure-2).
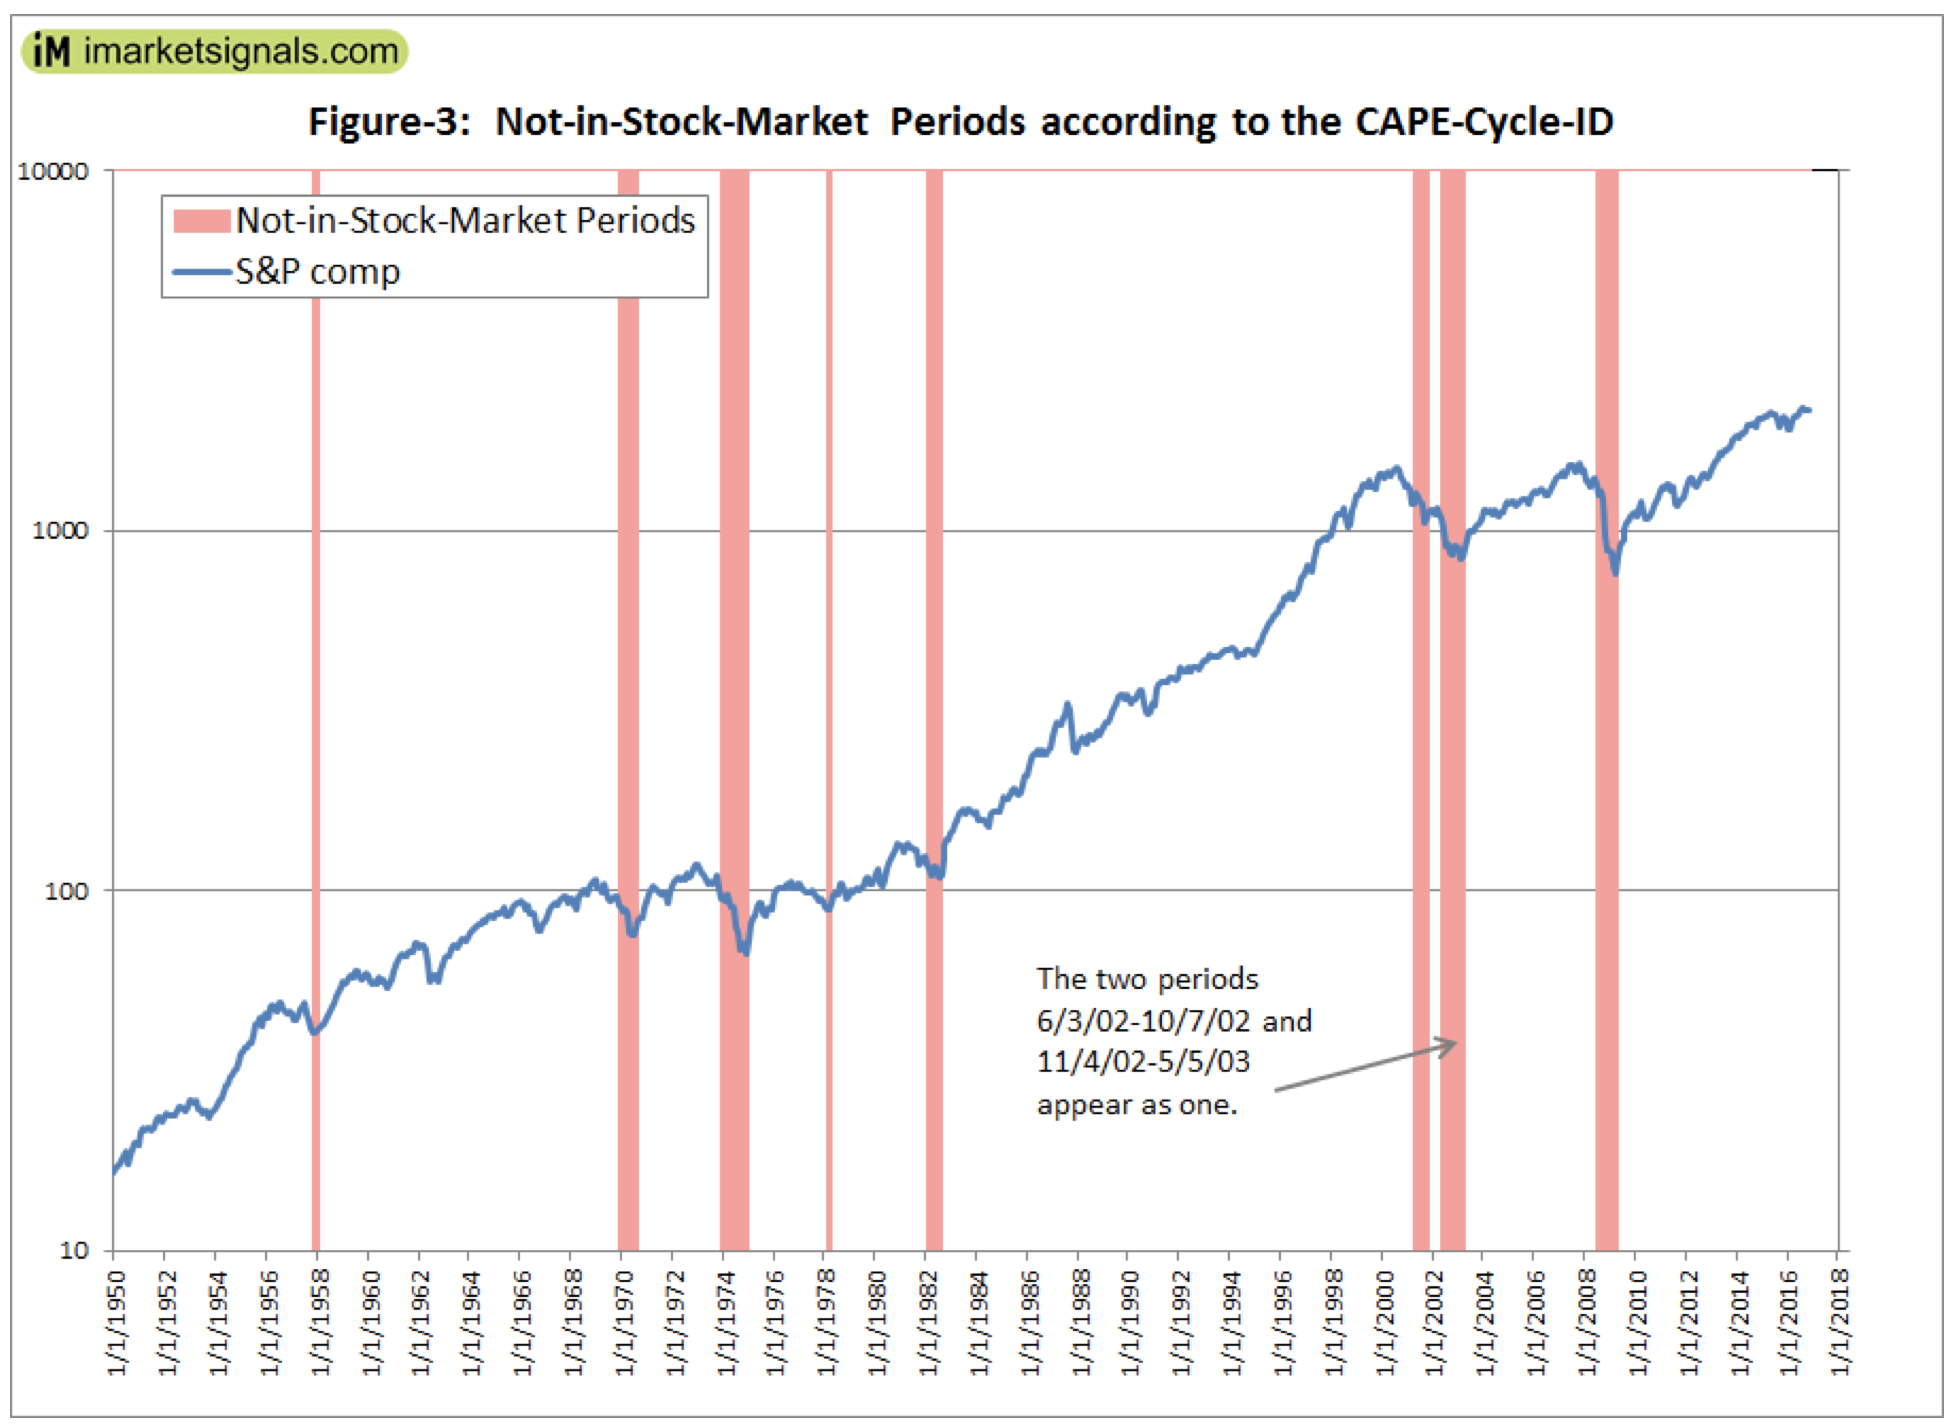
There were only nine periods from 1950 to 2016 when the CAPE-Cycle-ID signaled to be out of the stock market. They are listed below and are also shown by the vertical bars in Figure-3.
12/2/1957 to 3/3/1958
1/5/1970 to 10/5/1970
1/7/1974 to 2/3/1975
3/6/1978 to 5/1/1978
3/1/1982 to 10/4/1982
5/7/2001 to 12/3/2001
6/3/2002 to 10/7/2002
11/4/2002 to 5/5/2003
8/4/2008 to 6/1/2009

Conclusion
Higher returns could have been achieved by using a longer term bond fund instead of a money-market fund. However, I wanted to show the most conservative performance from this model, which over the period 1950 to 2016 provided 2.5 times the total return of what a constant investment in the stock market would have produced.
The model is simple to construct, but can also be followed live at ImarketSignals.com. Heeding the monthly signals from the CAPE-cycle-ID should provide insurance against major stock market declines and improve investment performance.
Georg Vrba is a professional engineer who has been a consulting engineer for many years. In his opinion, mathematical models provide better guidance to market direction than financial "experts." He has developed financial models for the stock market, the bond market, yield curve, gold, silver and recession prediction, which are updated weekly or monthly at http://imarketsignals.com/. Georg can be reached at [email protected].
Read more articles by Georg Vrba