Advisor Perspectives welcomes guest contributions. The views presented here do not necessarily represent those of Advisor Perspectives.
In my previous article, I examined many popular metrics that all show that U.S. equities have been overvalued for over 20 years. The conventional explanation is that the overvaluation and its unusually long duration is a statistical outlier. But those aberrations were observed in only 15% of the data population (20 out of 134 years) and are unlikely to be statistical outliers. The root cause is not yet known. Until the anomaly is better understood, naively equating the lack of mean reversion with overvaluations will lead to misguided valuations and ill-advised investment strategies.
A decade ago, I began searching for a valuation indicator that is immune to possible mean-reversion malfunction. The challenge proved to be much more difficult than anticipated. I ultimately had to abandon my search and developed my own valuations gauge, the total return oscillator (TR-Osc) and present it here.
Oscillatory gauge
Mean reversion is the underpinning of all valuations metrics. The basic concept of valuations relies on the notion that value oscillates between an upper bound (overvalued) and an lower bound (undervalued) around a median (fair-valued). How do you calibrate a gauge that has an unbounded output or with a drifing median that confuses mean reversion? A functioning valuations gauge should resemble a pseudo sine-wave oscillator with quasi-periodicity.
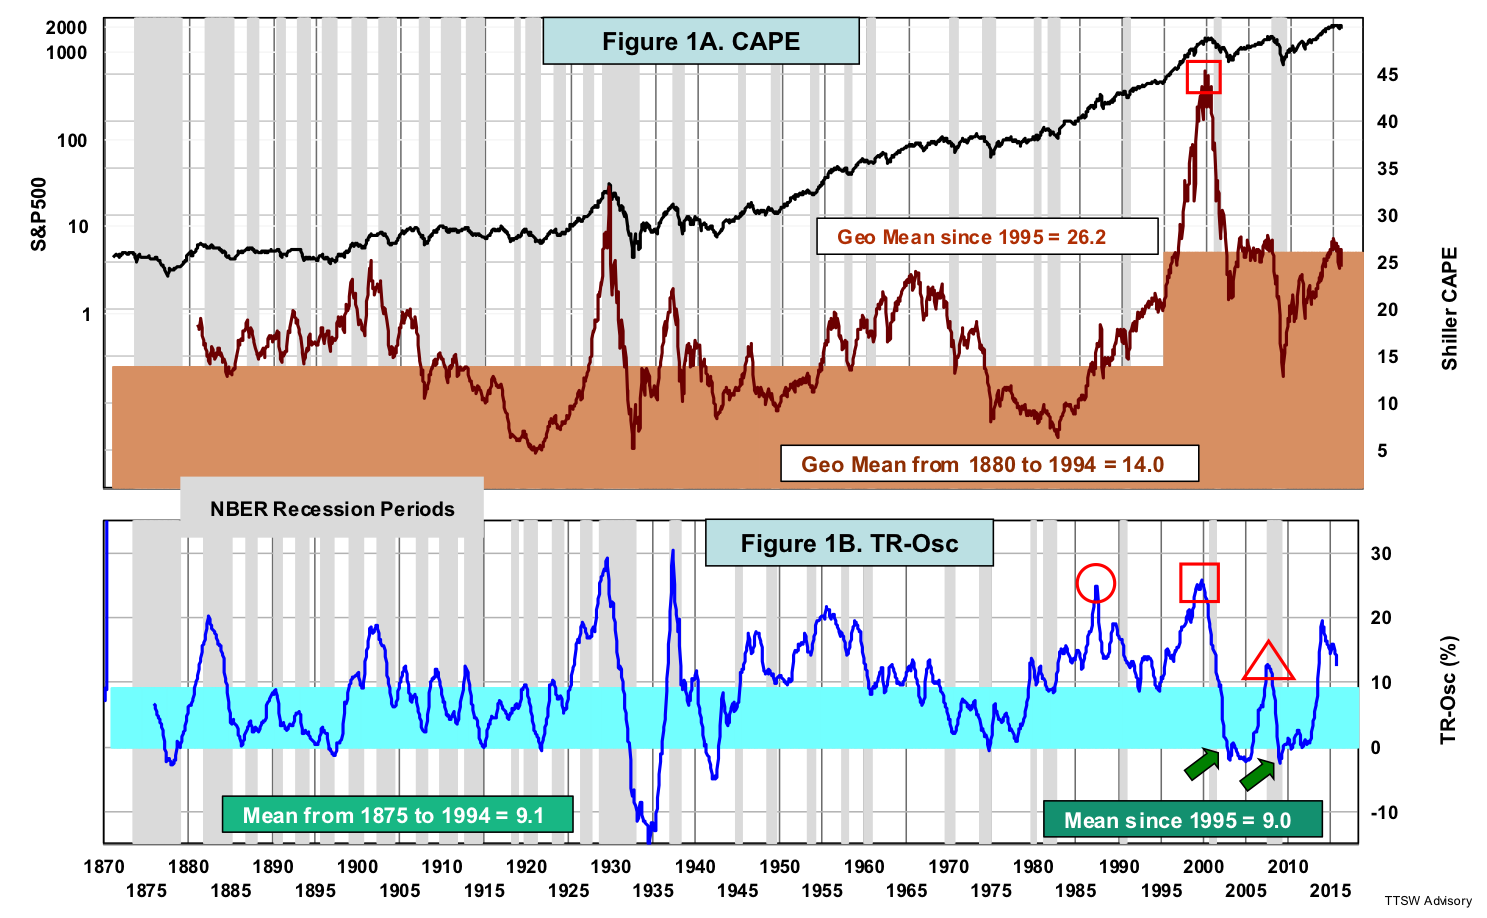
Although the cyclically adjusted price-to-earnings ratio (CAPE) oscillated around a stable geometric mean of 14 from 1880 to 1994, its mean has risen to 26.2 since 1995 (Figure 1A) – a telltale sign of mean reversion malfunction. By contrast, my TR-Osc has been bounded by well-defined upper and lower demarcations for over a century. The mean of TR-Osc measured from 1875 to 1994 is almost identical to the value computed over the last 20 years (Figure 1B). After reaching either extreme, TR-Osc always reverts toward its long-term historical mean.
From 1880 to 1950, TR-Osc and CAPE were almost in sync. After 1955, the two indicators began to diverge. Although both the CAPE and TR-Osc detected the dot-com bubble in 2000 (red squares), only the TR-Osc warned us about the 1987 Black Monday crash (red circle). After the 2000 peak, CAPE stayed elevated and came down only once in mid-2009 to touch its historical mean at 14. The TR-Osc, however, dropped to its lower bound in January 2003 (green arrow) getting ready for the six-year bull market from 2003 to 2008. The TR-Osc did it again after the housing bubble when it dipped below the lower bound of 0% in February 2009, just in time to reenter the market at the start of a seven-year bull market from 2009 to present.
In 2008, the TR-Osc reached a minor summit (red triangle) while CAPE exhibited no peak at all. Both TR-Osc and CAPE indicate that the meltdown in global financial markets did not stem from an overvalued equity market. I will expand on this later when I discuss the real estate sector.

Common deficiencies in all contrarian indicators
There are two common deficiencies shared by all contrarian indicators including all traditional valuations models. First, their signals are often premature because the market can stay overvalued or undervalued for years. Greenspan's 1996 irrational exuberance speech alluded to an overvalued market but it was four years too early. From 1996 to the dot-com peak in 2000, the S&P500 surged 87% and the NASDAQ 288%.
The second deficiency of all contrarian indicators is that the market can reverse direction without hitting either extreme at all. The CAPE, for example, was not undervalued in 2002 or 2009. Value investors would have missed out on huge gains of 90% and 180% from the two spectacular bull markets in the 2000s.
The dual gauges of the TR-Osc: scalar and vector
Before I explain how the TR-Osc overcomes these two deficiencies, let me first describe the TR-Osc. The TR-Osc captures what investors in the aggregate earn by investing in the S&P 500. That is the sum of two components – the first from price changes and the second from dividend yields. Price return is the trailing five-year compound annual growth rate (CAGR). Dividend yield is the annual return from the dividends investors received. The look-back period doesn't necessarily have to be five years. All rolling periods from 2 to 20 years can do the job. In addition, both real (inflation-adjusted) and nominal TR-Osc's work equally well because inflation usually does not change much over a five-year period.
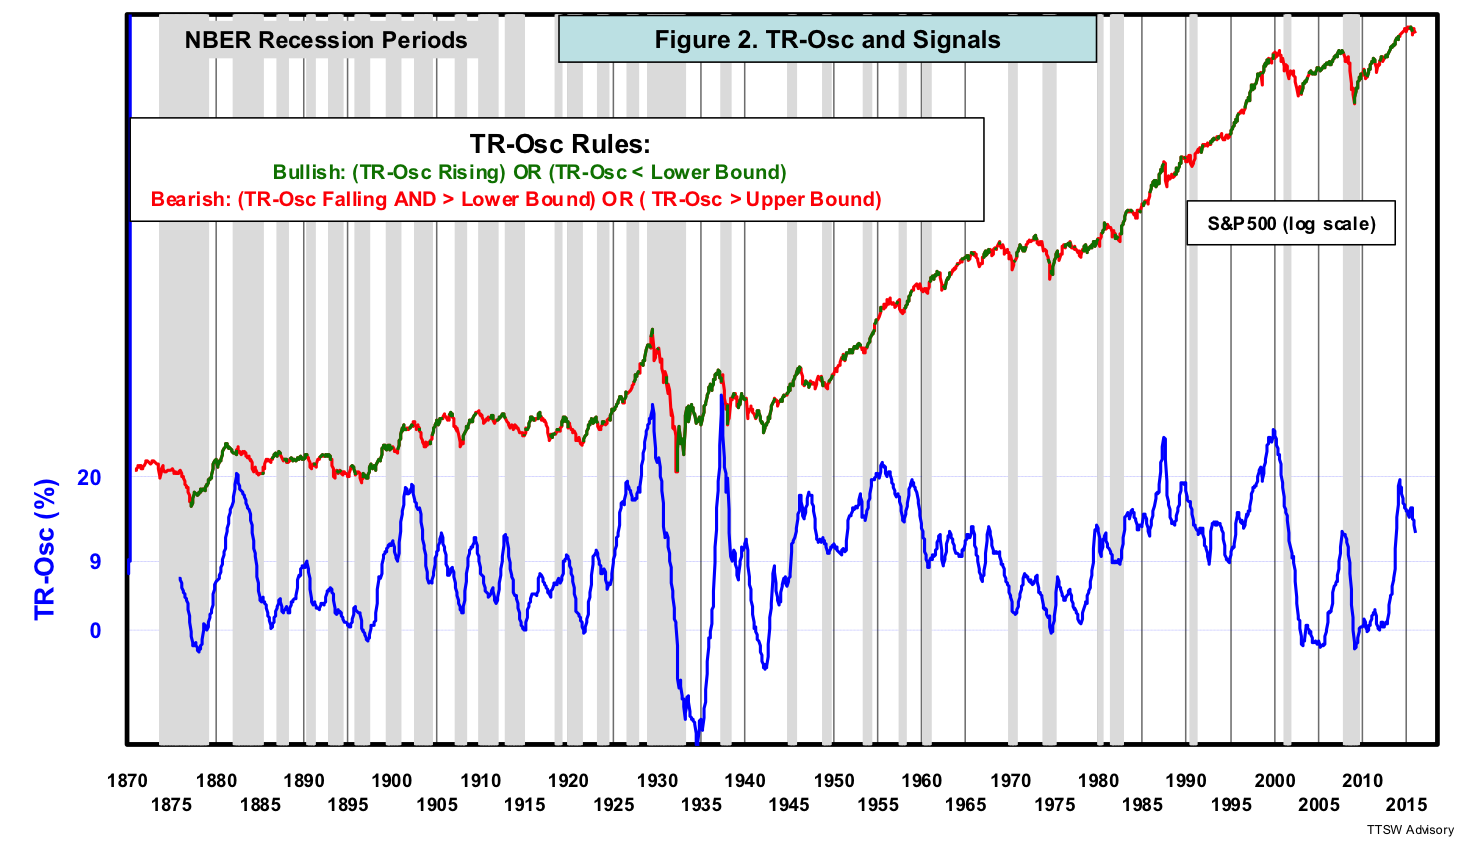
The TR-Osc overcomes the two deficiencies by having two orthogonal triggers, a scalar marker and a vector sensor. The oscillatory and mean-reverting attributes of the TR-Osc allow overvaluation and undervaluation markers to be clearly defined (Figure 2). When the TR-Osc was near the upper bound (the 20% overvalued marker), the S&P 500 often peaked. When the TR-Osc was near the lower bound (the 0% undervalued marker), the market soon bottomed. But in 2008, the TR-Osc only reached 12% and the market was not overvalued. Investors had no warning from the valuation marker to avert the impending subprime meltdown. Valuation markers (scalar) alone are not enough. The TR-Osc needs a second trigger, a motion sensor (vector) that tracks the up or down direction of valuations.
Let me illustrate how the scalar and vector triggers work in concert and how buy/sell signals are executed. When the TR-Osc is rising (an up-vector) or drops below the lower bound at 0% (an undervalued marker), a bullish market stance is issued. When the TR-Osc is falling (a down vector) but stays above 0% (not undervalued), or when it exceeds the upper bound at 20% (an overvalued marker), a bearish alarm is sounded. The asymmetry in the buy/sell rules stems from prospect theory, which contends that losses have more emotional impact to people than an equivalent amount of gains.
When a bullish signal is issued, buy the S&P 500 (e.g. SPY). When a bearish alarm is sounded, sell the S&P 500. After exiting the stock market, park the proceeds in 10-year Treasury bonds. The return while holding the S&P 500 is the total return with dividends reinvested. The return while holding U.S. Treasury bonds is the geometric sum of both bond yields and bond price percentage changes caused by interest rate changes.
The performance data presented in this article assume that all buy and sell signals issued at the end of the month were executed at the close in the following month. When the TR-Osc signals were executed closer to the issuance dates, both return and risk performances were slightly better.
TR-Osc performance stats
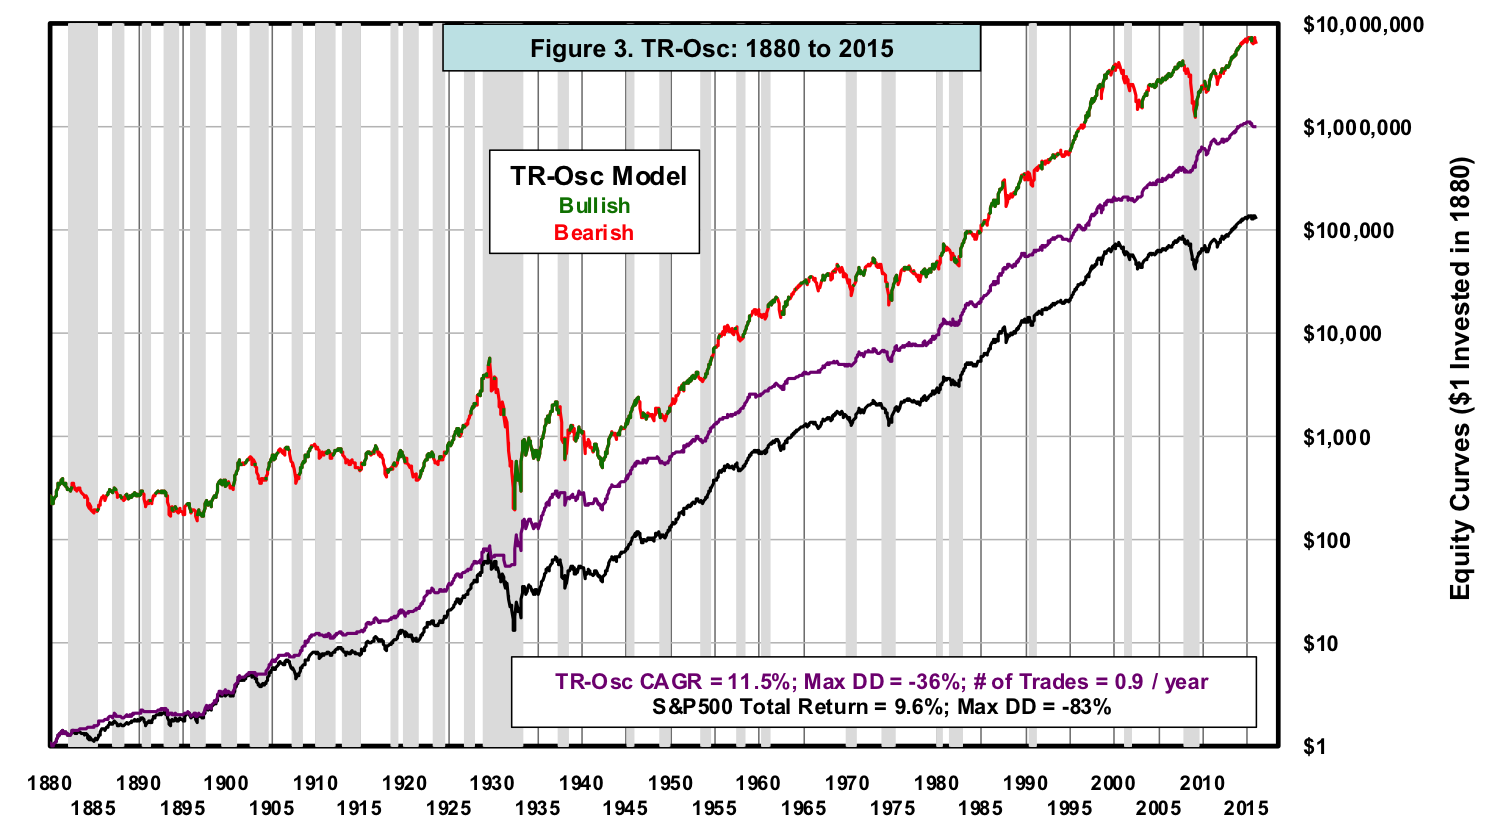
Figure 3 shows two hypothetical cumulative returns from 1880 to 2015 – the TR-Osc with the buy/sell rules stated above and the S&P 500 total return. Over 135 years, the TR-Osc has a 190 basis point CAGR edge over the buy-and-hold benchmark with less than half of the drawdown risk.
The TR-Osc traded infrequently – less than one round trip a year on average. The TR-Osc is an insurance policy that protects investors against catastrophic market losses while preserving their long-term capital gain tax benefits.
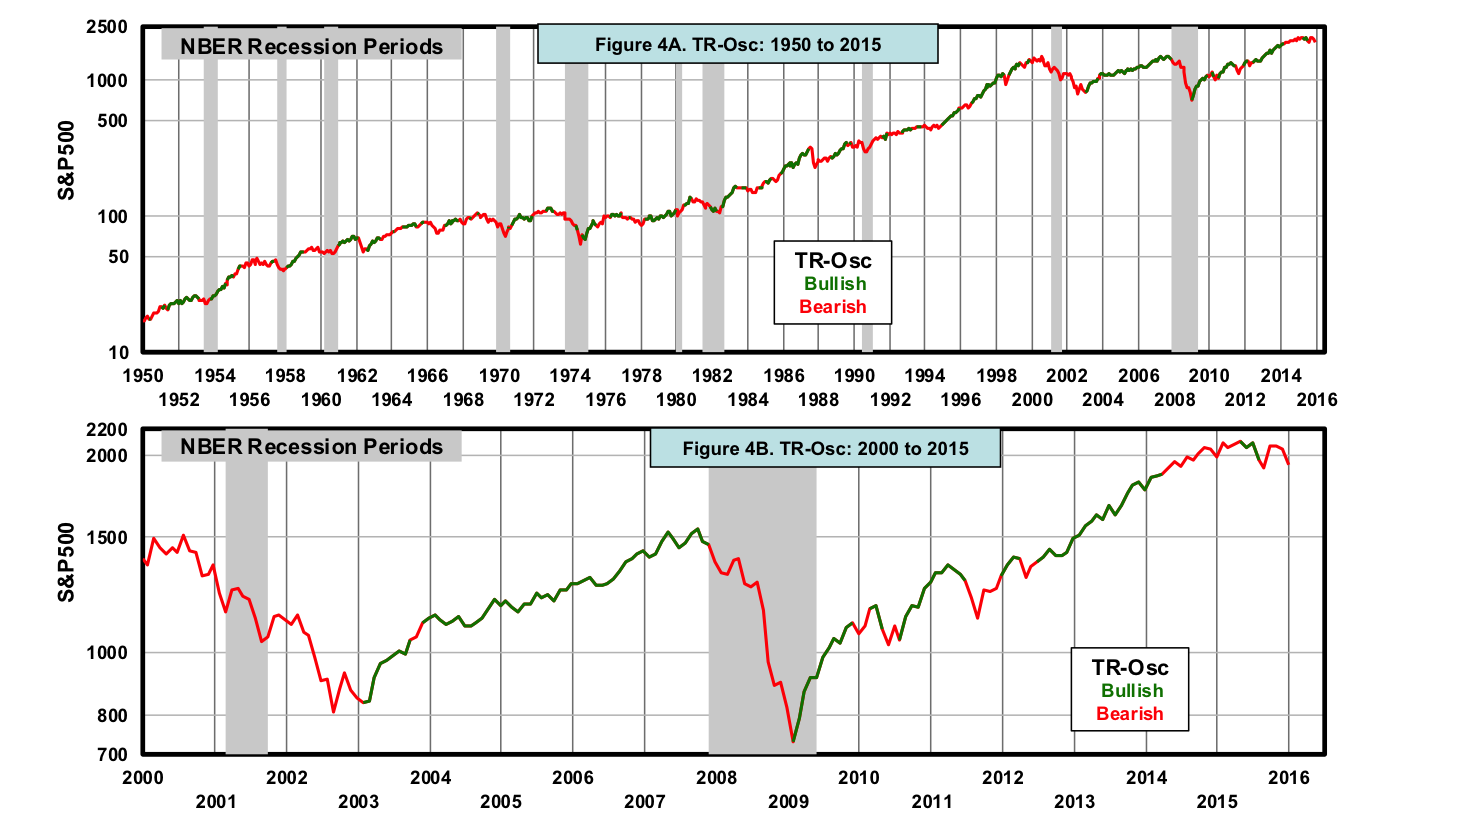
Let's take a closer look at the TR-Osc signals in two more recent time windows. Since 1950, there have been 10 recessions. Figure 4A shows that the TR-Osc kept investors out of the market in all 10 of them. Figure 4B shows that the latest TR-Osc bearish call was issued in September 2015. The TR-Osc sidestepped the recent stock market turmoil and has kept investors' money safe in Treasury bonds.
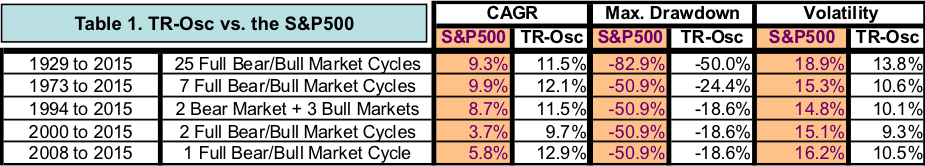
Table 1 shows performance stats for various sets of bull and bear market cycles. TR-Osc beats the S&P500 total return in CAGR, maximum drawdown, and volatility. The consistency in outperforming the S&P500 in returns and in risk over different sets of full bull/bear cycles demonstrates the robustness of TR-Osc.
TR-Osc has universal applicability
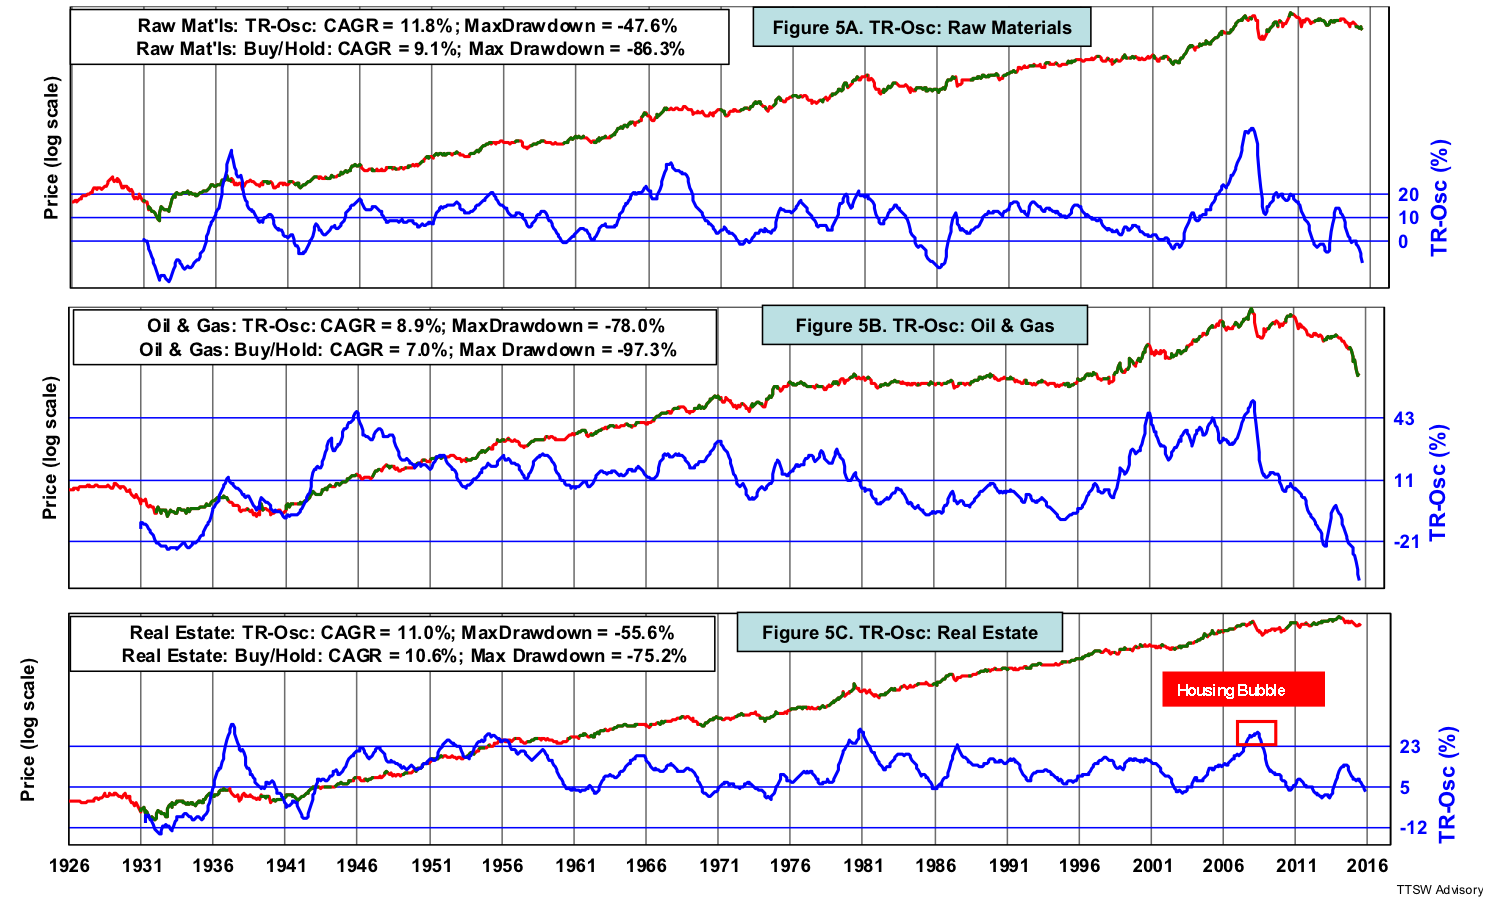
Like the CAPE, the TR-Osc’s efficacy is not limited to the S&P 500. It can also measure valuations in overseas markets (developed and emerging), hard assets and currencies. For example, Figure 5 shows three alternative spaces – raw materials (Figure 5A), oil and gas (Figure 5B) and real estate (Figure 5C) (data source: Professor Kenneth French). This universal applicability of the TR-Osc also enables intermarket synergies. Recall in Figure 2 that the stock market was not overvalued in 2008 according to both the CAPE and the S&P 500 TR-Osc. Note that the real estate TR-Osc correctly detected the housing bubble (red square in Figure 5C). When the systemic risk spread to the stock market, the S&P 500 TR-Osc vector sensed the danger and turned bearish.
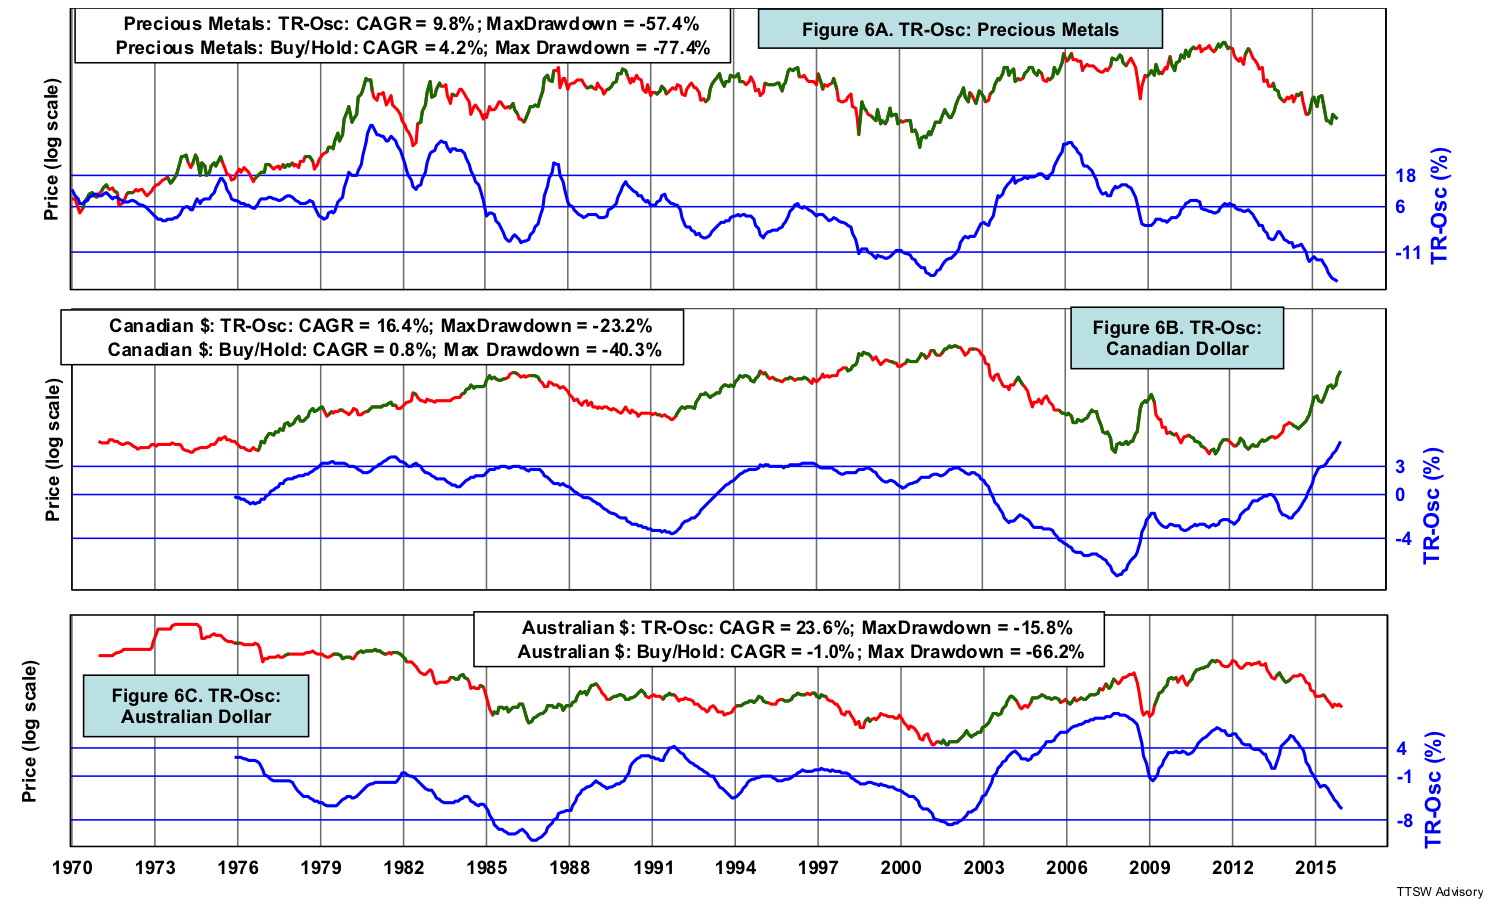
Figures 6A to 6C shows that the TR-Osc improves both the return and drawdown in two distinctively different spaces – precious metals (data source: Professor Kenneth French), the Canadian dollar and the Australian dollar (data source: FRED). Prices in precious metals fluctuate widely at rapid speeds while foreign currencies crawl in narrow ranges at a snaillike pace. It's remarkable that the TR-Osc works equally well across drastically different investment classes. How does the TR-Osc help a diverse group of characters with different personalities perform better?
The analytics of TR-Osc
You may say that TR-Osc is just a five-year rolling total return. But what breathes new life into an otherwise ordinary formula is the analytics behind the TR-Osc. The adaptability of buy and sell rules is the reason behind the TR-Osc's universal applicability. As indicated previously, the TR-Osc has two triggers: valuation markers (scalar) and valuation directional sensor (vector). How did I pick the values for these triggers? The vector is obvious – up is bullish and down is bearish – but how do I select the valuation markers?
In Figures 2, 5 and 6, the middle blue line is the mean. The upper blue lines are the overvaluation markers and the lower blue lines, undervaluation markers. The upper blue lines are M standard deviations above the mean and the lower blue lines, N standard deviations below the mean. Each time series has a unique personality. For example, the means of most currencies are near 0% while the mean of the S&P 500 is near 9%. More volatile investments like precious metals, oil and gas would have larger standard deviations than the serene currency space. The values of M and N are selected to match the personality of each underlying investment. The general range for both M and N is between 1 and 2.
A common flaw in the design of engineering or investments systems is over-fitting. I have developed five criteria to minimize this bad practice. The five criteria are simplicity, sound rationale, rule-based clarity, sufficient sample size, and economic cycle stability. The TR-Osc not only meets all of these criteria but offers one additional merit – universal applicability. It works not only on the S&P 500, but on overseas markets and across a diverse set of alternative investments.
Theoretical support for TR-Osc
Traditional valuation metrics rely on fundamentals, which often experience paradigm shifts across secular cycles. Fundamental factors can be influenced by generational changes – technological advances, demographic waves, socioeconomic evolutions, structural shifts, political reforms or wars. Therefore the means in many of the traditional valuation metrics can drift when the prevailing fundamentals change.
The TR-Osc downplays the importance of the external fundamental factors and focuses primarily on the internal instinct of the investors. Investors' value perception has two behavioral anchors. The first anchor drives investors toward the greed/fear emotional extremes. For example, when the S&P 500 delivers a five-year compound annual return in excess of the 20%, euphoria tends to reach a steady state and investors become increasingly risk adverse. When their returns get stuck at 0% five years in a row, investors are in total despair and the market soon capitulates. Both greed and fear extremes can be quantified by the TR-Osc's over- and undervaluation markers.
The second behavioral anchor is the tendency of herding with the crowd. When neither greed nor fear is at extreme levels, investors have a behavioral bias toward crowd-herding. Once a trend is established in either up or down direction, more investors will jump onboard the momentum train and price momentum will solidify into sustainable trends. The collective movement of the masses is tracked by the TR-Osc's vector sensor.
Concluding remarks
Unlike fundamental factors which can be altered by paradigm shifts over long arcs of time, human behaviors which are hardwired into our brains have not changed for thousands of years. The efficient market hypothesis assumes that markets are made up of a large number of rational investors efficiently digesting all relevant information to maximize their wealth. Behavioral finance theory suggests that investors are often driven by the inherent cognitive psychology of people whose decisions are often irrational and their actions exhibit behavioral biases. Perhaps the aberration (the malfunctioned mean reversion) observed in many of the traditional valuations ratios suggests that investors are not 100% homo economicus beings after all. More often than not, investors behave irrationally when they are besieged by emotions.
The TR-Osc captures the essence of both traditional finance and behavioral economics by reading investors' value perception from both the rational and the emotional wirings of their brains. It elucidates many valuable but abstract concepts from both schools into quantitative, objective and actionable investment strategies. As long as humans continue to use their dual-process brains (see also Dr. Daniel Kahneman) in decision making, TR-Osc will likely endure as a calibrated valuation gauge until humans evolve into the next stage.
The TR-Osc asserts that the current stock market is not overvalued. Instead, since mid-2015, its vector has been reverting towards its stable historical mean.
Theodore Wong graduated from MIT with a BSEE and MSEE degree. He served as general manager in several Fortune-500 companies that produced infrared sensors for satellite and military applications. After selling the hi-tech company that he started with a private equity firm, he launched TTSW Advisory, a consulting firm offering clients investment research services. For over three decades, Ted has developed a true passion in the financial markets. He applies engineering statistical tools to achieve absolute investment returns by actively managing risk in both up and down markets. He can be reached at [email protected].
Read more articles by Theodore Wong