Advisor Perspectives welcomes guest contributions. The views presented here do not necessarily represent those of Advisor Perspectives.
It is remarkable that market-top calls have enticed many advisors and analysts to fully embrace the cyclically adjusted price-to-earnings ratio (CAPE) as their crystal ball to foretell the future of the stock market. Such faith, as I will demonstrate, is misguided.
For nearly three decades, the CAPE that professors John Campbell and Robert Shiller created in 1988 and updated in 2015 has been adopted as the scale for measuring market valuations.
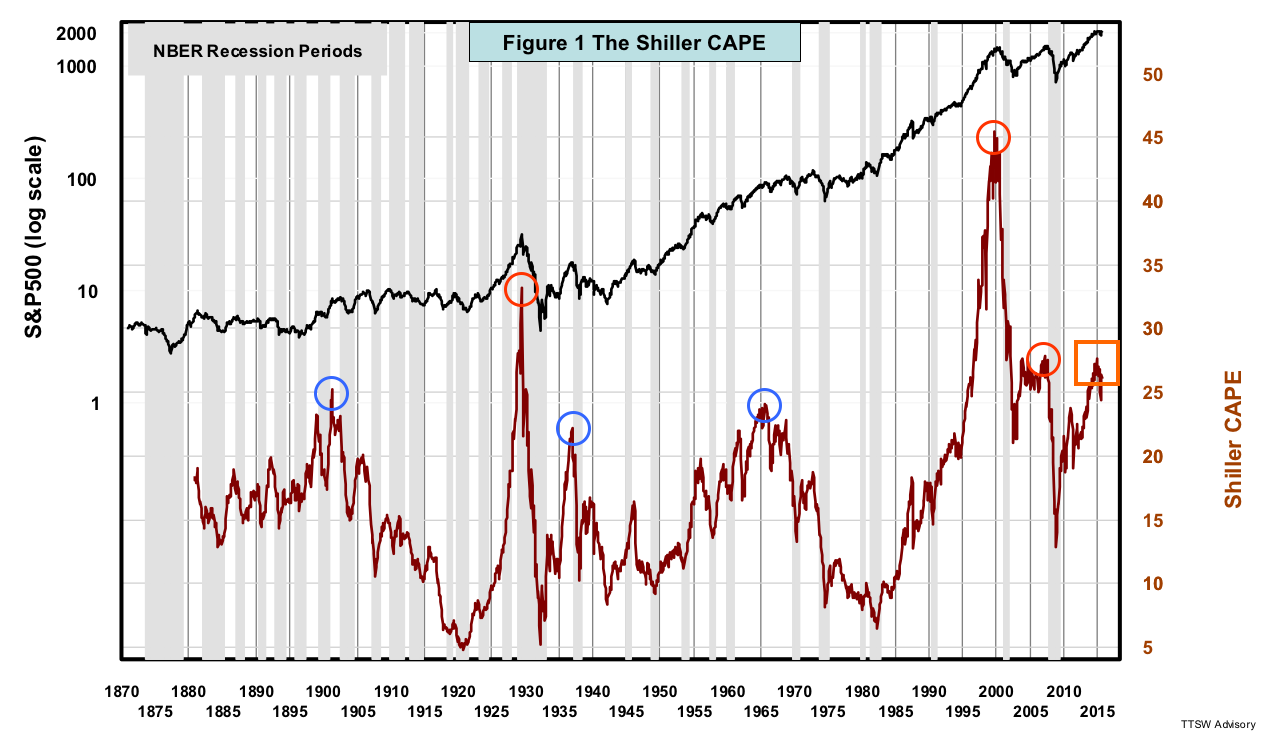
This is not surprising. As Figure 1 shows, CAPE has had great foresight for predicting major stock market calamities over the last century. It spiked above 27 only three times, in 1928, 1999 and 2007 (red circles), and all three spikes were followed by historic disasters. The CAPE also reached three minor summits in 1900, 1937 and 1966 (blue circles), which all led to prolonged bear markets. When CAPE hit 27 in 2015 (orange box), even perma-bulls lost confidence in prospective performance.

A hazy crystal ball at best
Despite the mirage of reliability on its surface, advisors need to exercise extreme caution as many CAPE-based research analyses have become unhinged from basic statistical principles. The apparent linkage between valuations levels and the posterior stock returns spurred much research on market forecasts. In performing a 10-year regression on CAPE, one starts with 144 years of Shiller's data. Ten years are used to smooth earnings and ten for forward-return calculations. This leaves 124 years of monthly data, which should be enough to do regression analyses, right?
But consider the fact that regressions are graded by R-squared. R-squared denotes how well the independent variables (e.g., CAPE) explain the dependent ones (e.g., 10-year forward returns). To show just how dubious many of these yardsticks are, Figure 2 is Vanguard's ranking of 15 valuations metrics by their predictive power R-squared. CAPE had the best R-squared, but half of the metrics ranked below simple rainfall as a predictor for stock market returns.
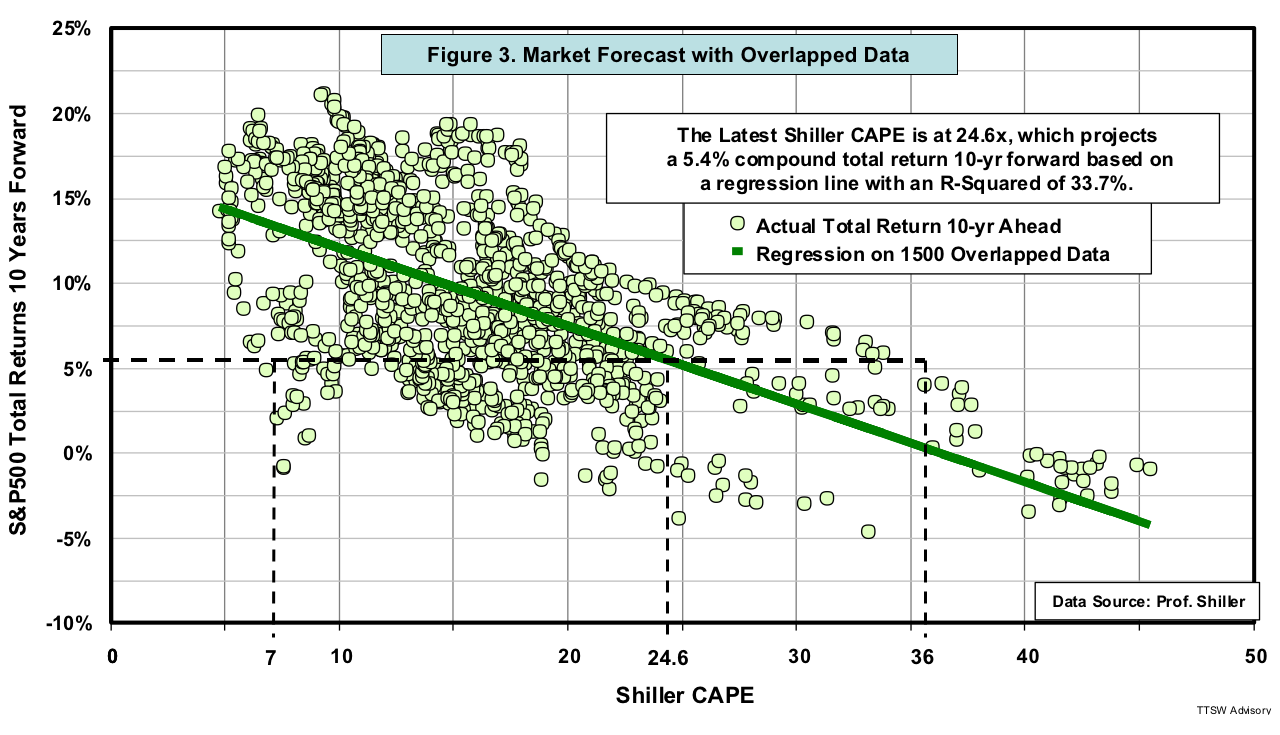
Figure 3 shows that my study of CAPE has an R-squared of 33.7% – lower than Vanguard's 43%. It's probably due to difference in timeframes used (1880-2015 in my study, versus 1926-2011 in Vanguard's).
Let's illustrate what a 33.7% R-squared entails. Using a regression analysis, the CAPE, currently at 24.6, equates to a 5.4% total return over the next 10 years. But the same 5.4% return can also be attained using an undervalued CAPE of 7.0, as well as an overvalued CAPE of 36. These meaningless regression results are the consequences of the relatively low R-squared.
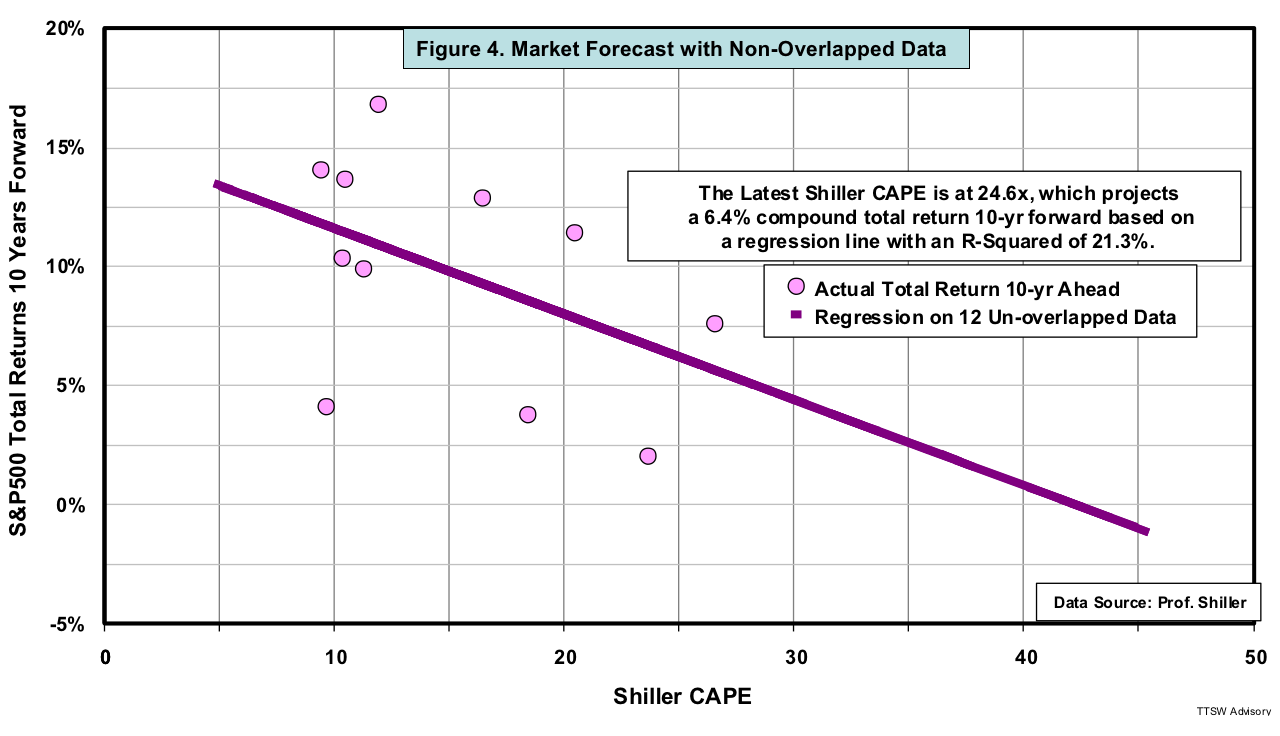
Researchers commonly use this regression methodology, but it's statistically flawed. In a 10-year rolling regression, each sample period overlaps 90% of its data with the next sample point. Only 12 samples (124 years divided by 10 years) are truly independent. Figure 4 shows that if only 12 samples are used, R2 would be reduced to 21.3%, too low to be useful. Also 12 samples are too few to be statistically significant. Hence, both forecasting methodologies are problematic – with and without using overlapped intervals.
A widespread anomaly
Low predictive power and overlapping intervals are not the only issues of which analysts need to be aware. Another major challenge is calibrating the gauge used to actually measure valuations. Generally, calibration relies on a universal assumption of mean reversion, which has been the norm for over a century. Since the mid-1990s, however, readings from many valuations metrics have failed to revert toward the century-old mean. Looking deeper, one might ask whether the current market is overvalued, or the measuring gauges are off calibration due to a 20-year hiatus in the assumed mean reversion.
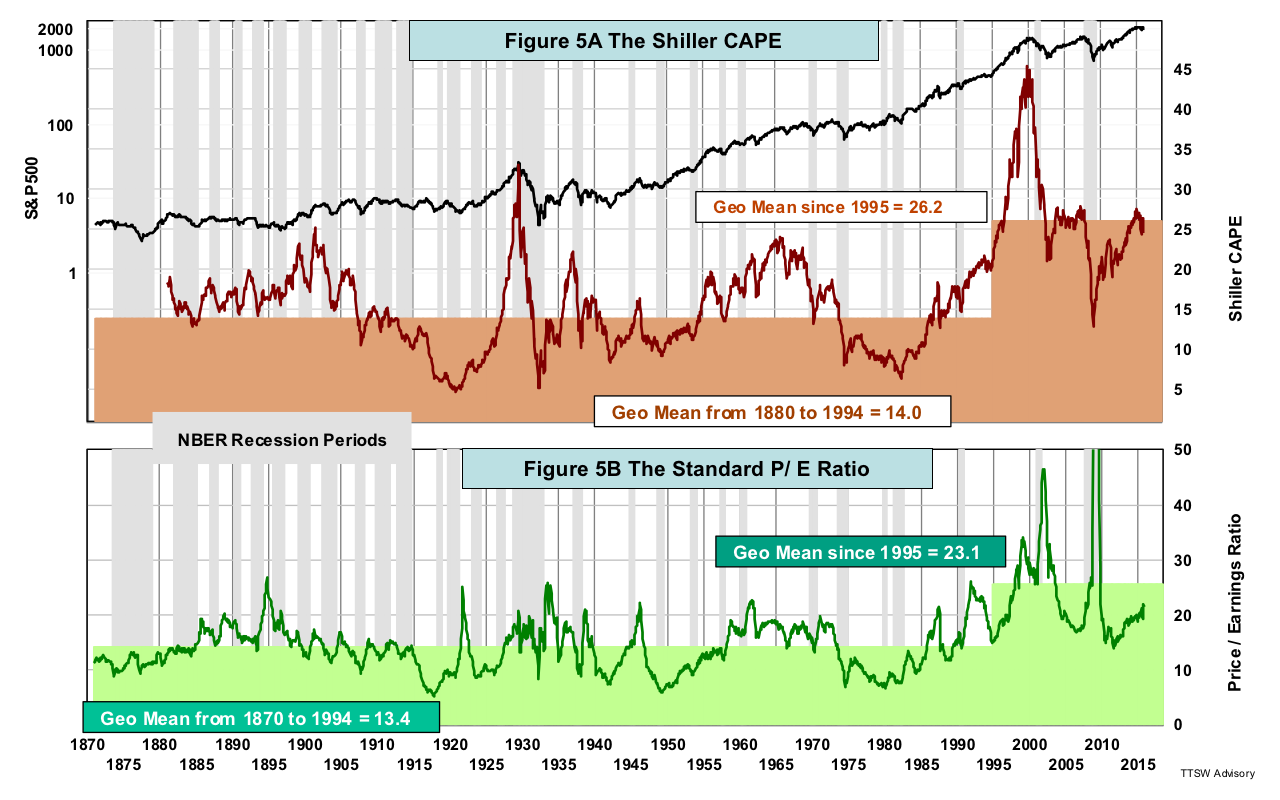
Consider Figure 5A, which shows a range-bound CAPE from 1880 to 1994 with a stable geometric mean of 14. Beginning in 1995, its mean climbed to 26.2 and has remained elevated since. At 26.2, the new mean exceeded all CAPE readings from 1880 to 1994 except one in 1929. Mean CAPE values have been completely out of character in the last two decades from what they were in the entire preceding century.
Mean instability is not limited to CAPE. Figure 5B shows the standard P/E ratio based on one year of earnings. Its mean almost doubled after 1995. Since earnings appear in the denominators in both the CAPE and P/E ratios, it's logical to speculate that the overshoots must be caused by under-reported earnings.
The case of the runaway CAPE has generated much interest. Professor Jeremy Siegel was the first to point out the negative earnings impact by the FAS 142 accounting rules issued in 2001. He used various profit proxies to capture real earnings, yet his adjustments did not remove the post-1995 elevation; rather, it only lowered the curves evenly over time (pg.13).
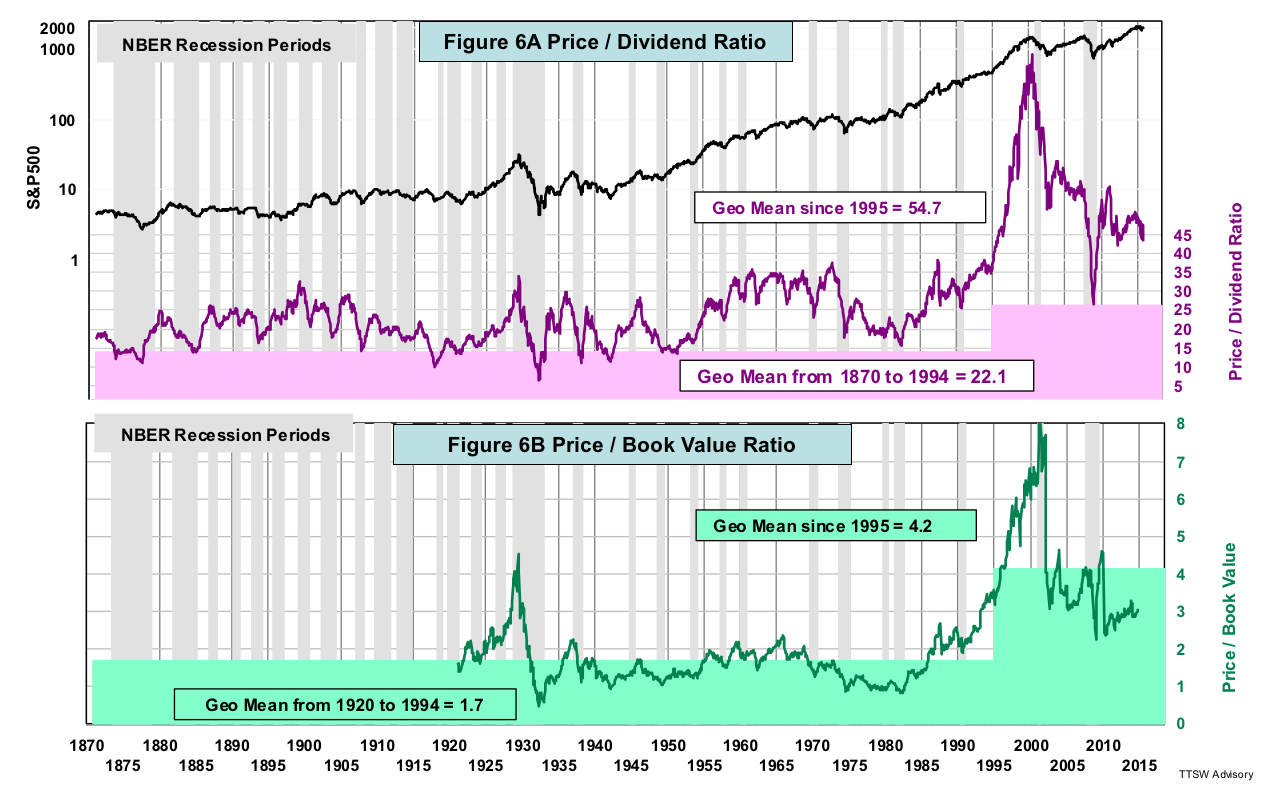
If earnings distortions inflated CAPE in the past two decades, then perhaps valuations metrics that are not based on earnings would have a stable mean. Let's look at two well-known valuations ratios – price-to-dividends (data source: Shiller) and price-to-book (data source: Goyal). Prices are set by the market. Book value comes from the balance sheets, not the income statements. Dividends come out of cash flow, not from earnings. Therefore, one would expect both ratios to be impervious to any earnings distortion and to have a stable mean.
To the contrary, Figures 6A and 6B show that these two ratios surged even more than the CAPE or P/E. Since 1995, the means of both ratios have jumped 2.5 times, so one can conclude that accounting and regulatory changes alone cannot explain the anomaly.
Irregularities also appeared in two other popular valuation metrics. Tobin's Q is the ratio of the combined market value of all public companies to the total asset replacement value in those firms. Buffett defined his eponymous indicator as market cap-to-GNP. Since 1995, the Tobin's Q dipped below its 134-year mean only once. The Buffett indicator fell below its 63-year mean only twice.
The six metrics presented above are not the only ones that show elevated levels. Many less popular valuations ratios also exhibit similar aberrations in the past twenty years (see Chart 2 in this reference ). Is the stock market truly overvalued, or are the measuring gauges malfunctioned in their mean-reversion process?
A misguided faith in mean reversion?
The market can be considered overvalued if the 20-year lofty readings from many valuations ratios are all statistical outliers and will eventually revert back to their historical means. However, it's naive to think the last two decades were outliers. If the outliers are the results of randomness, they will regress to the mean. On the other hand, if they are caused by unidentified but nonrandom factors, then there may be no mean reversion. Indeed, Shiller proposed in 2014 that the elevated CAPE might be driven by behavioral factors. Such factors might be irrational, but they are certainly not random.
The misguided expectation faith in mean reversion has far-reaching impacts in the field of investments beyond market valuations. That will be the subject of a future article.
In my next article, I will present an original gauge I developed many years ago. It measures valuations not by the traditional ratios, but by the market dynamics forged by the aggregate investor behaviors. This gauge has been range-bound for over a century and continues to revert to an inherently stable mean today. Stay tuned!
Theodore Wong graduated from MIT with a BSEE and MSEE degree. He served as general manager in several Fortune-500 companies that produced infrared sensors for satellite and military applications. After selling the hi-tech company that he started with a private equity firm, he launched TTSW Advisory, a consulting firm offering clients investment research services. For over three decades, Ted has developed a true passion in the financial markets. He applies engineering statistical tools to achieve absolute investment returns by actively managing risk in both up and down markets. He can be reached at [email protected].
Read more articles by Theodore Wong