
Each quarter, the index powering the VictoryShares Free Cash Flow Growth ETF (GFLW ) reconstitutes according to its methodology. This March’s reconstitution brought a fresh set of free cash flow (FCF) leaders into focus. When capital is expensive, FCF isn’t a preference. It’s a prerequisite. The Victory Free Cash Flow Growth Index’s Q1 reconstitution, completed March 20, 2026, reflects which companies have met that bar. This quarter, the index’s methodology surfaced a notable pivot from basic materials and technology companies to gold miners and semiconductor infrastructure firms, signaling where disciplined cash generation is showing up in the current higher-for-longer rate environment.
FCF, defined as the capital remaining after a company meets its operating expenses, is the metric at the center of GFLW’s index methodology. The index doesn’t screen for narrative or momentum. It screens for companies that have demonstrated the ability to generate cash above and beyond what it costs to run the business. That capacity is measured by FCF return on invested capital (FCF ROIC): the average of trailing 12-month FCF and next 12-month forward FCF, divided by invested capital.
In a higher-for-longer rate environment, that distinction matters. Companies generating real cash aren’t dependent on cheap debt to fund operations or growth. The reconstitution reflects which companies cleared that bar as of the rebalance date.
Gold Miners and Semiconductor Stocks Lead Q1 2026 Free Cash Flow Growth Additions
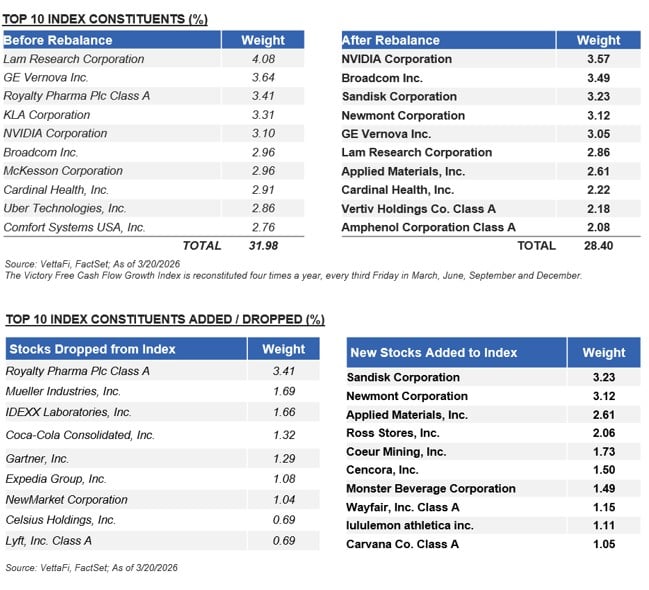
The reconstitution reflects a shift toward basic materials and technology, two sectors where the macro backdrop has translated into measurable cash generation. Leading the additions is Newmont Corporation (NEM), which entered the index at a 3.12% weighting. Two years of elevated gold prices (2024 – present day) provided a favorable revenue environment for Newmont, but what earned it a place in the index was the outcome: demonstrated FCF generation and disciplined capital expenditure relative to invested capital. The methodology rewarded the result, not the commodity cycle. Coeur Mining, Inc. (1.73%) reinforces that theme, a second precious metals producer whose FCF profile cleared the screen on the same basis.
The technology additions tell a parallel story. Sandisk Corporation entered as the index’s largest new constituent at 3.23%, followed by Applied Materials, Inc. at 2.61%. Both companies operate at the infrastructure layer of the AI-driven capital expenditure cycle, supplying the storage, memory and semiconductor equipment that sustained demand has made into significant FCF generators. The index caught that dynamic as it showed up in the data, not as a forecast.
Free Cash Flow: The Truth-Teller
Each quarter, GFLW’s rules-based, systematic process applies the same screen. The constituents that result reflect one thing: which companies are converting revenue into real financial flexibility. That’s what FCF measures. Not earnings, which can be shaped by accounting choices. Not revenue, which says nothing about what it cost to generate. FCF is what remains when the bills are paid. In a market environment where investors are scrutinizing balance sheets more carefully, it has become the metric that we believe cuts through the noise.
Market headlines move fast, driven by disappointing earnings, stock-specific events and macro uncertainty. An objective, rules-based screen incorporating FCF ROIC provides a disciplined counterweight to that noise, delivering a consistent and replicable measure of cash generation that doesn’t shift with sentiment. GFLW is designed to deliver that disciplined exposure at a net expense ratio of 0.39% (39 basis points) and gross expense ratio of 0.50% (50 basis points).2
Net expense ratios reflect the contractual waiver and/or reimbursement of management fees through October 31, 2026.
1FCF / Invested Capital Rate (FCF ROIC) is measured by the average of trailing 12-month FCF and next 12-month forward FCF divided by invested capital, also called free cash flow return on invested capital (FCF ROIC).
2One basis point (bp) equals 0.01% (1/100th of a percent).
For more news, information, and analysis, visit the Free Cash Flow Content Hub
VettaFi LLC (“VettaFi”) is the index provider for GFLW, for which it receives an index licensing fee. However GFLW is not issued, sponsored, endorsed, or sold by VettaFi, and VettaFi has no obligation or liability in connection with the issuance, administration, marketing, or trading of GFLW.
Holdings are subject to change and should not be construed as investment advice or a recommendation to buy, sell, or hold any security.
Disclosure Information
Carefully consider a fund’s investment objectives, risks, charges, and expenses before investing. To obtain a prospectus or summary prospectus containing this and other important information, visit http://www.vcm.com/prospectus. Read it carefully before investing.
All investing involves risk, including the potential loss of principal. The market prices of securities may go up or down, sometimes rapidly or unpredictably, due to general market conditions, such as real or perceived adverse economic, political, or regulatory conditions, recessions, inflation, or changes in interest or currency rates. The VictoryShares Free Cash Flow Growth ETF (GFLW) has the same risks as the underlying securities traded on the exchange throughout the day. ETFs may trade at a premium or discount to their net asset value. Investing in companies with high free cash flows could lead to underperformance when such investments are unpopular or during periods of industry disruptions. GFLW could also be affected by company-specific factors that could jeopardize the generation of free cash flow. Index Funds invest in securities included in, or representative of securities included in, the Index, regardless of their investment merits. The performance of the Fund may diverge from that of the Index. Large shareholders, including other funds advised by the Adviser, may own a substantial amount of the Fund’s shares. The actions of large shareholders, including large inflows or outflows of cash, may adversely affect other shareholders, including potentially increasing capital gains. Investments concentrated in an industry or group of industries may face more risks and exhibit higher volatility than investments that are more broadly diversified over industries or sectors. Investments in companies in the industrials sector, including producers of durable goods and companies that process raw materials, may be adversely affected by changes in supply and demand for products and services, governmental regulation and changes in spending policies, world events and economic conditions. Derivatives may not work as intended and may result in losses. The value of your investment is also subject to geopolitical risks such as wars, terrorism, trade disputes, environmental disasters, and public health crises; the risk of technology malfunctions or disruptions; and the responses to such events by governments and/or individual companies.
The Victory Free Cash Flow Growth Index measures the performance of profitable companies that generate high free cash flow from invested capital and display higher growth characteristics. The indices are subject to sector and security weight constraints. The constituents are weighted by modified absolute momentum.
You cannot invest directly in an index.
VictoryShares ETFs distributed by Victory Capital Services, Inc. (VCS). VCS is not affiliated with VettaFi.
20260423-5412942
