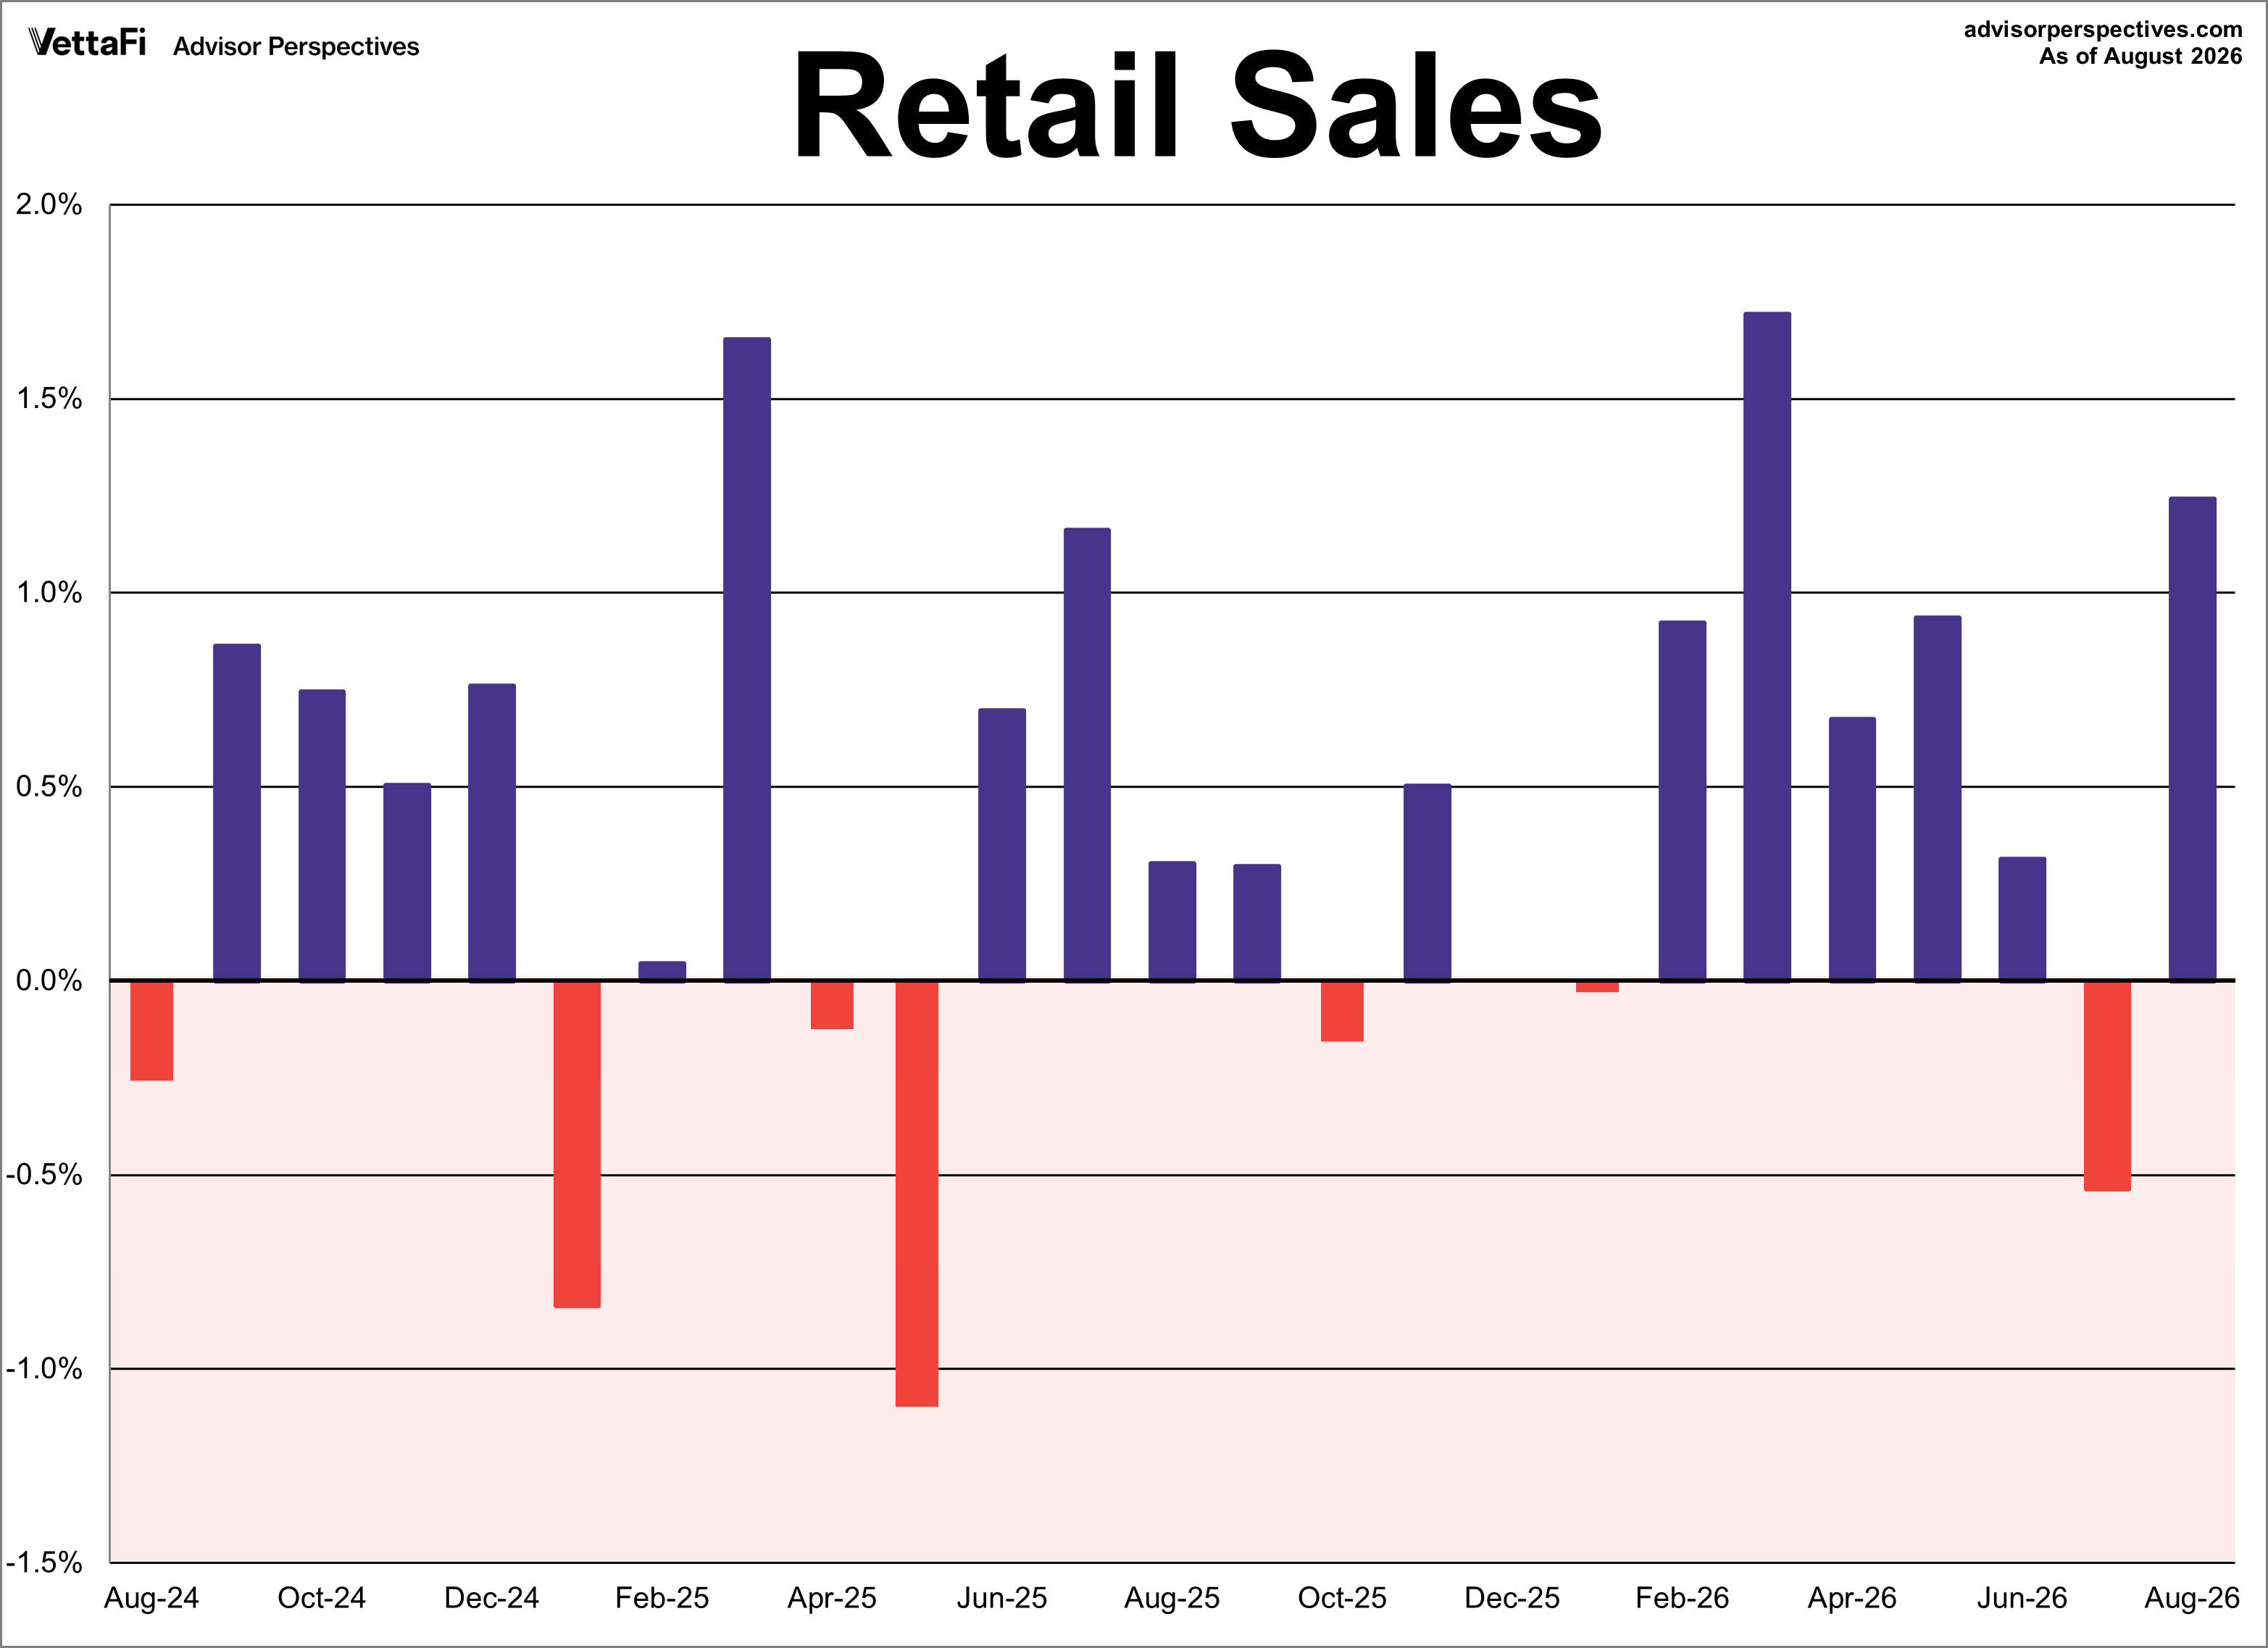
U.S. headline retail sales rebounded in August, up 1.2% to $773.9 in August, while core retail sales increased by 1.4%.
Key Takeaways
- Headline retail sales increased in August, up 1.2% to $773.9 billion.
-
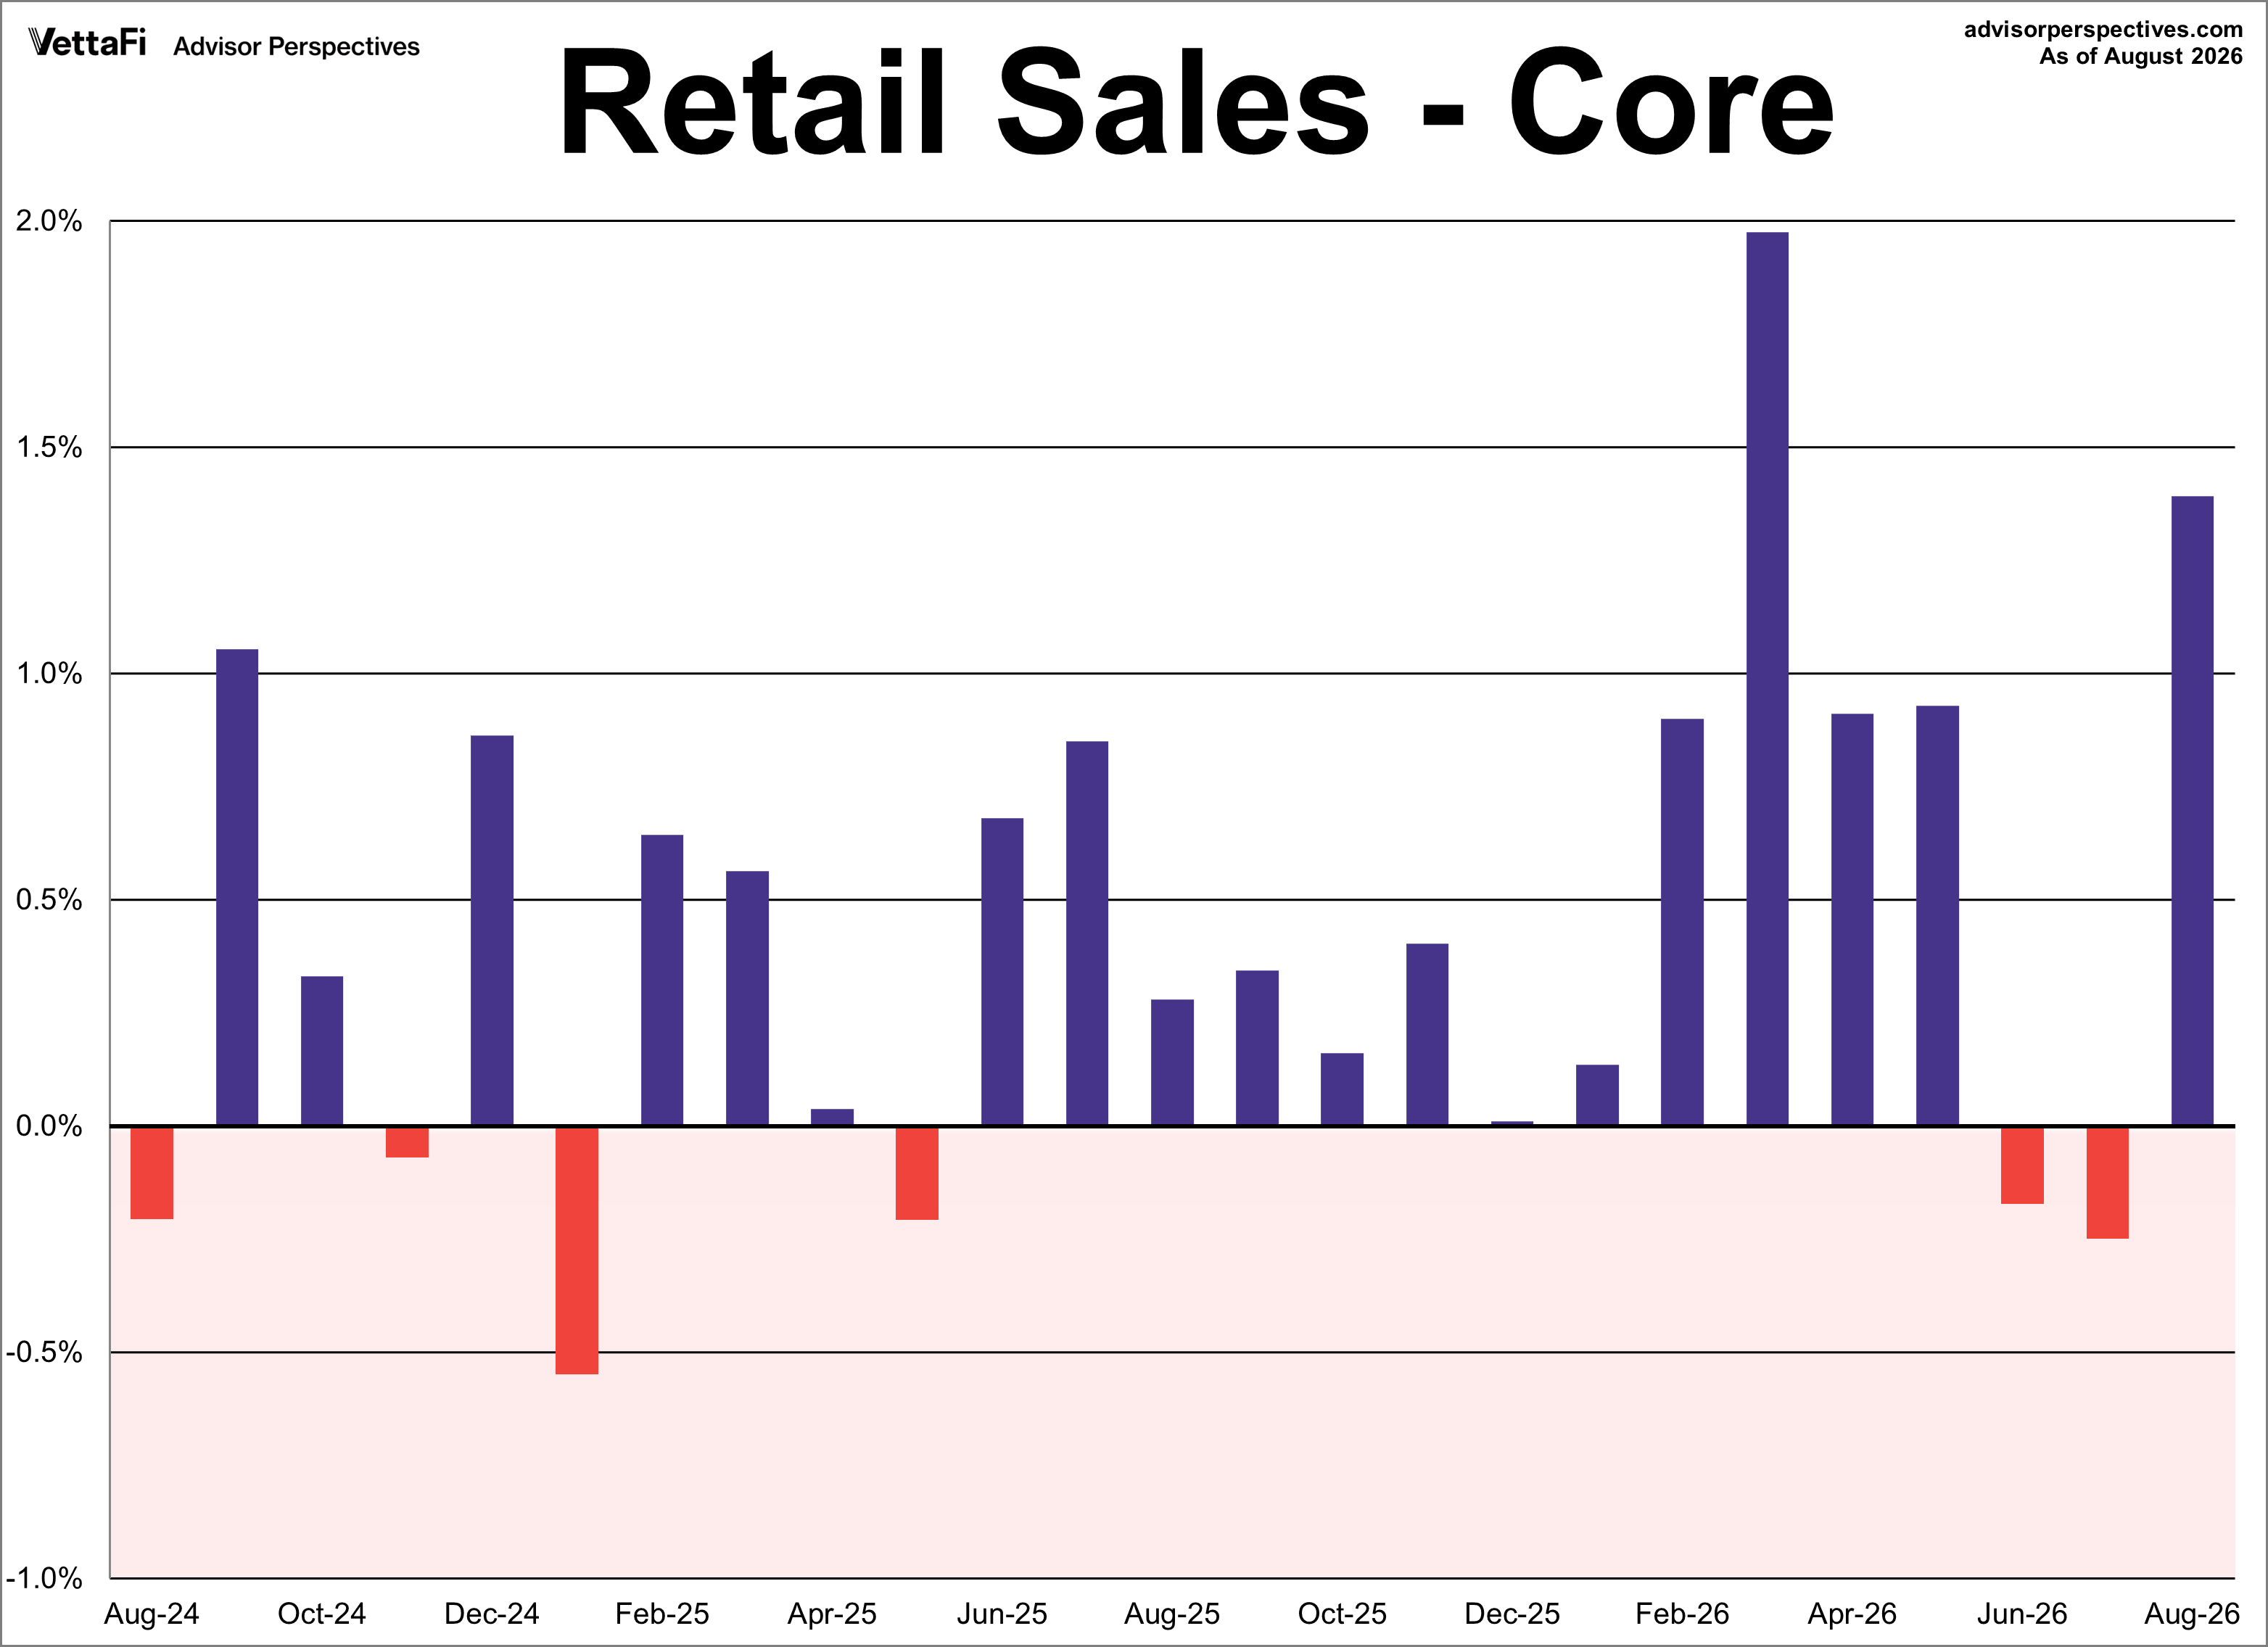
Core retail sales were up 1.4% in August, rebounding from last month's decline.
-
Control purchases increased 1.4% in August, up from last month and above expectations.
For an inflation-adjusted perspective on retail sales, take a look at our Real Retail Sales commentary.

Here is the introduction from today's report:
Advance Estimates of U.S. Retail and Food Services
Advance estimates of U.S. retail and food services sales for August 2026, adjusted for seasonal variation and holiday and trading-day differences, but not for price changes, were $773.9 billion, up 1.2 percent (±0.4 percent) from the previous month, and up 6.0 percent (±0.5 percent) from August 2025. Total sales for the June 2026 through August 2026 period were up 6.0 percent (±0.5 percent) from the same period a year ago. The June 2026 to July 2026 percent change was revised from down 0.6 percent (±0.4 percent) to down 0.5 percent (±0.2 percent).
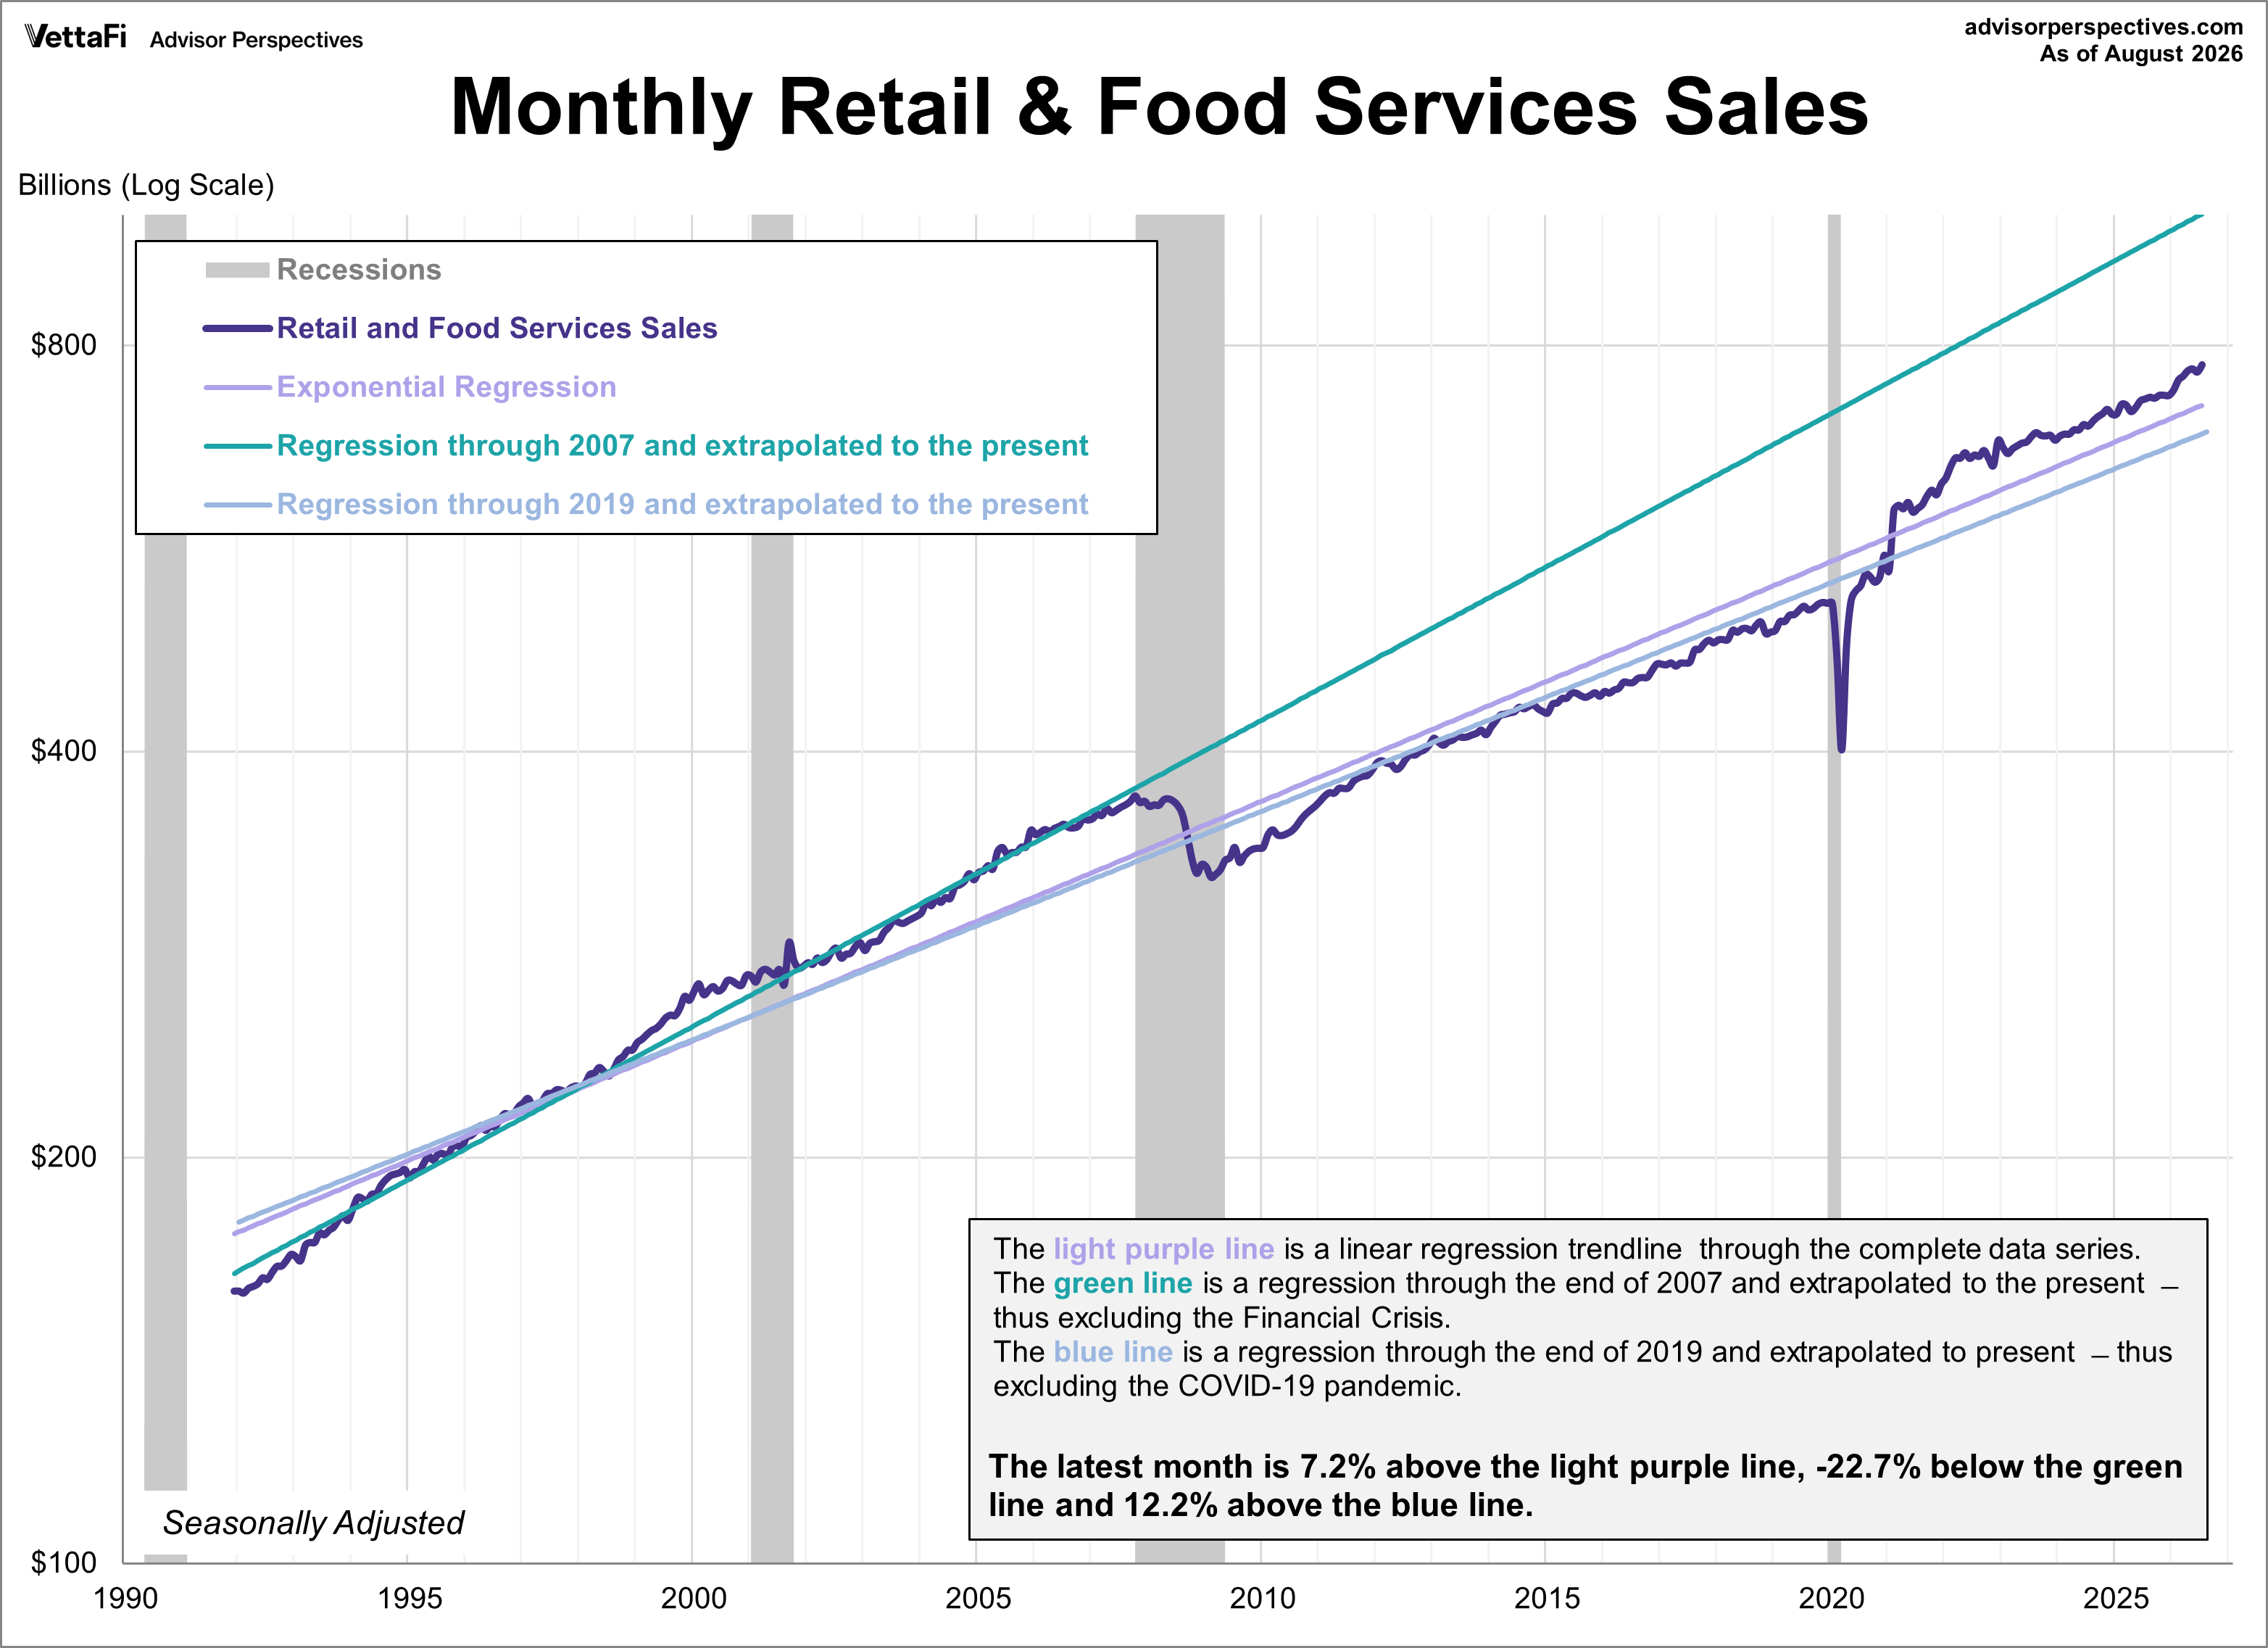
The chart below is a log-scale snapshot of retail sales since the early 1990s. The three exponential regressions through the data help us to evaluate the long-term trend of this key economic indicator.
- The light purple line is a linear regression through the complete data series.
- The green line is a regression from the start of the series through the end of 2007 and then extrapolated to the present - thus excluding the Financial Crisis.
- The blue line is a regression from the start of the series through the end of 2019 and then extrapolated to the present - thus excluding the COVID-19 pandemic.
Monthly retail sales have been above the light purple and blue line since March 2021, signaling increased consumer spending that was most likely pent up as a result of the pandemic.
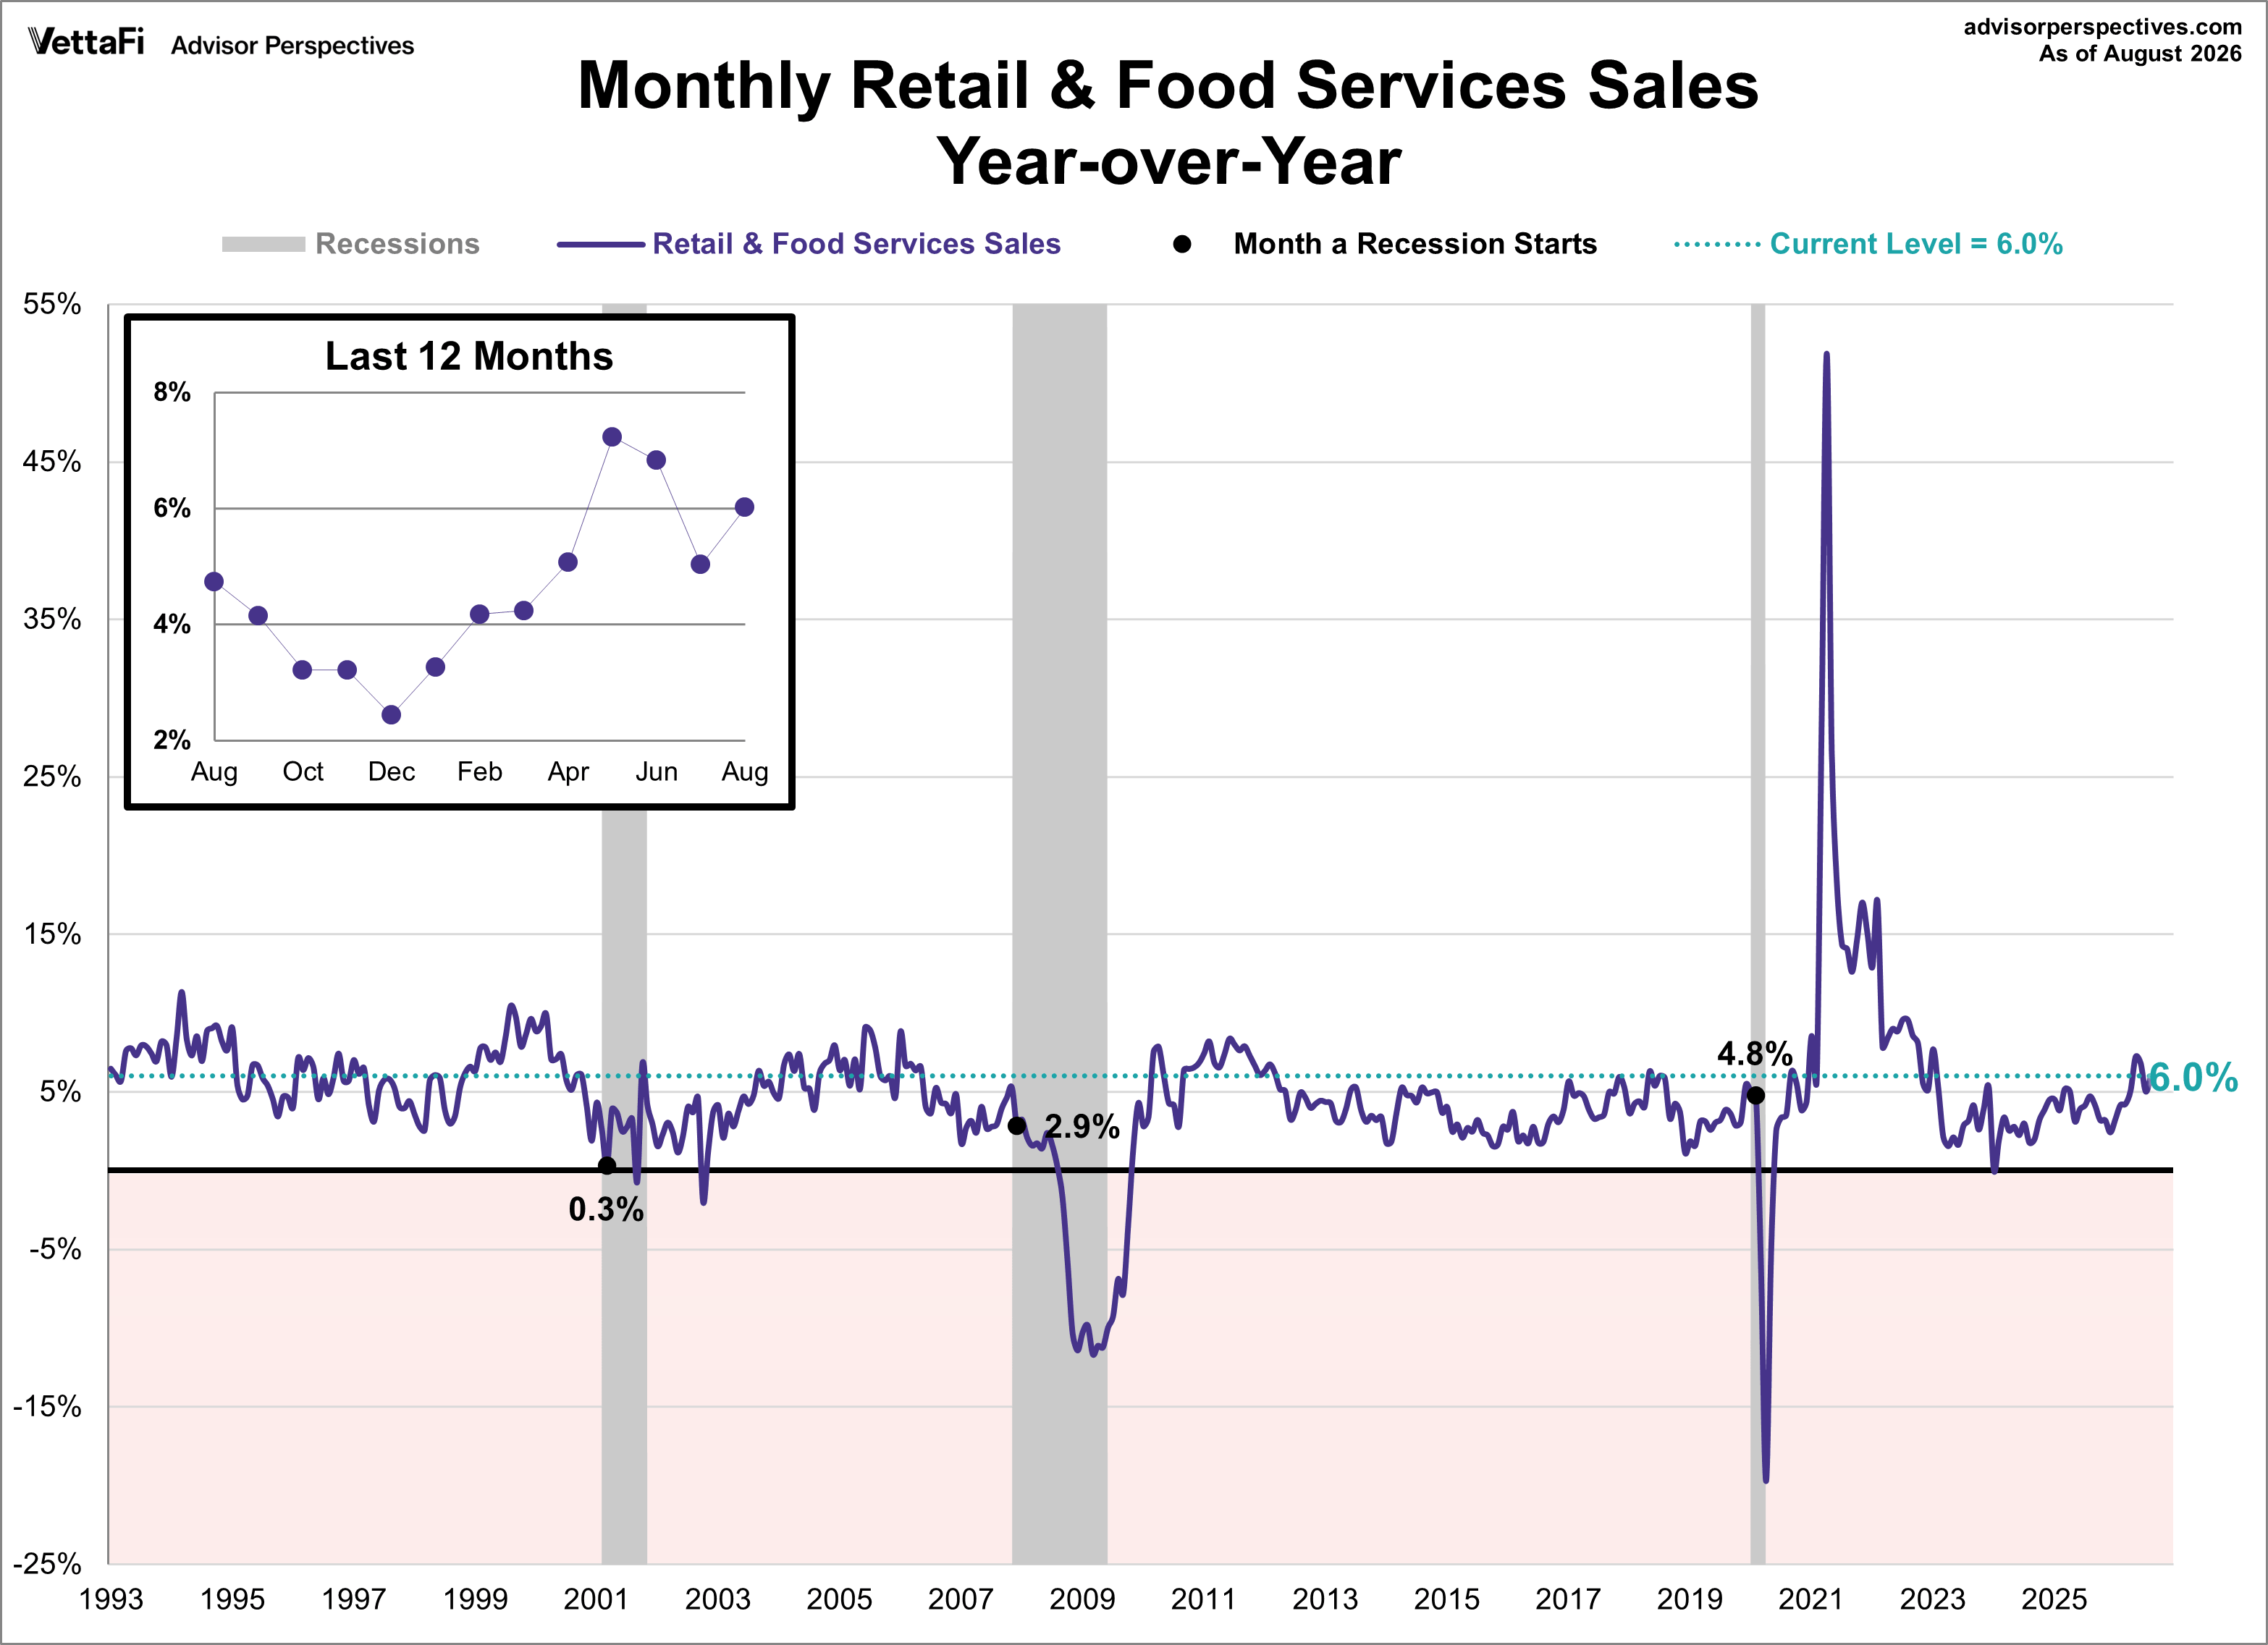
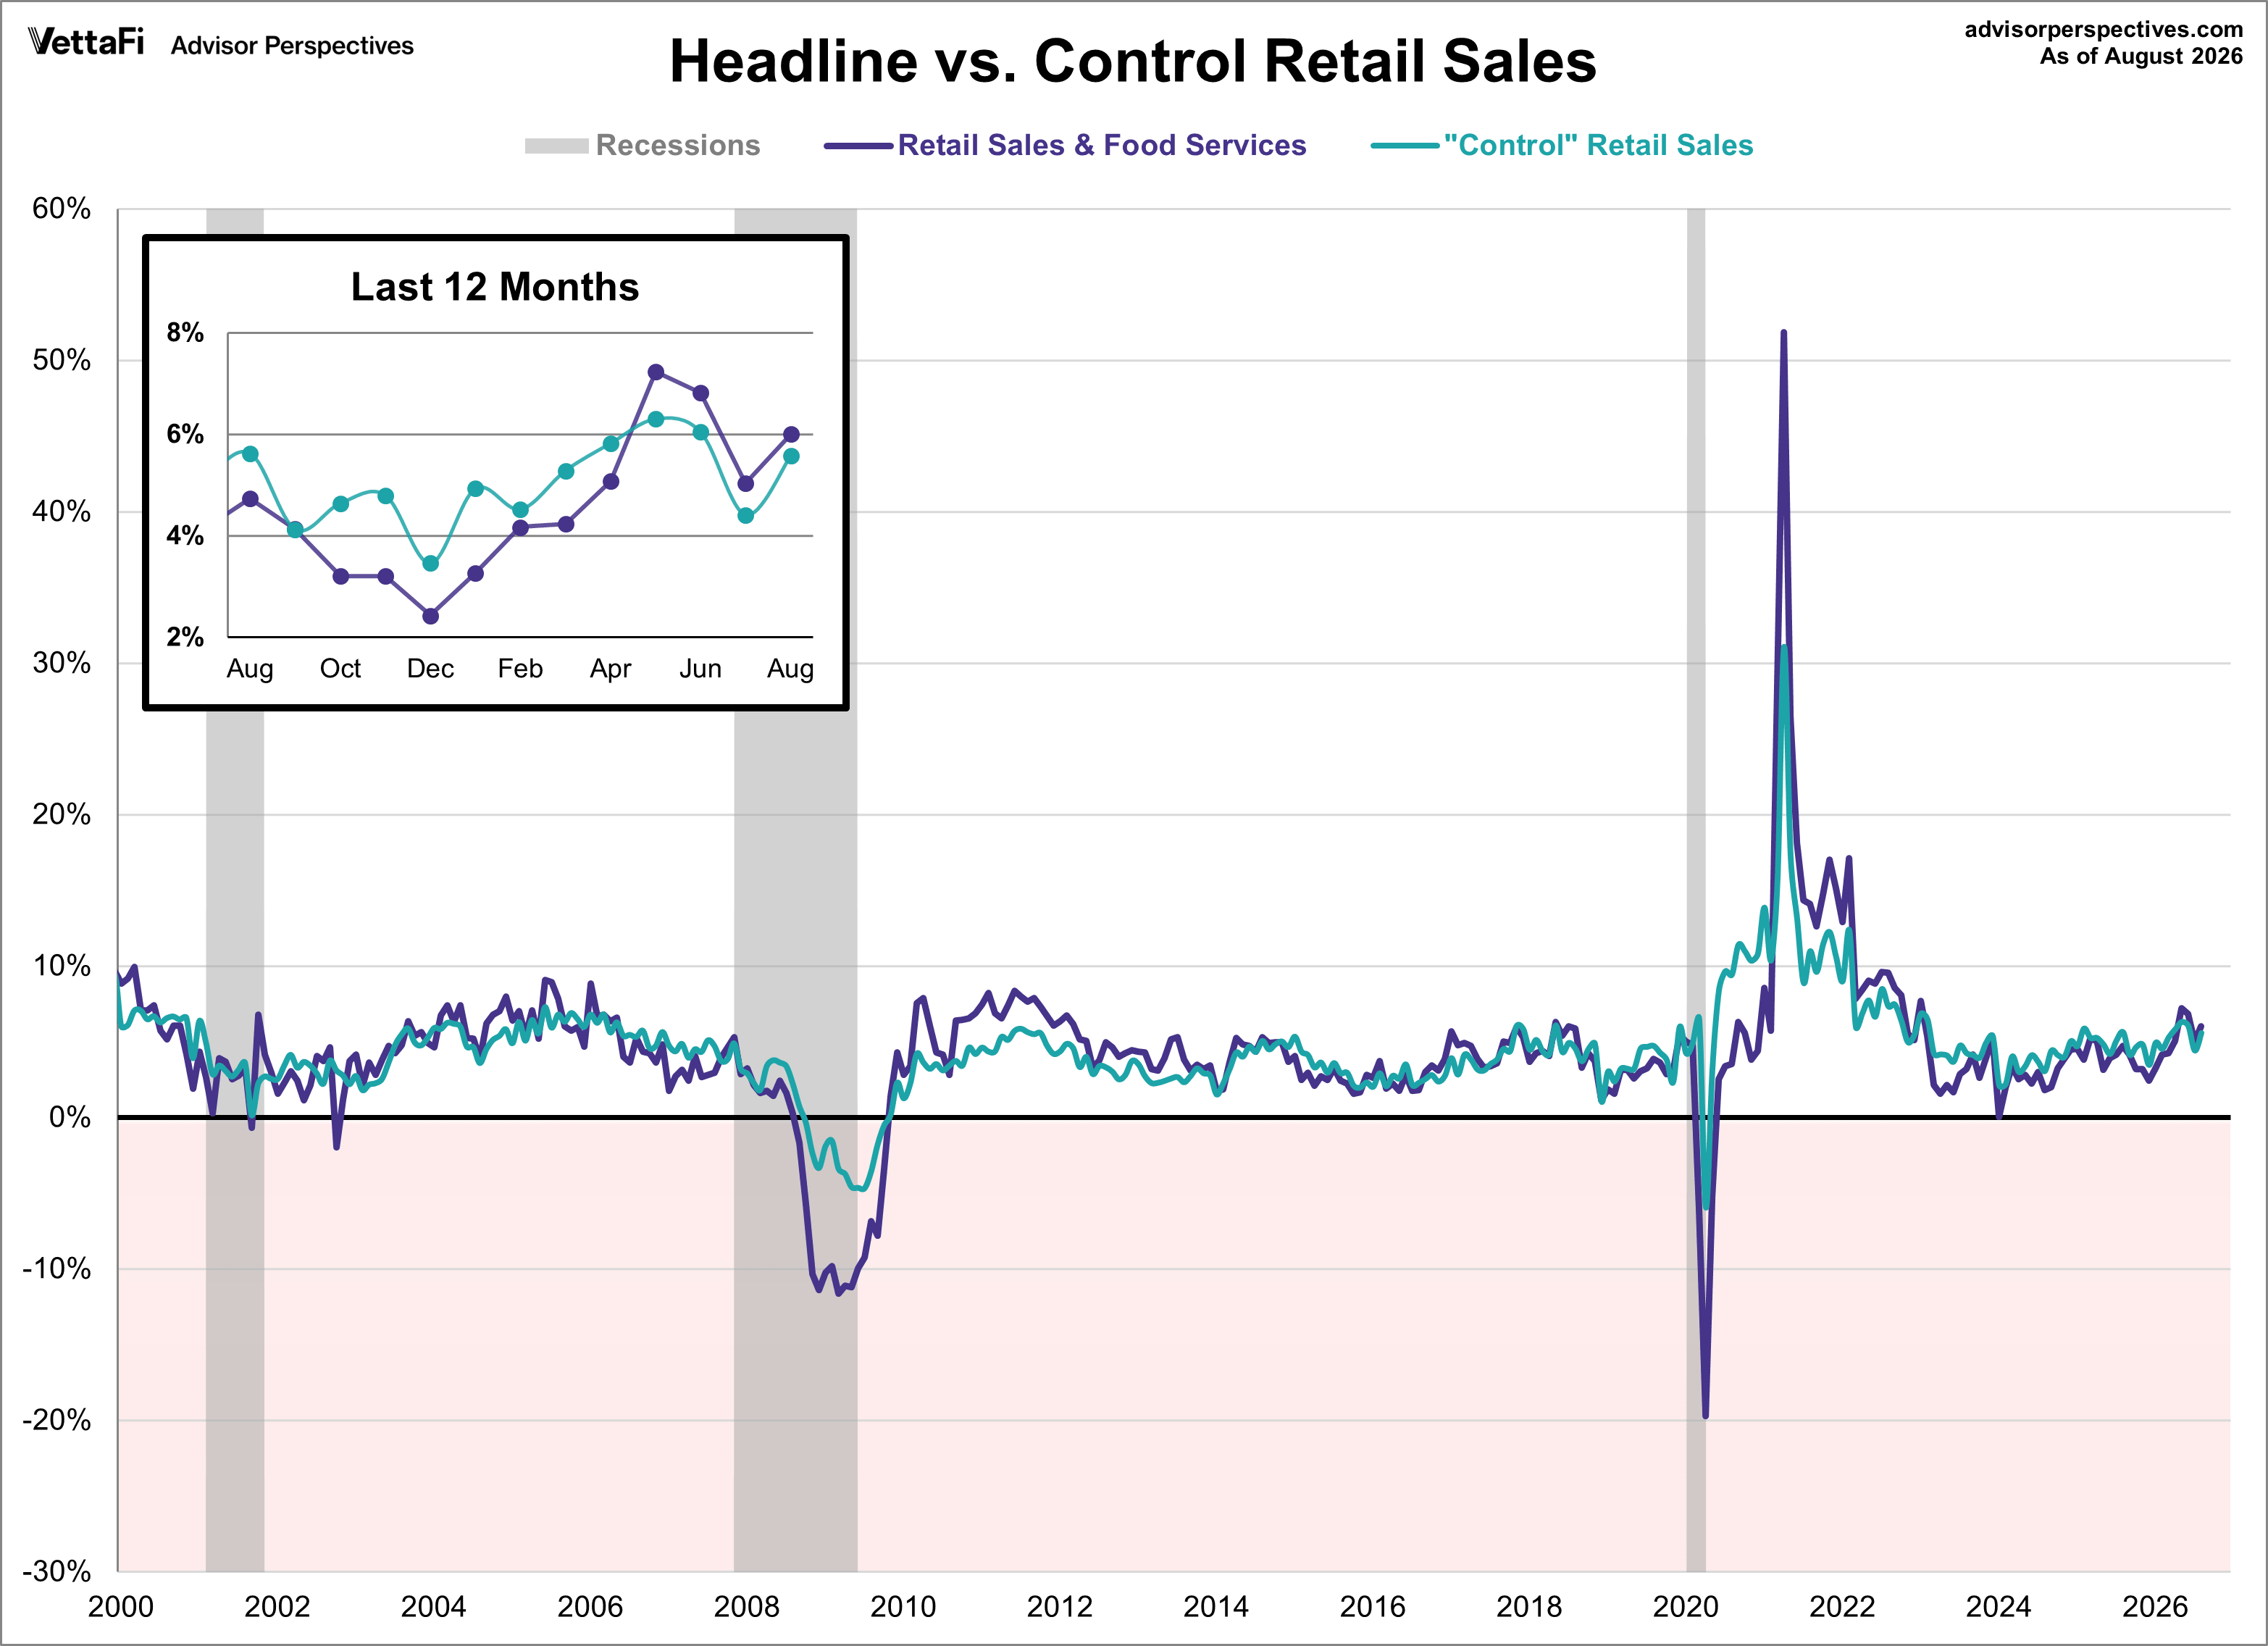
The year-over-year percent change provides another perspective on the historical trend. Current retail sales are up 6.0% compared to one year ago. Here is the headline series with a callout to the most recent 12 months.
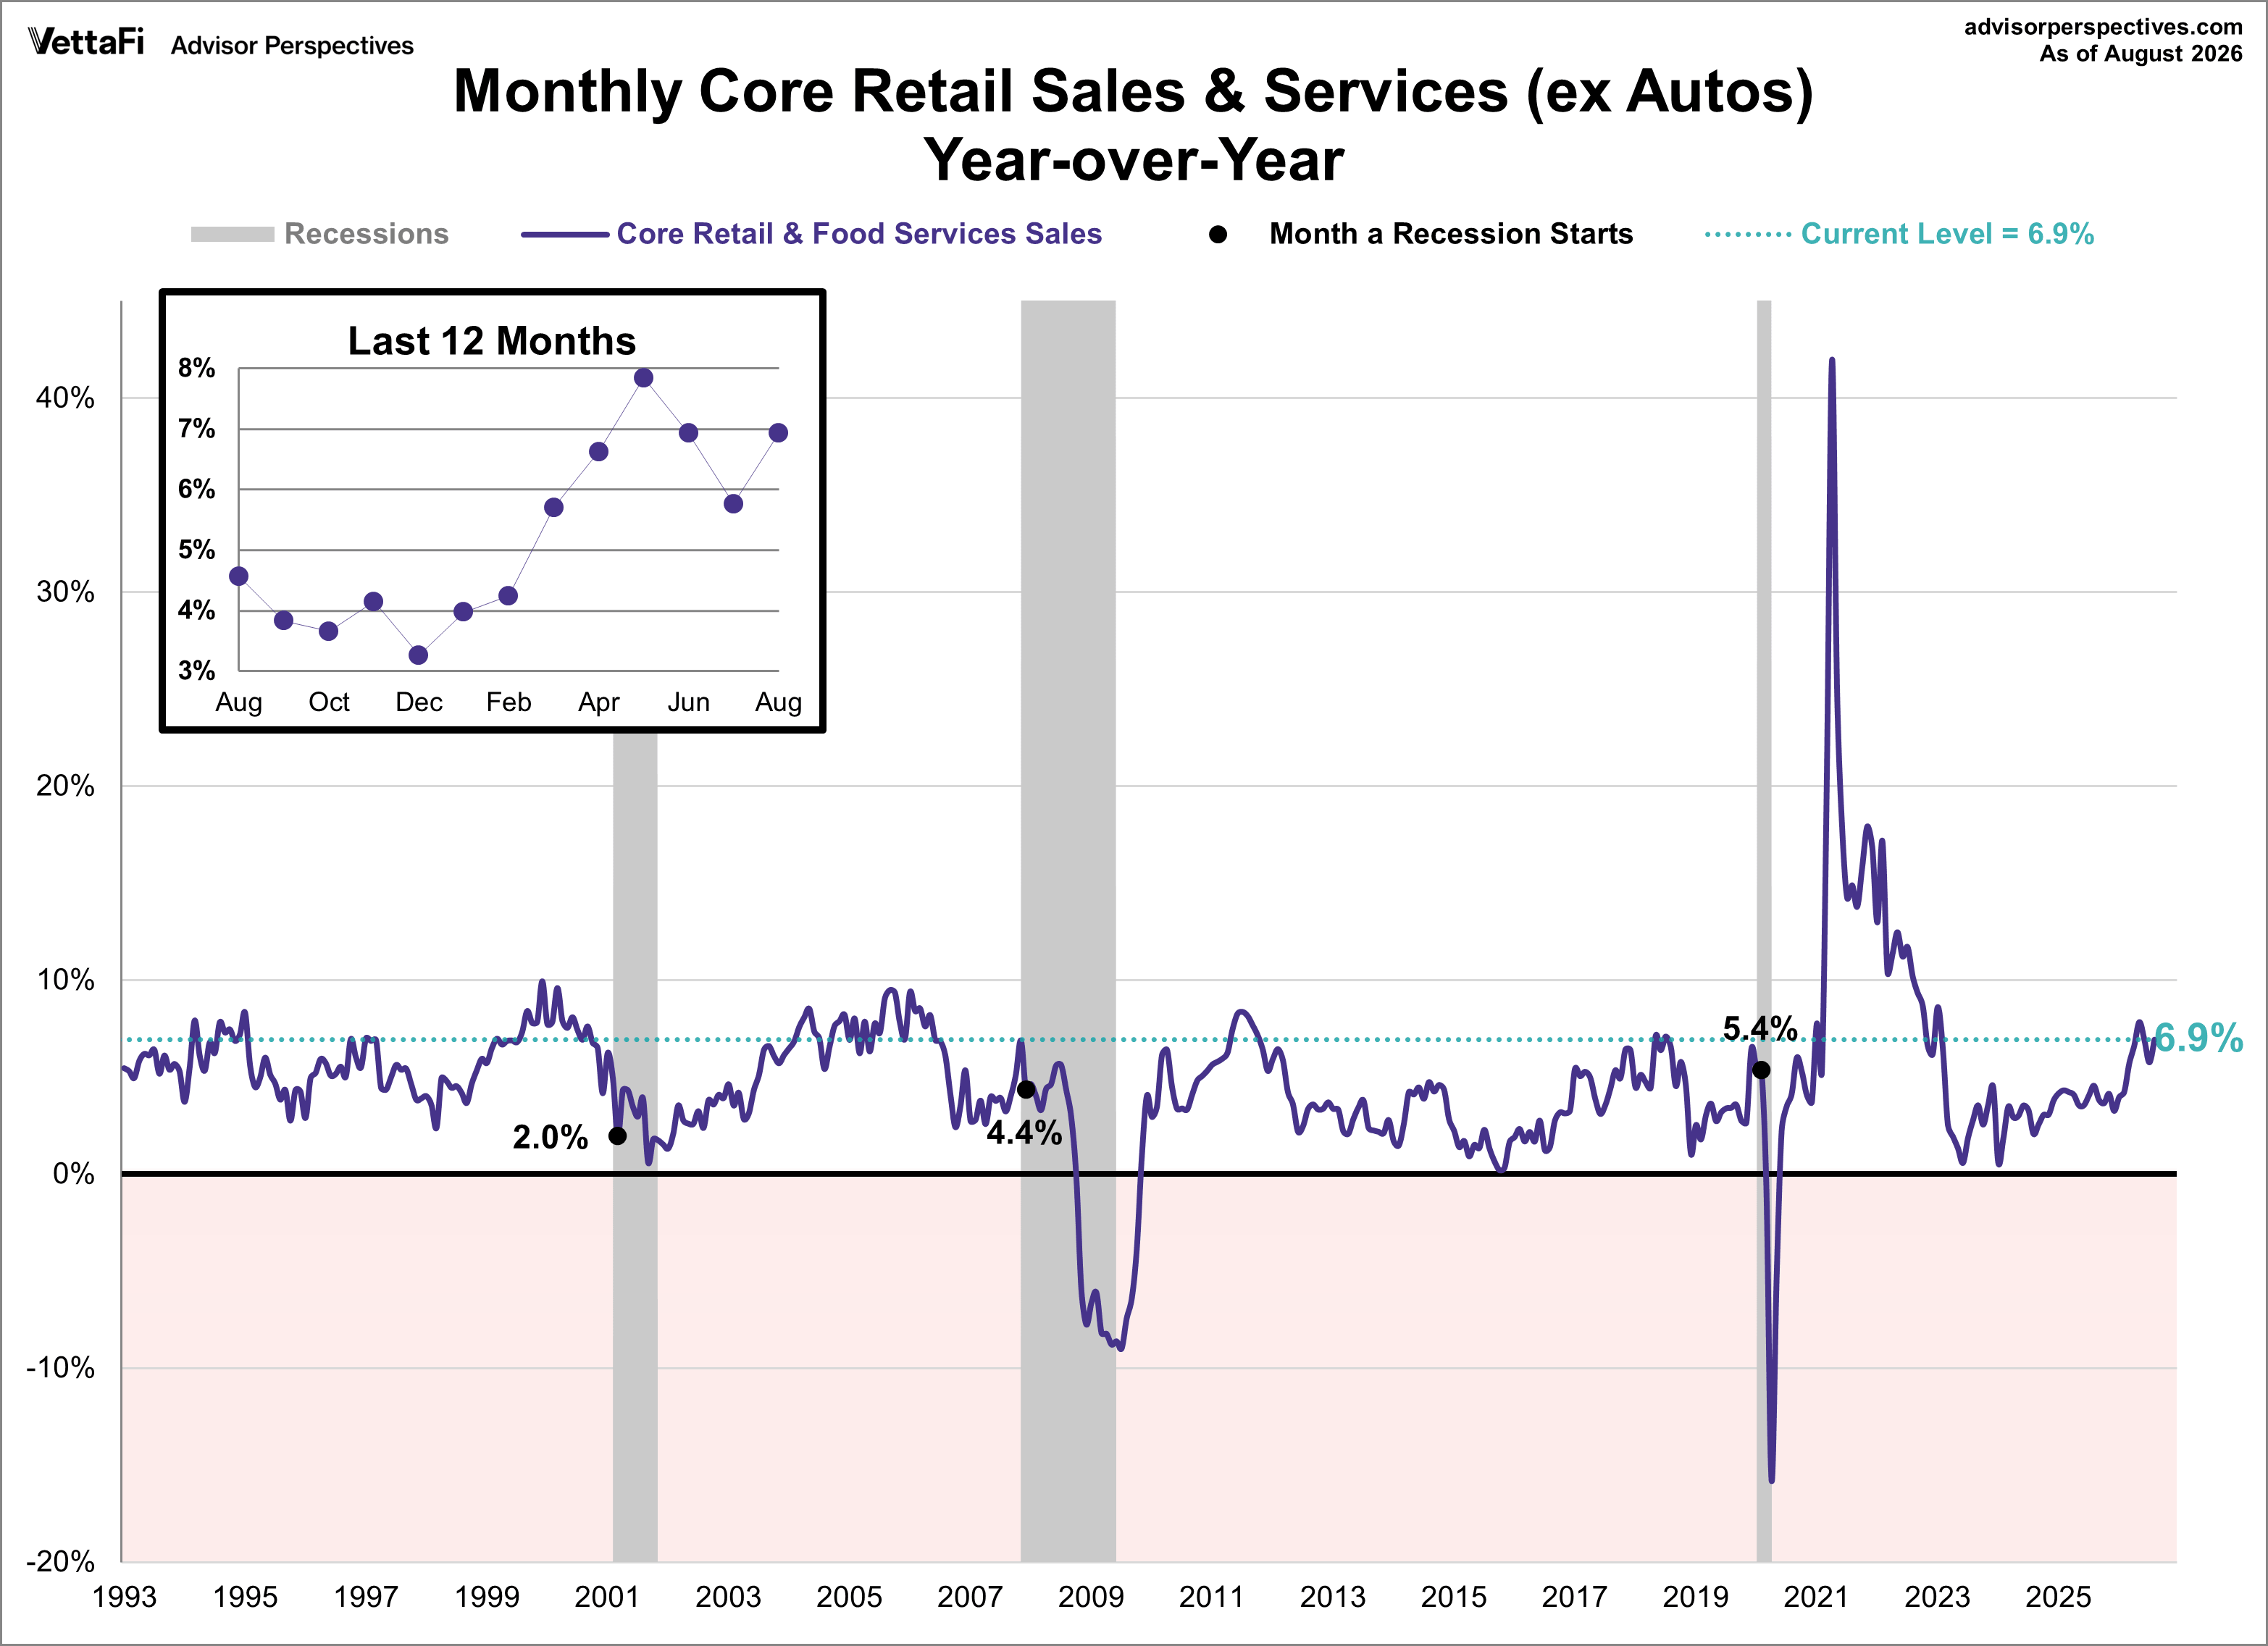
Core Retail Sales (Excluding Autos)
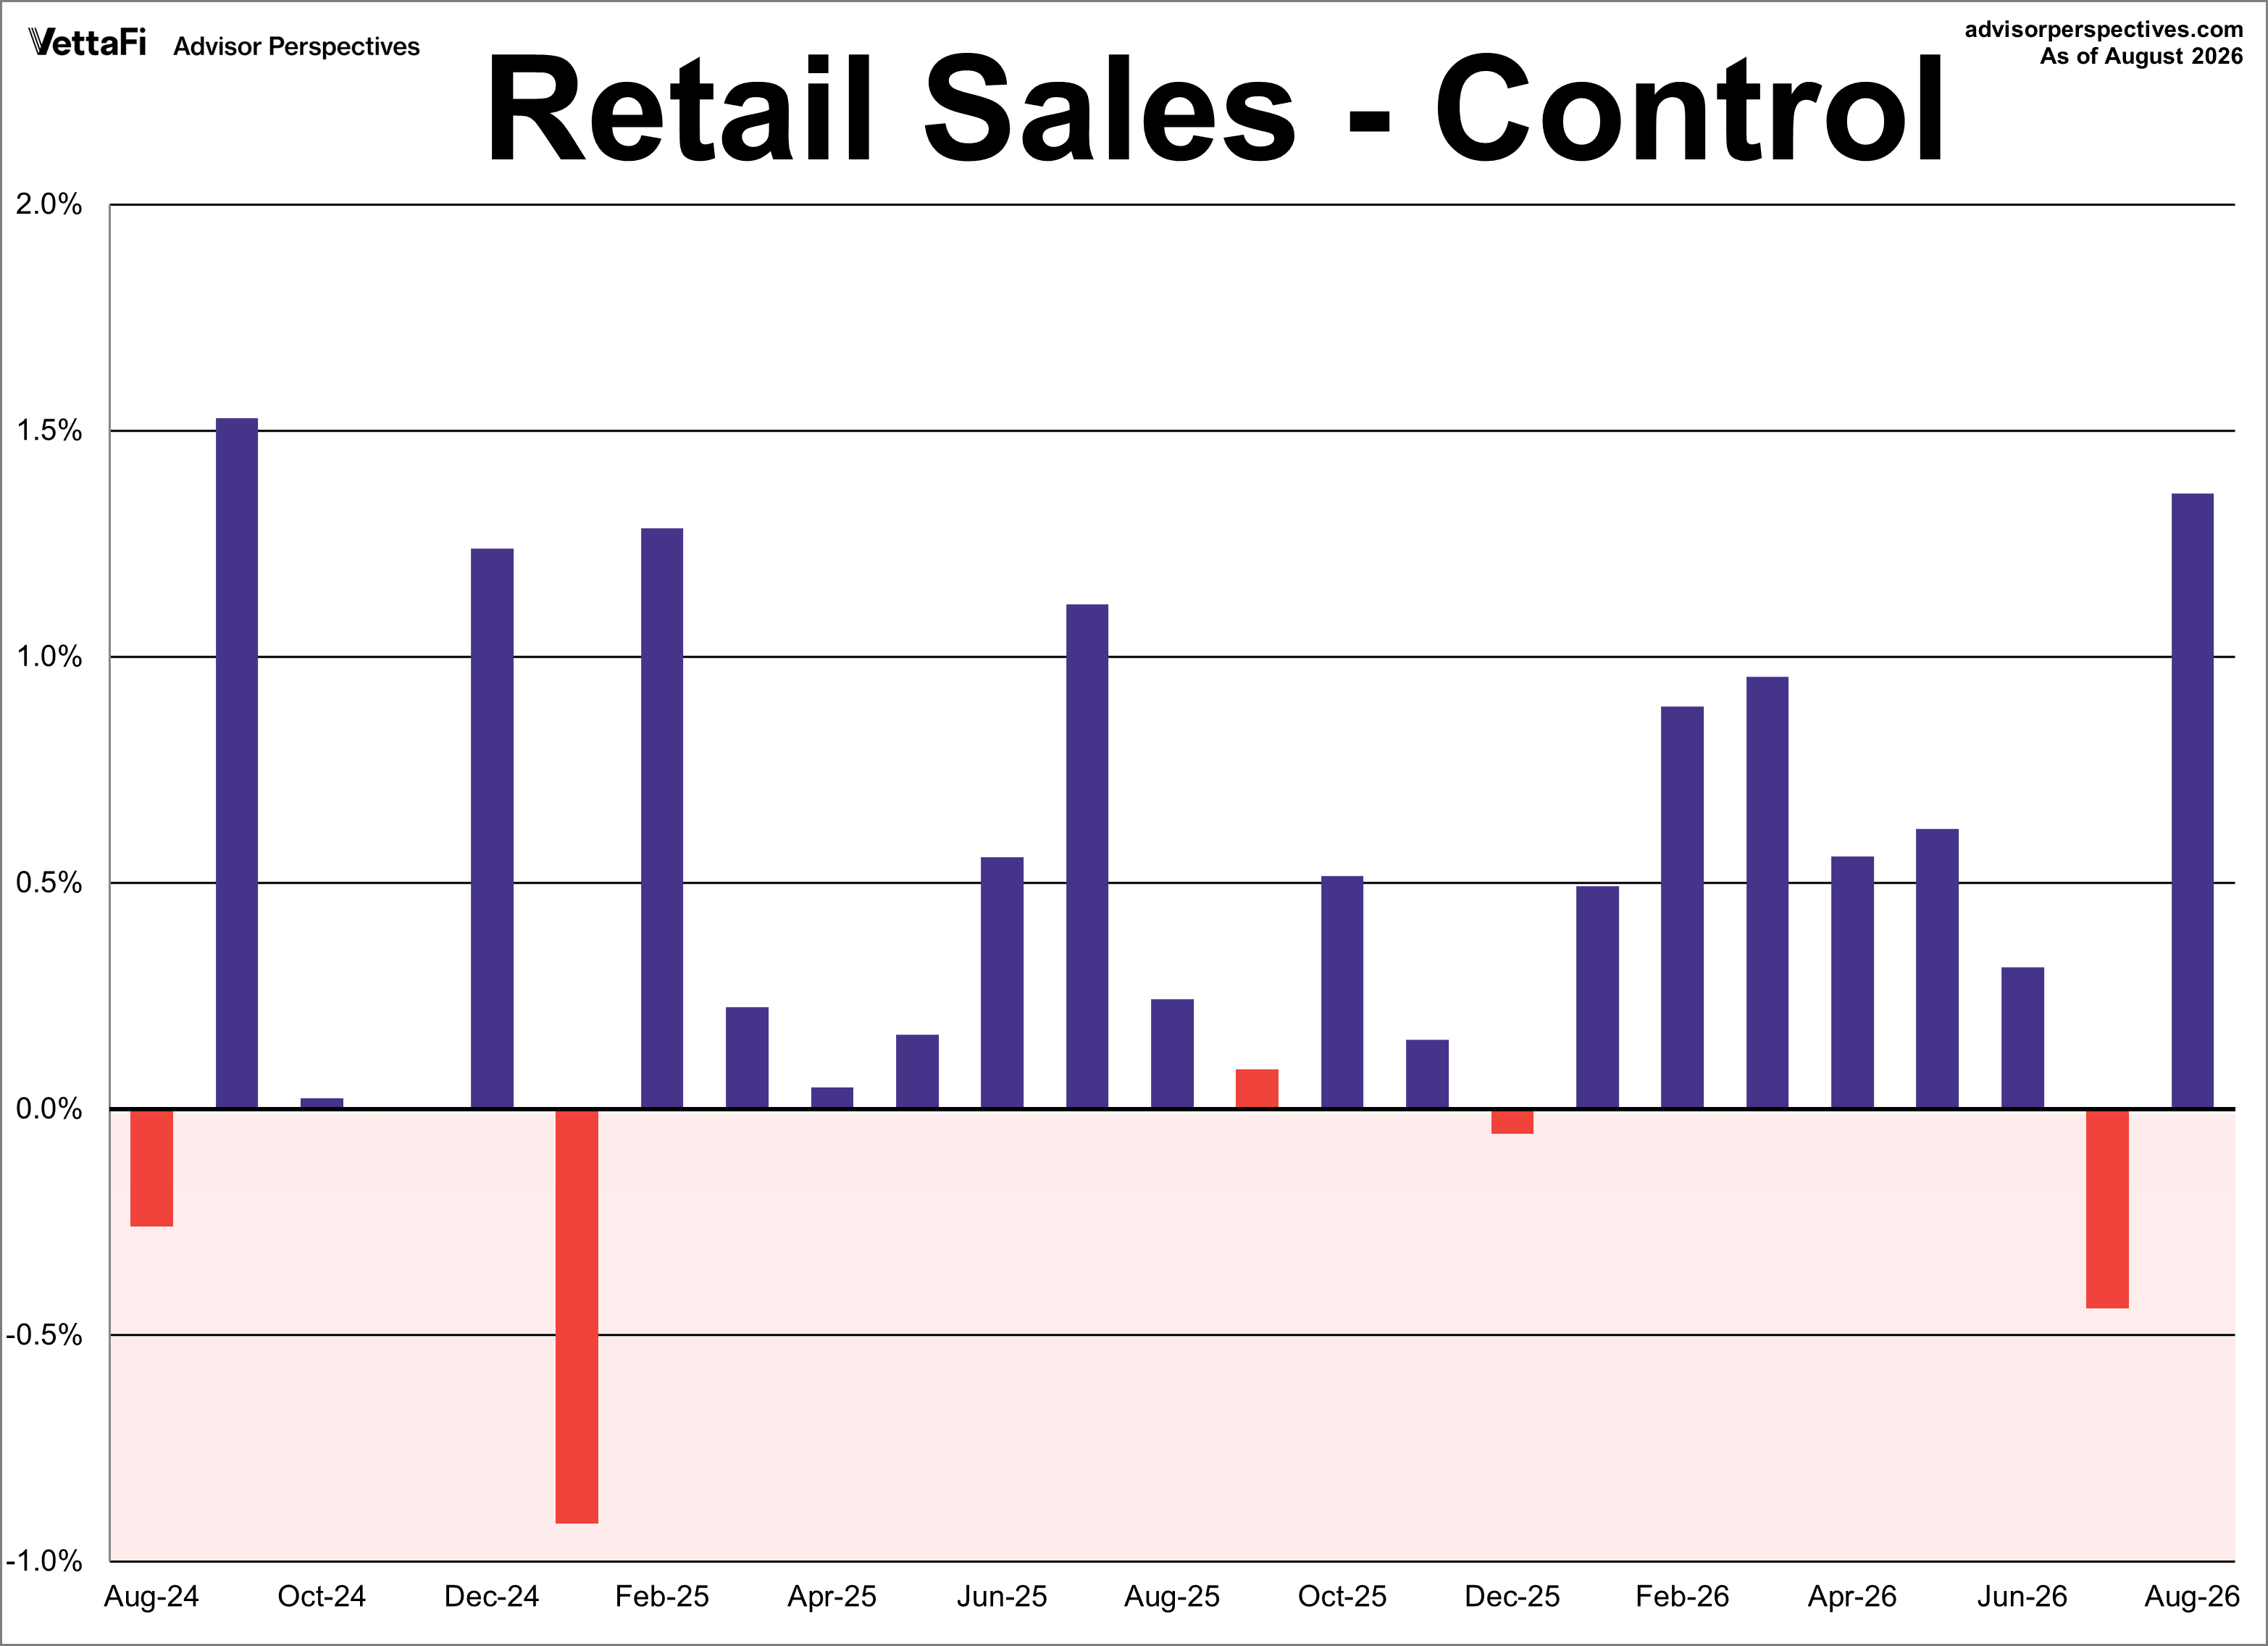
Core sales were up 1.4% in August. This was up from the 0.3% contraction in July and was lower than the -0.2% forecast.
Core sales are up 6.9% year-over-year.
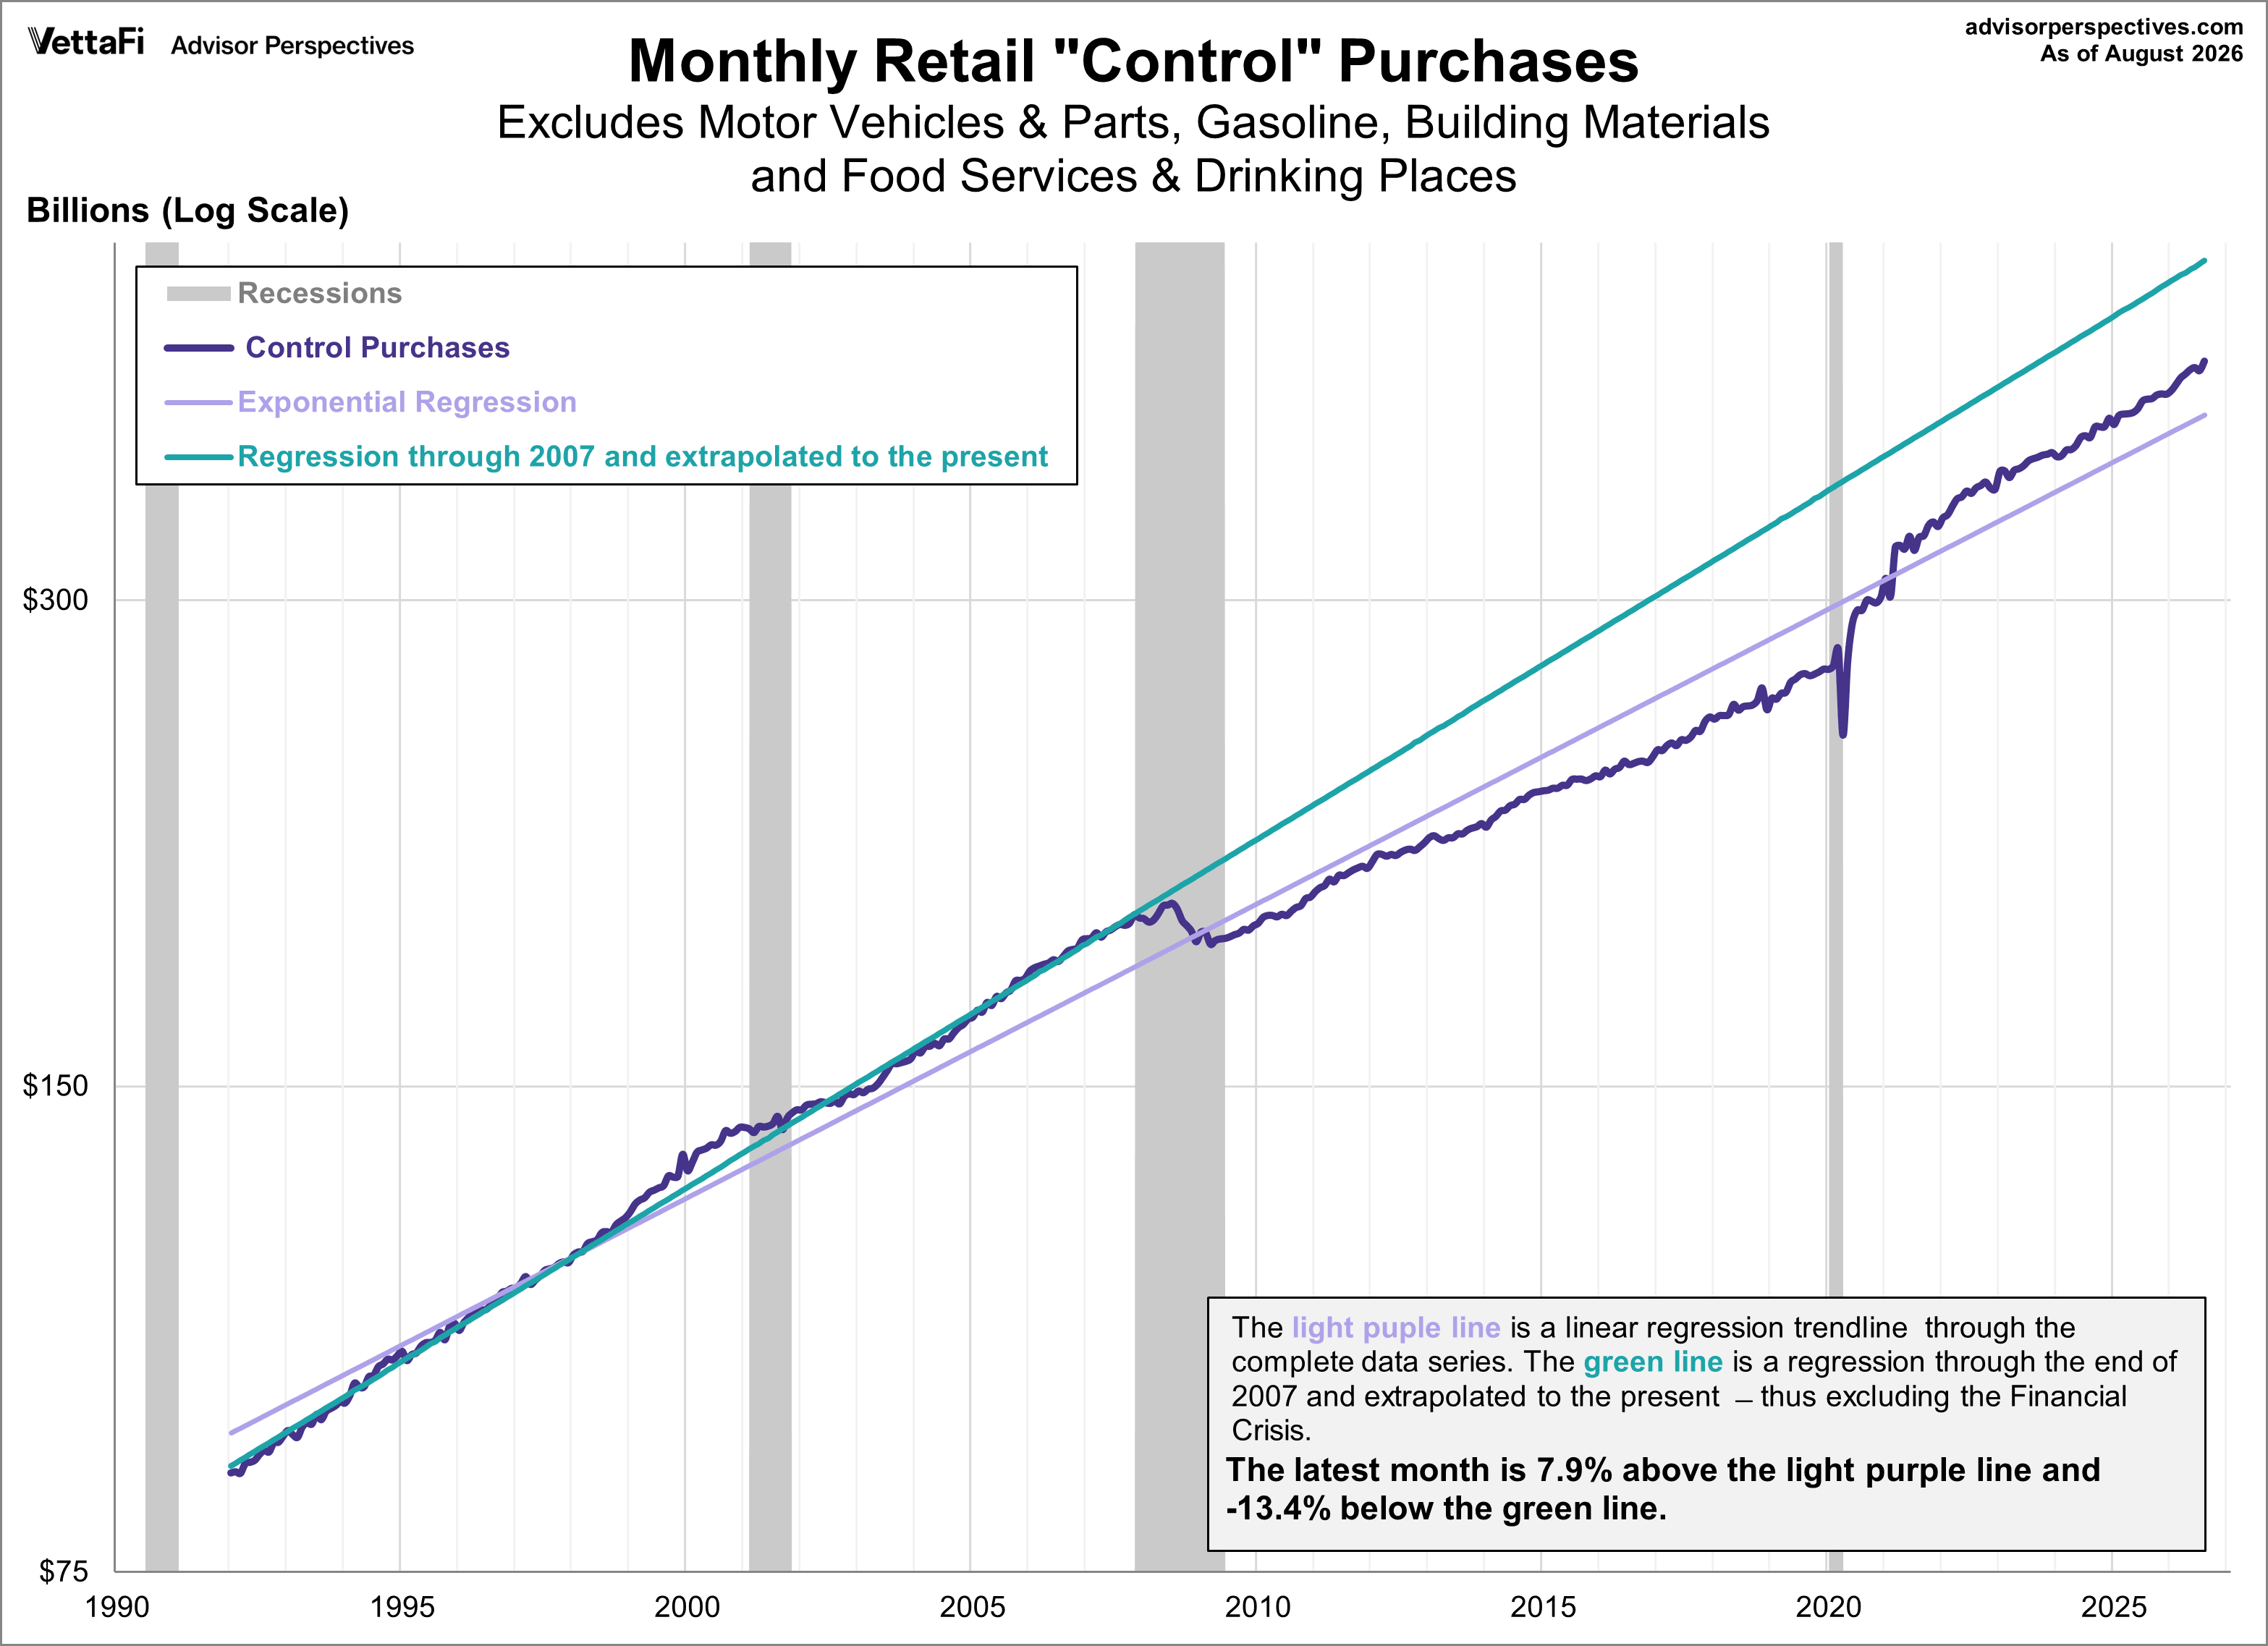
Retail Sales “Control” Purchases
To find the true signal through the noise of the energy crisis, we look at "Control" purchases, which is an even more "core" view of retail sales. This series is the most reliable reading of the economy as it excludes: motor vehicles & parts, gasoline stations, building materials, food services & drinking places. Retail sales control purchases increased 1.4% in August, up from July's -0.4% decrease.
Similar to the retail sales snapshot chart earlier, the chart below is a log-scale snapshot of control purchases since the early 1990s and includes two of the exponential regressions previously mentioned.
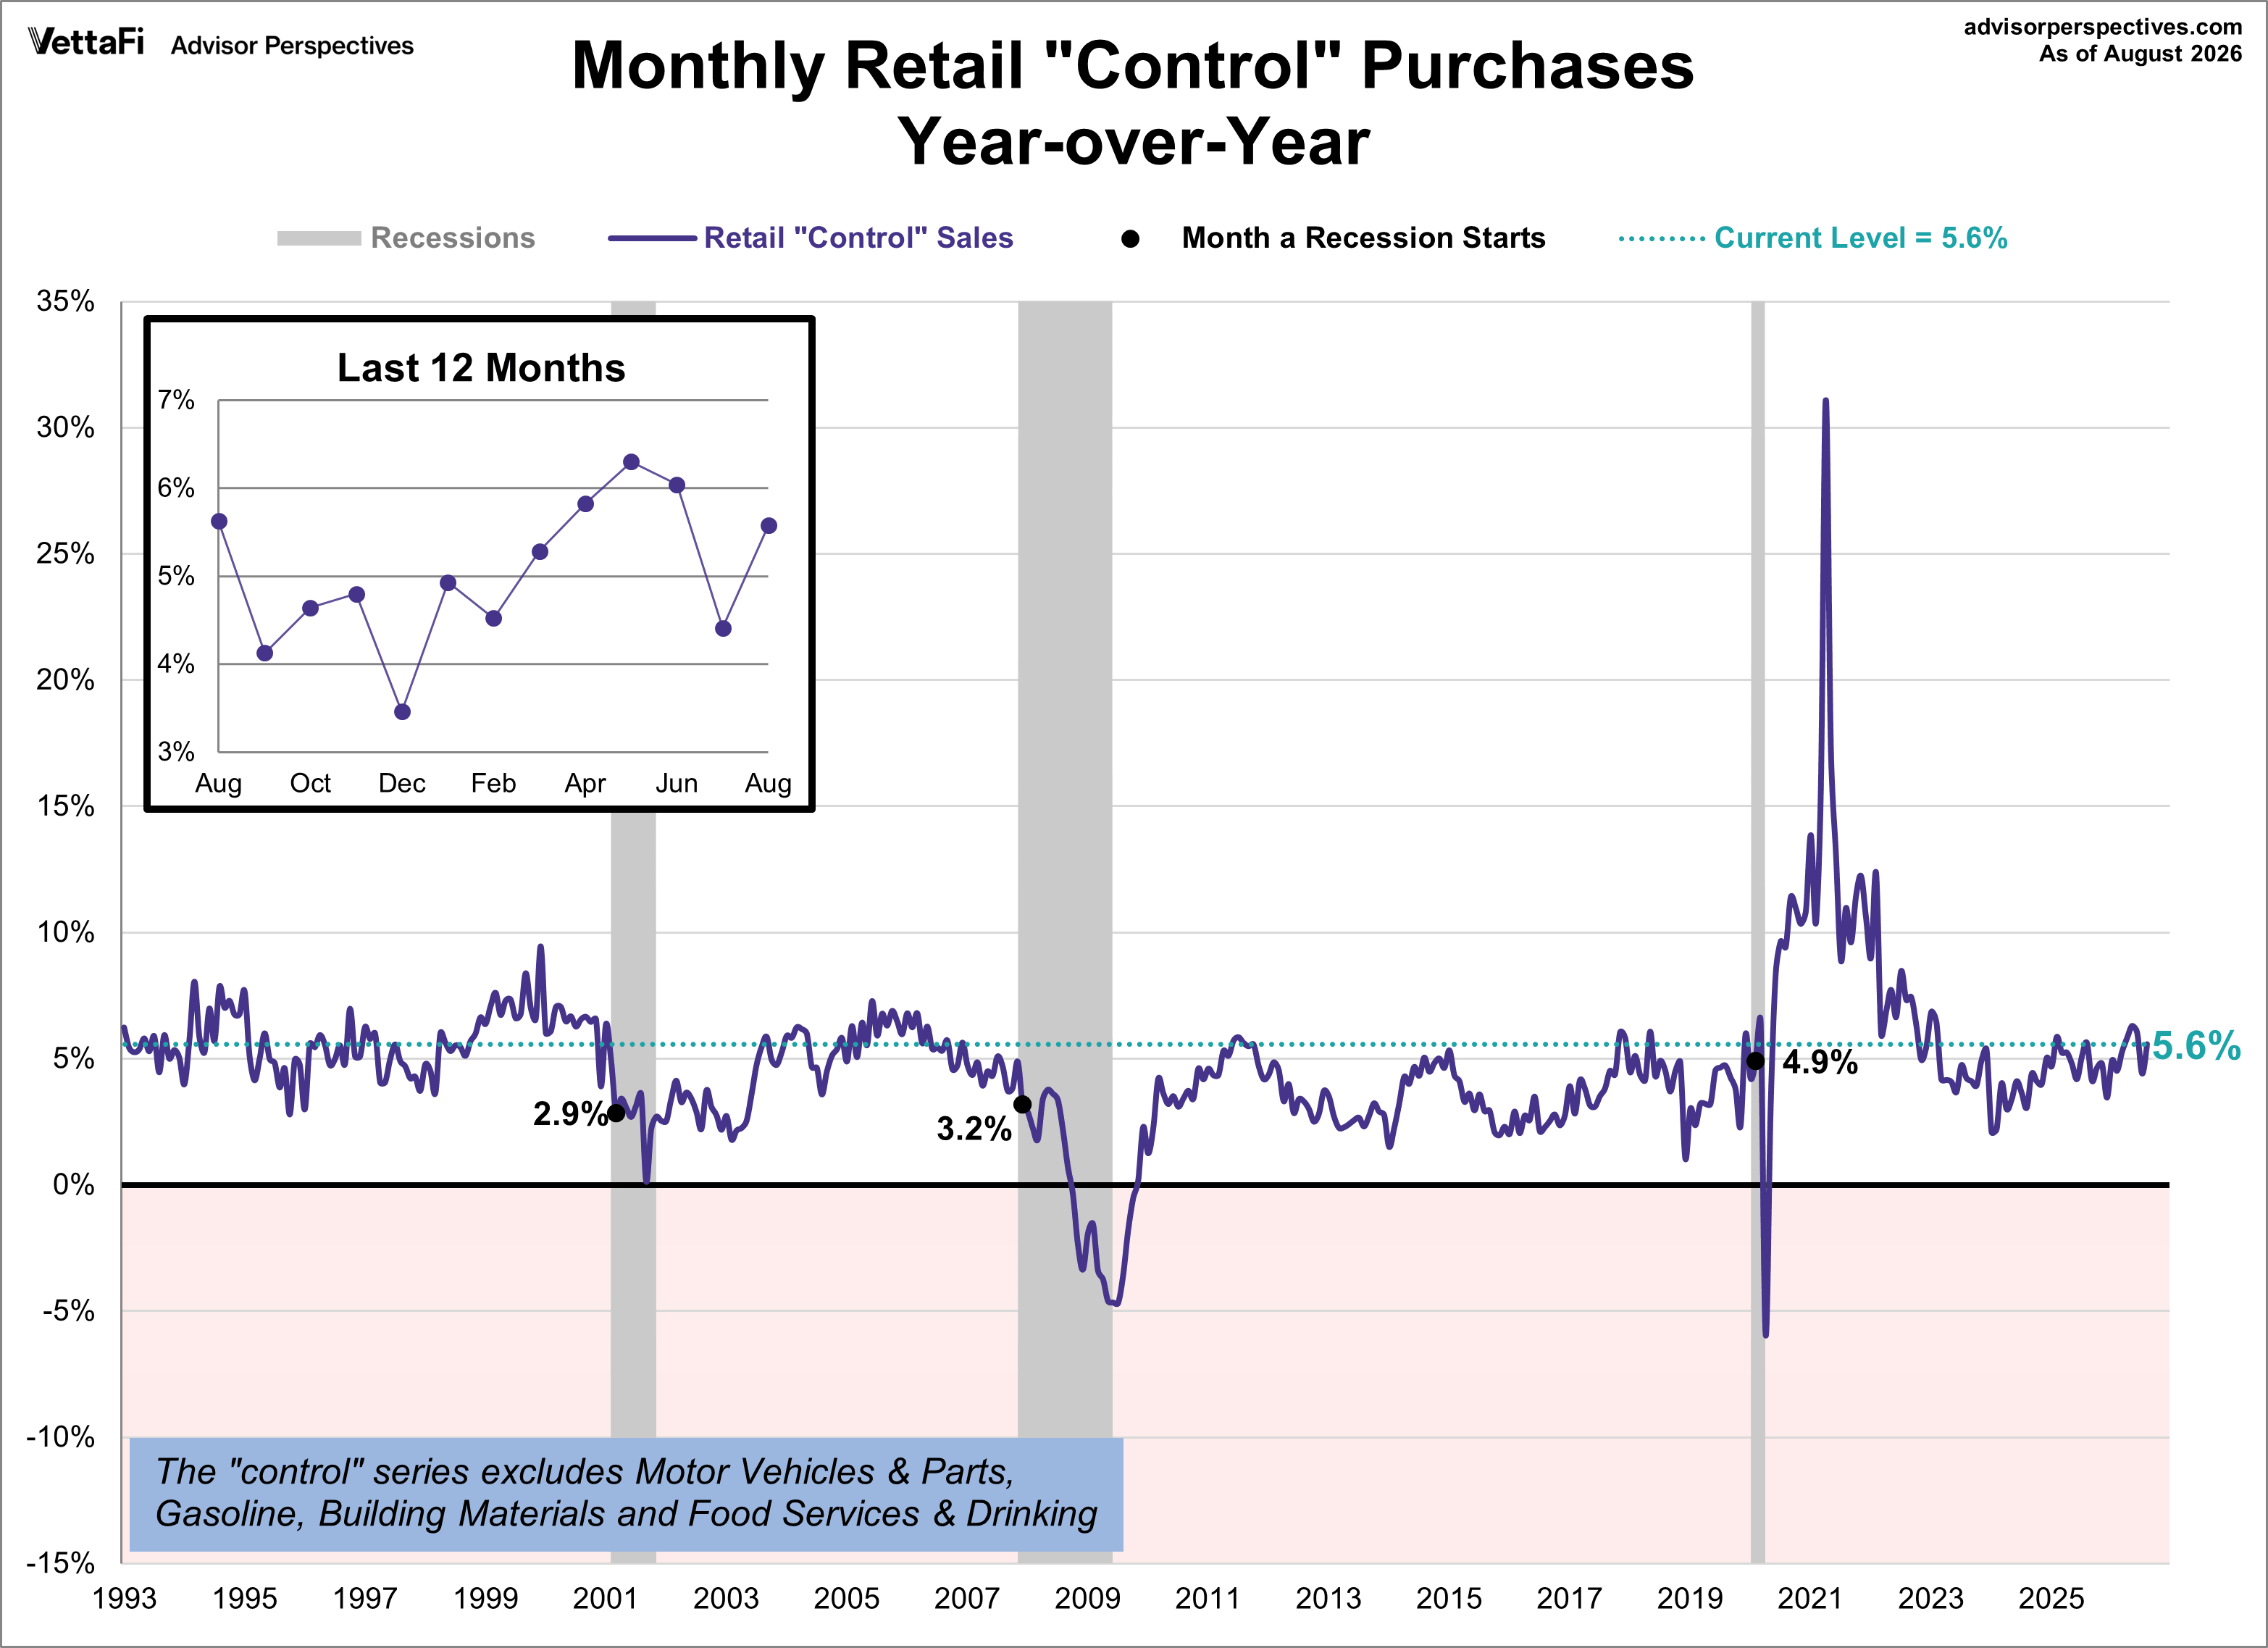
Current control purchases are up 5.6% compared to one year ago.
As shown in the chart below, the "control" series offers a much smoother, less volatile view of consumer health compared to the headline data, which is currently being whipped around by geopolitical instability and energy markets. Note that the two series follow each other closely, but headline sales have more extreme highs and lows than the control series.
Retail ETFs
Retail sales will impact interest in the SPDR S&P Retail ETF (XRT), VanEck Retail ETF (RTH), Amplify Online Retail ETF (IBUY), and ProShares Online Retail ETF (ONLN).
vettafi.com is owned by VettaFi LLC (“VettaFi”). VettaFi is the index provider for IBUY for which it receives an index licensing fee. However, IBUY is not issued, sponsored, endorsed, or sold by VettaFi. VettaFi has no obligation or liability in connection with the issuance, administration, marketing, or trading of IBUY.
More Factor-Based Investing Topics >