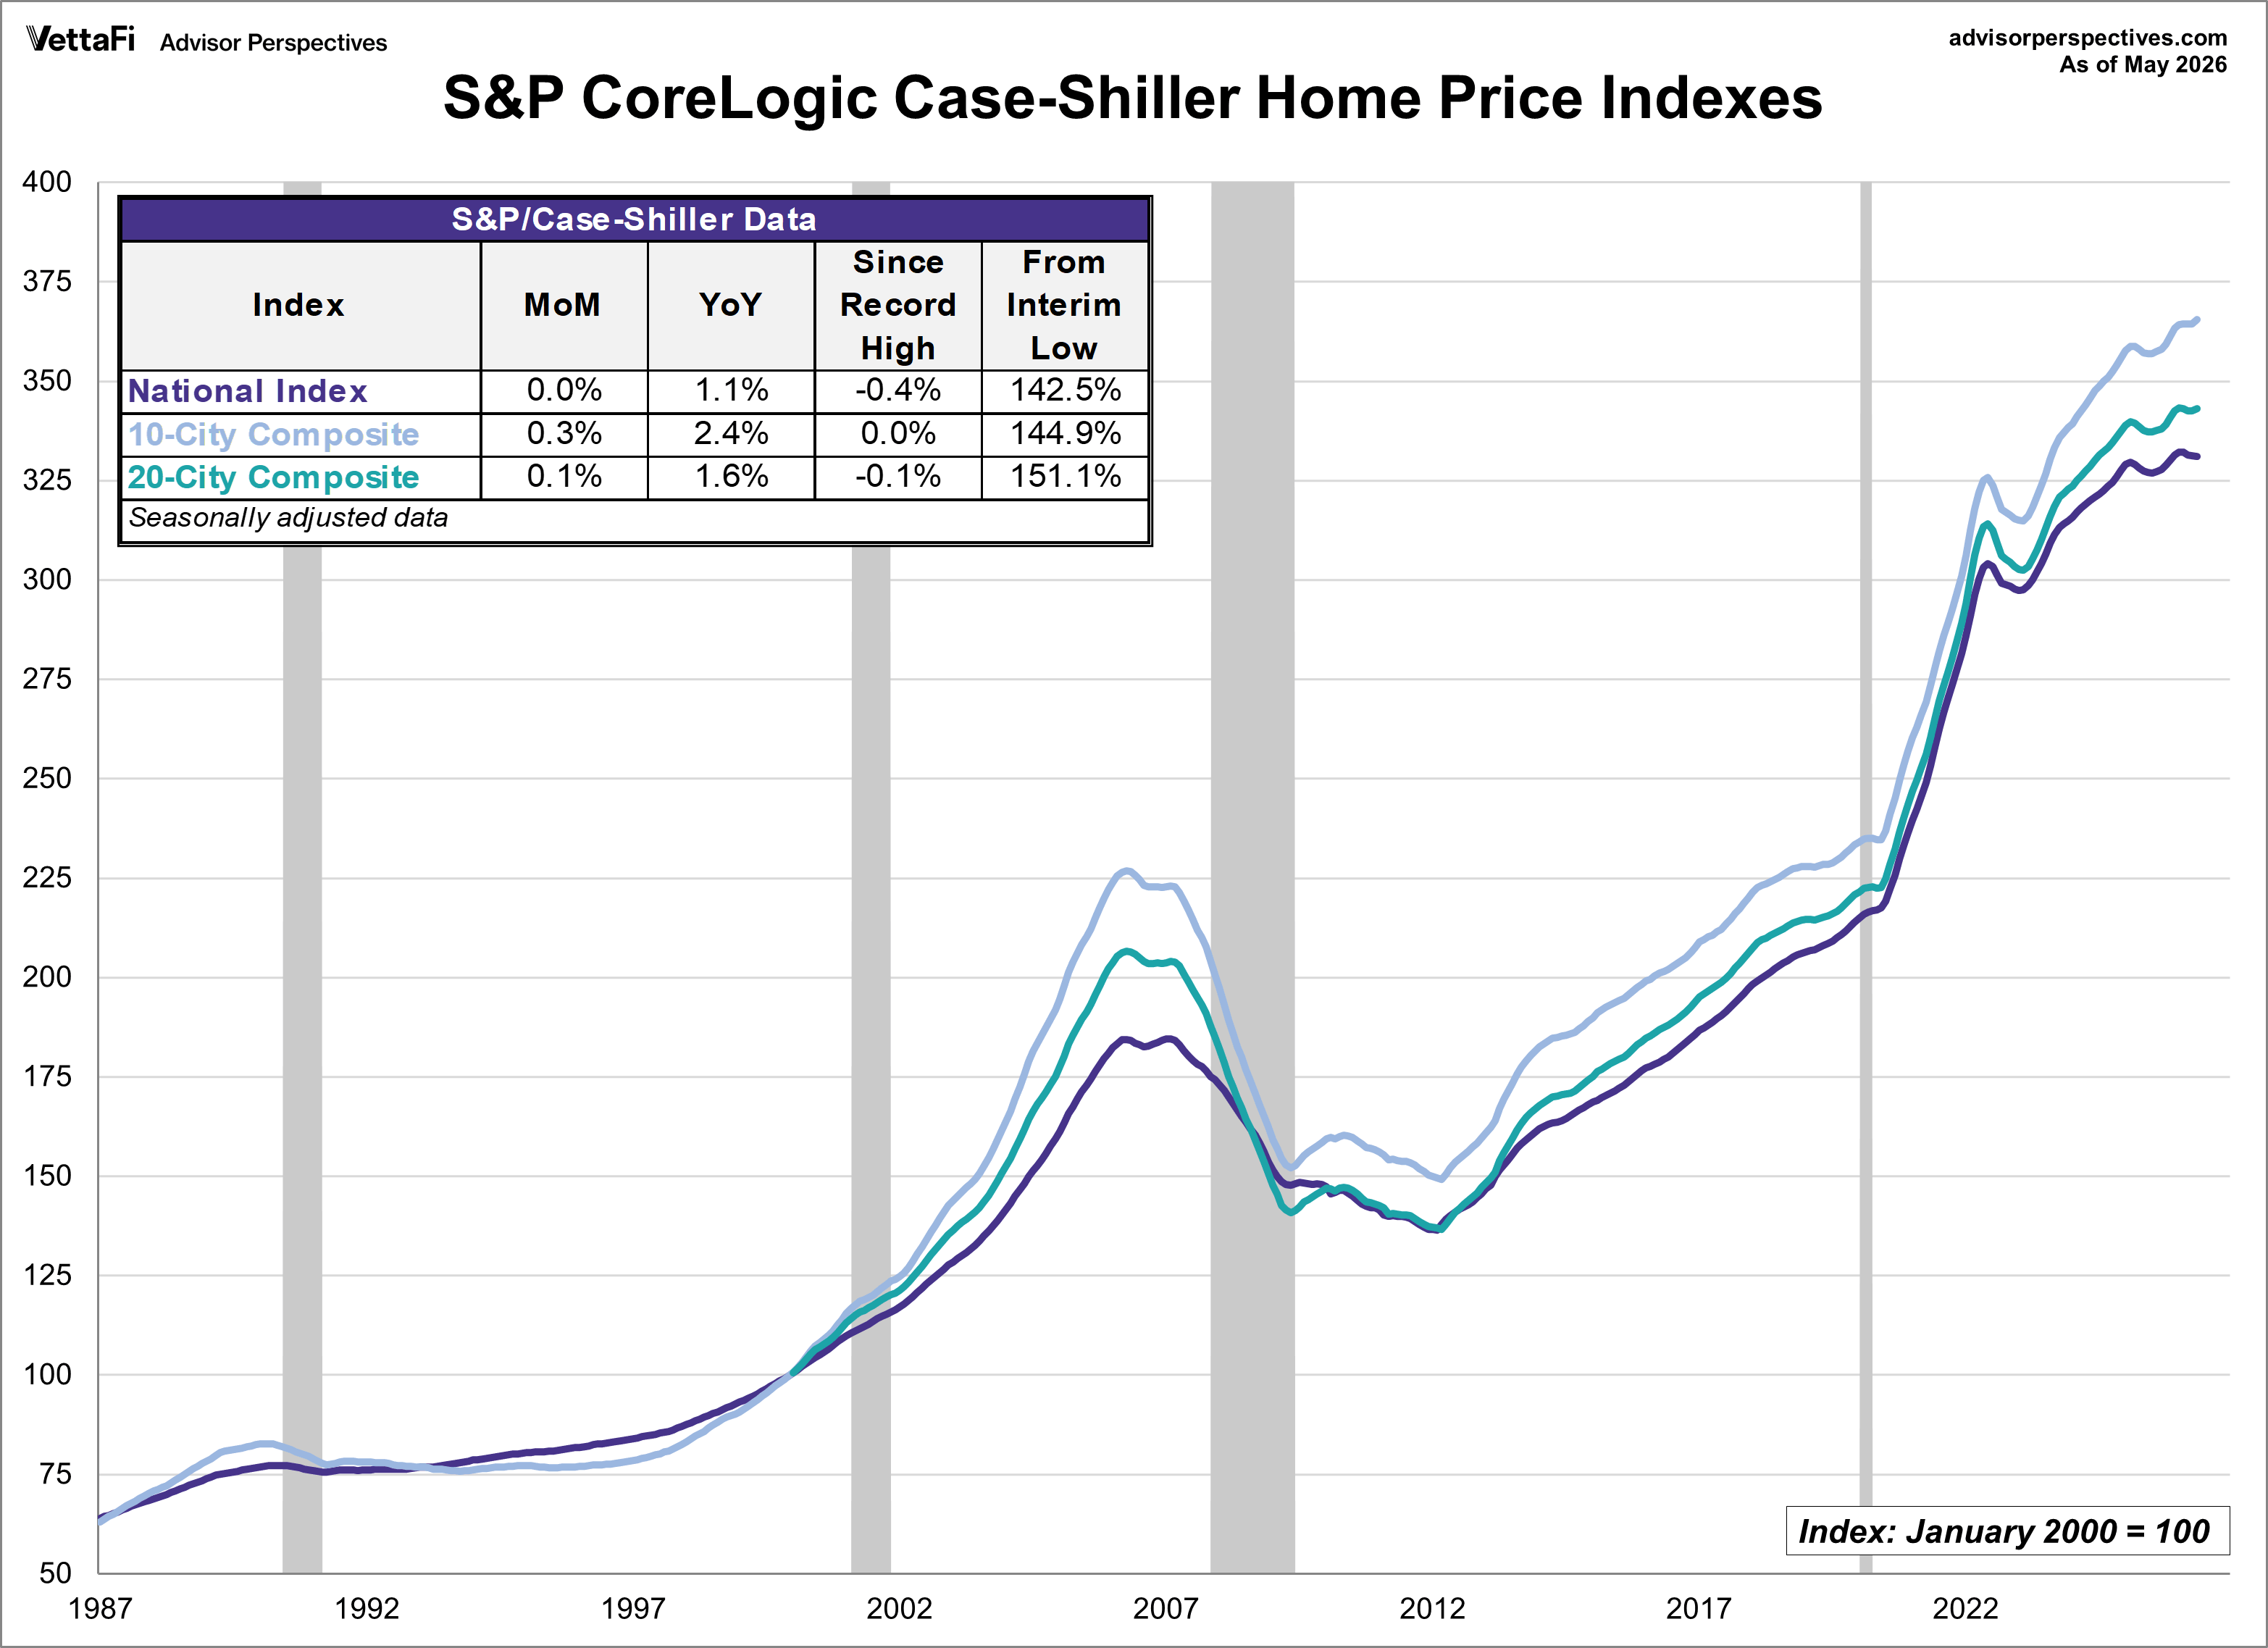
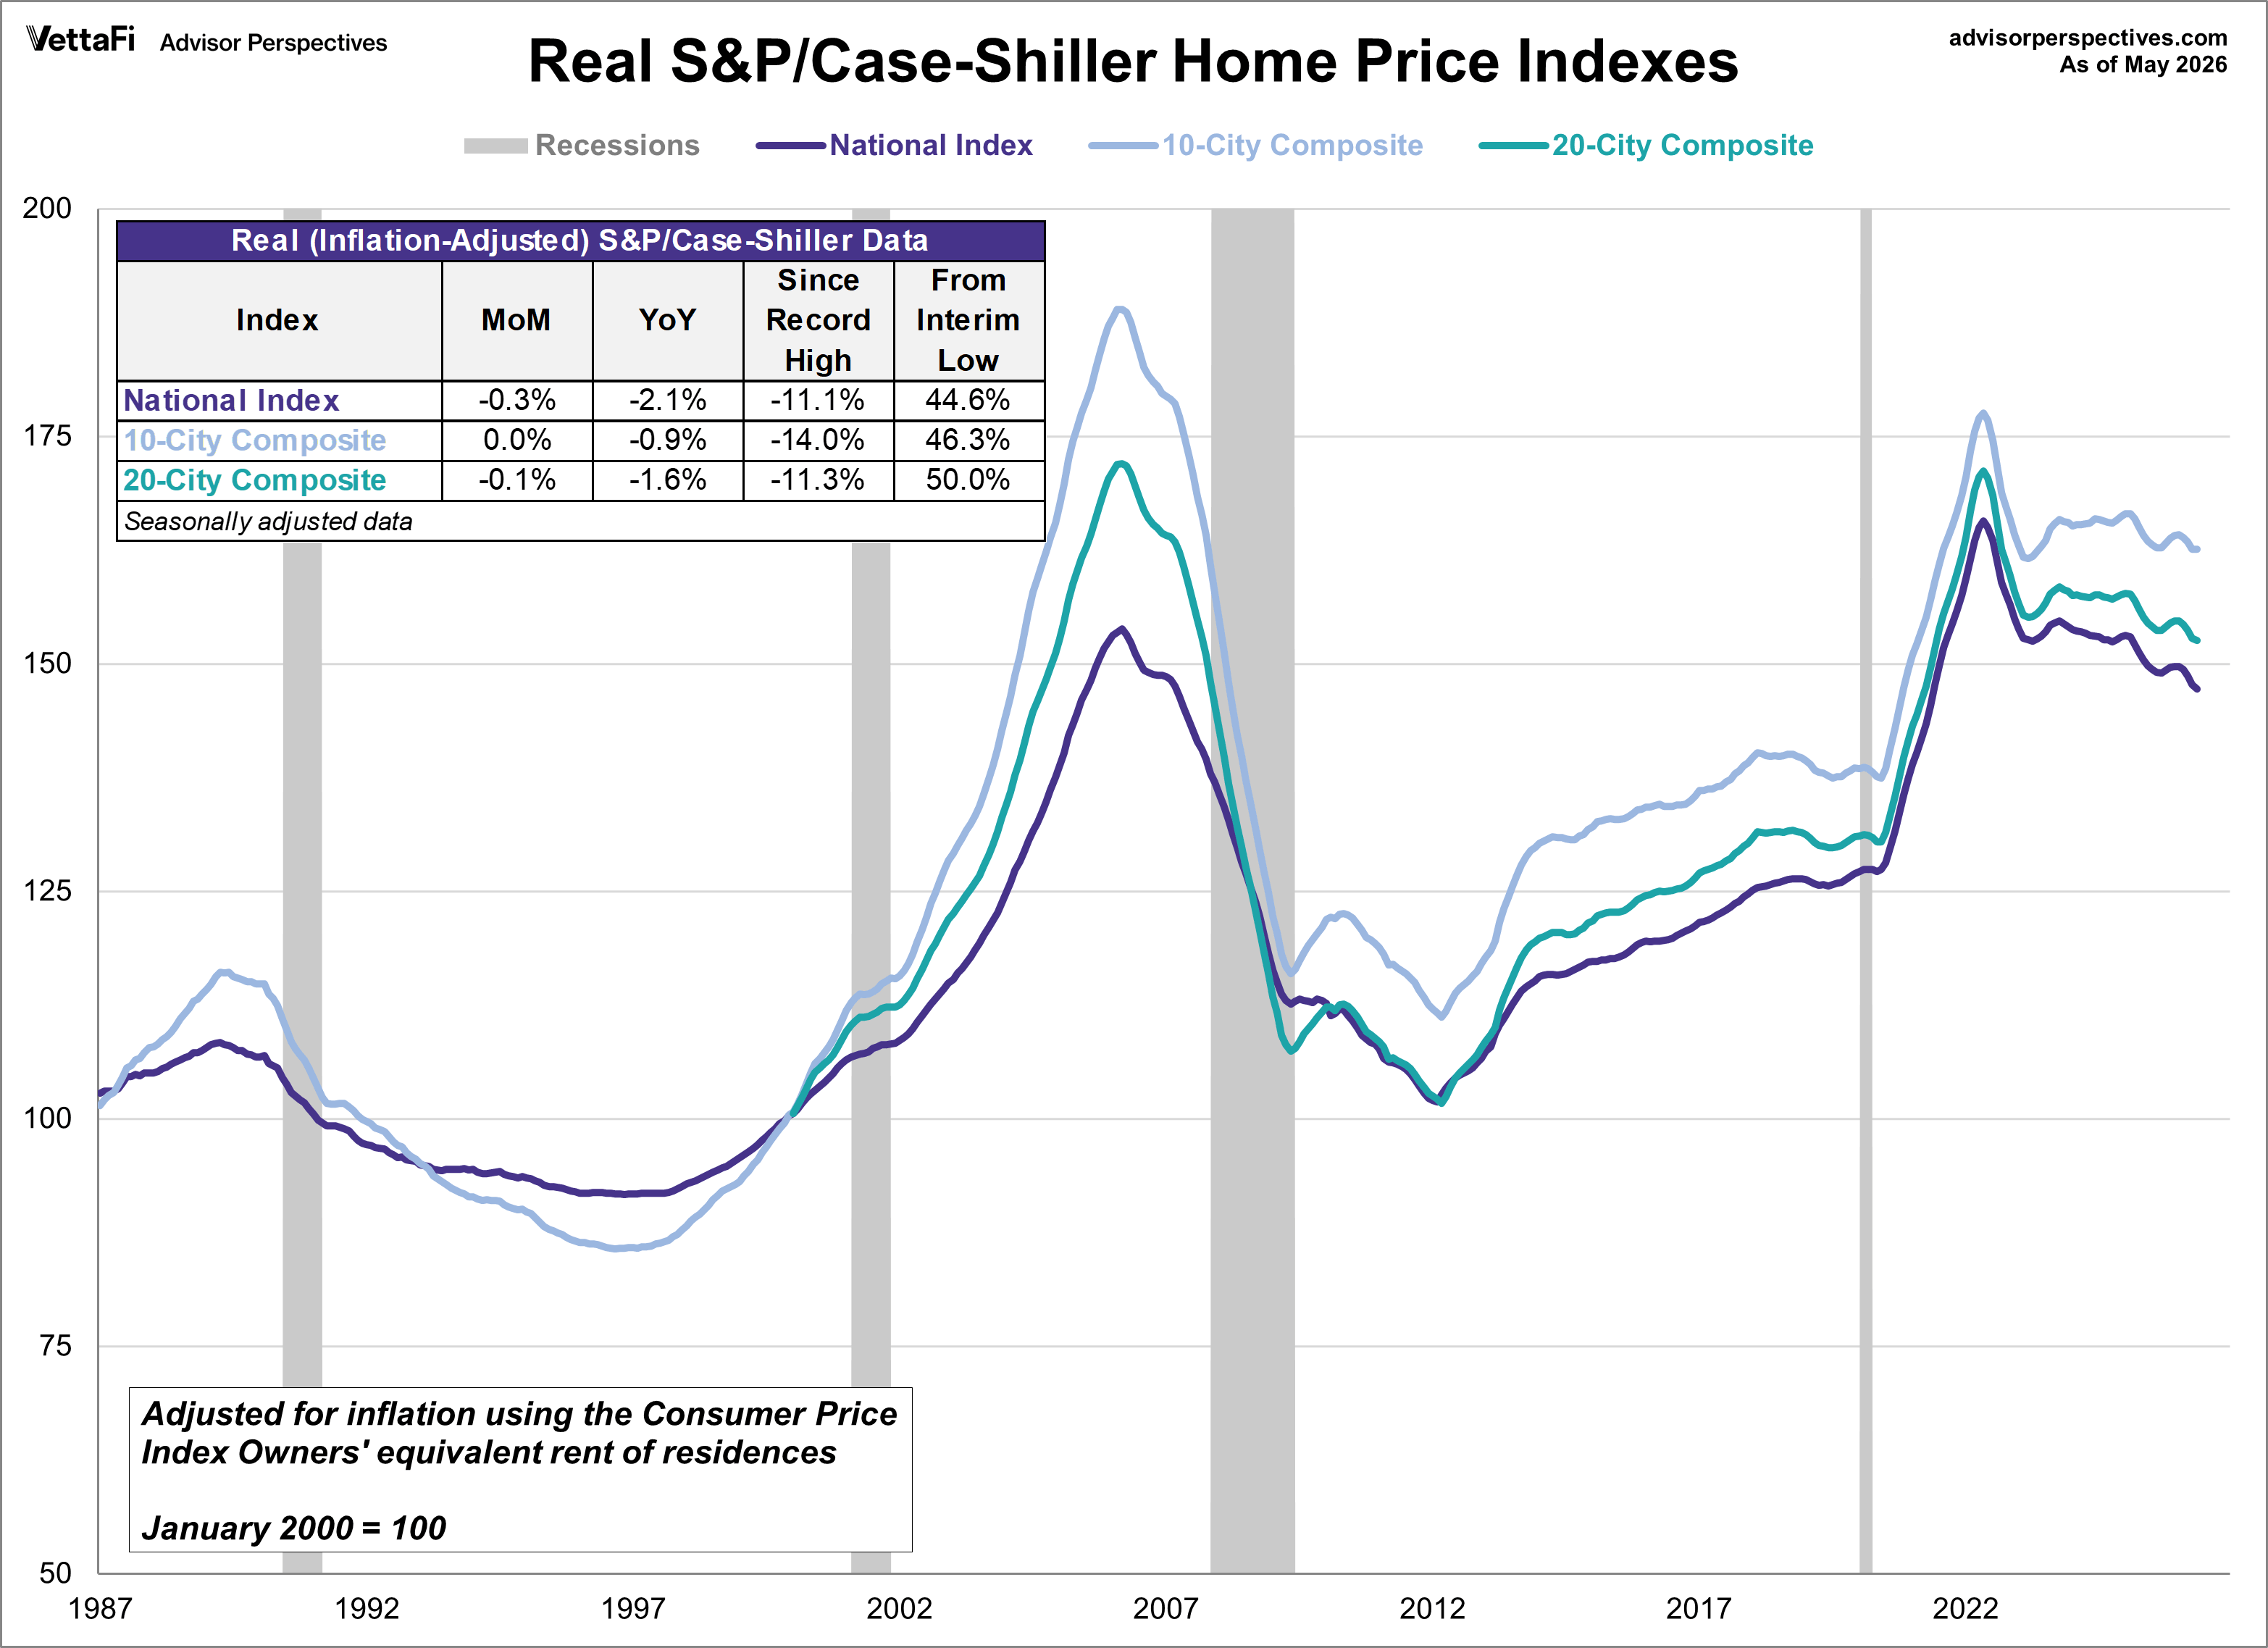
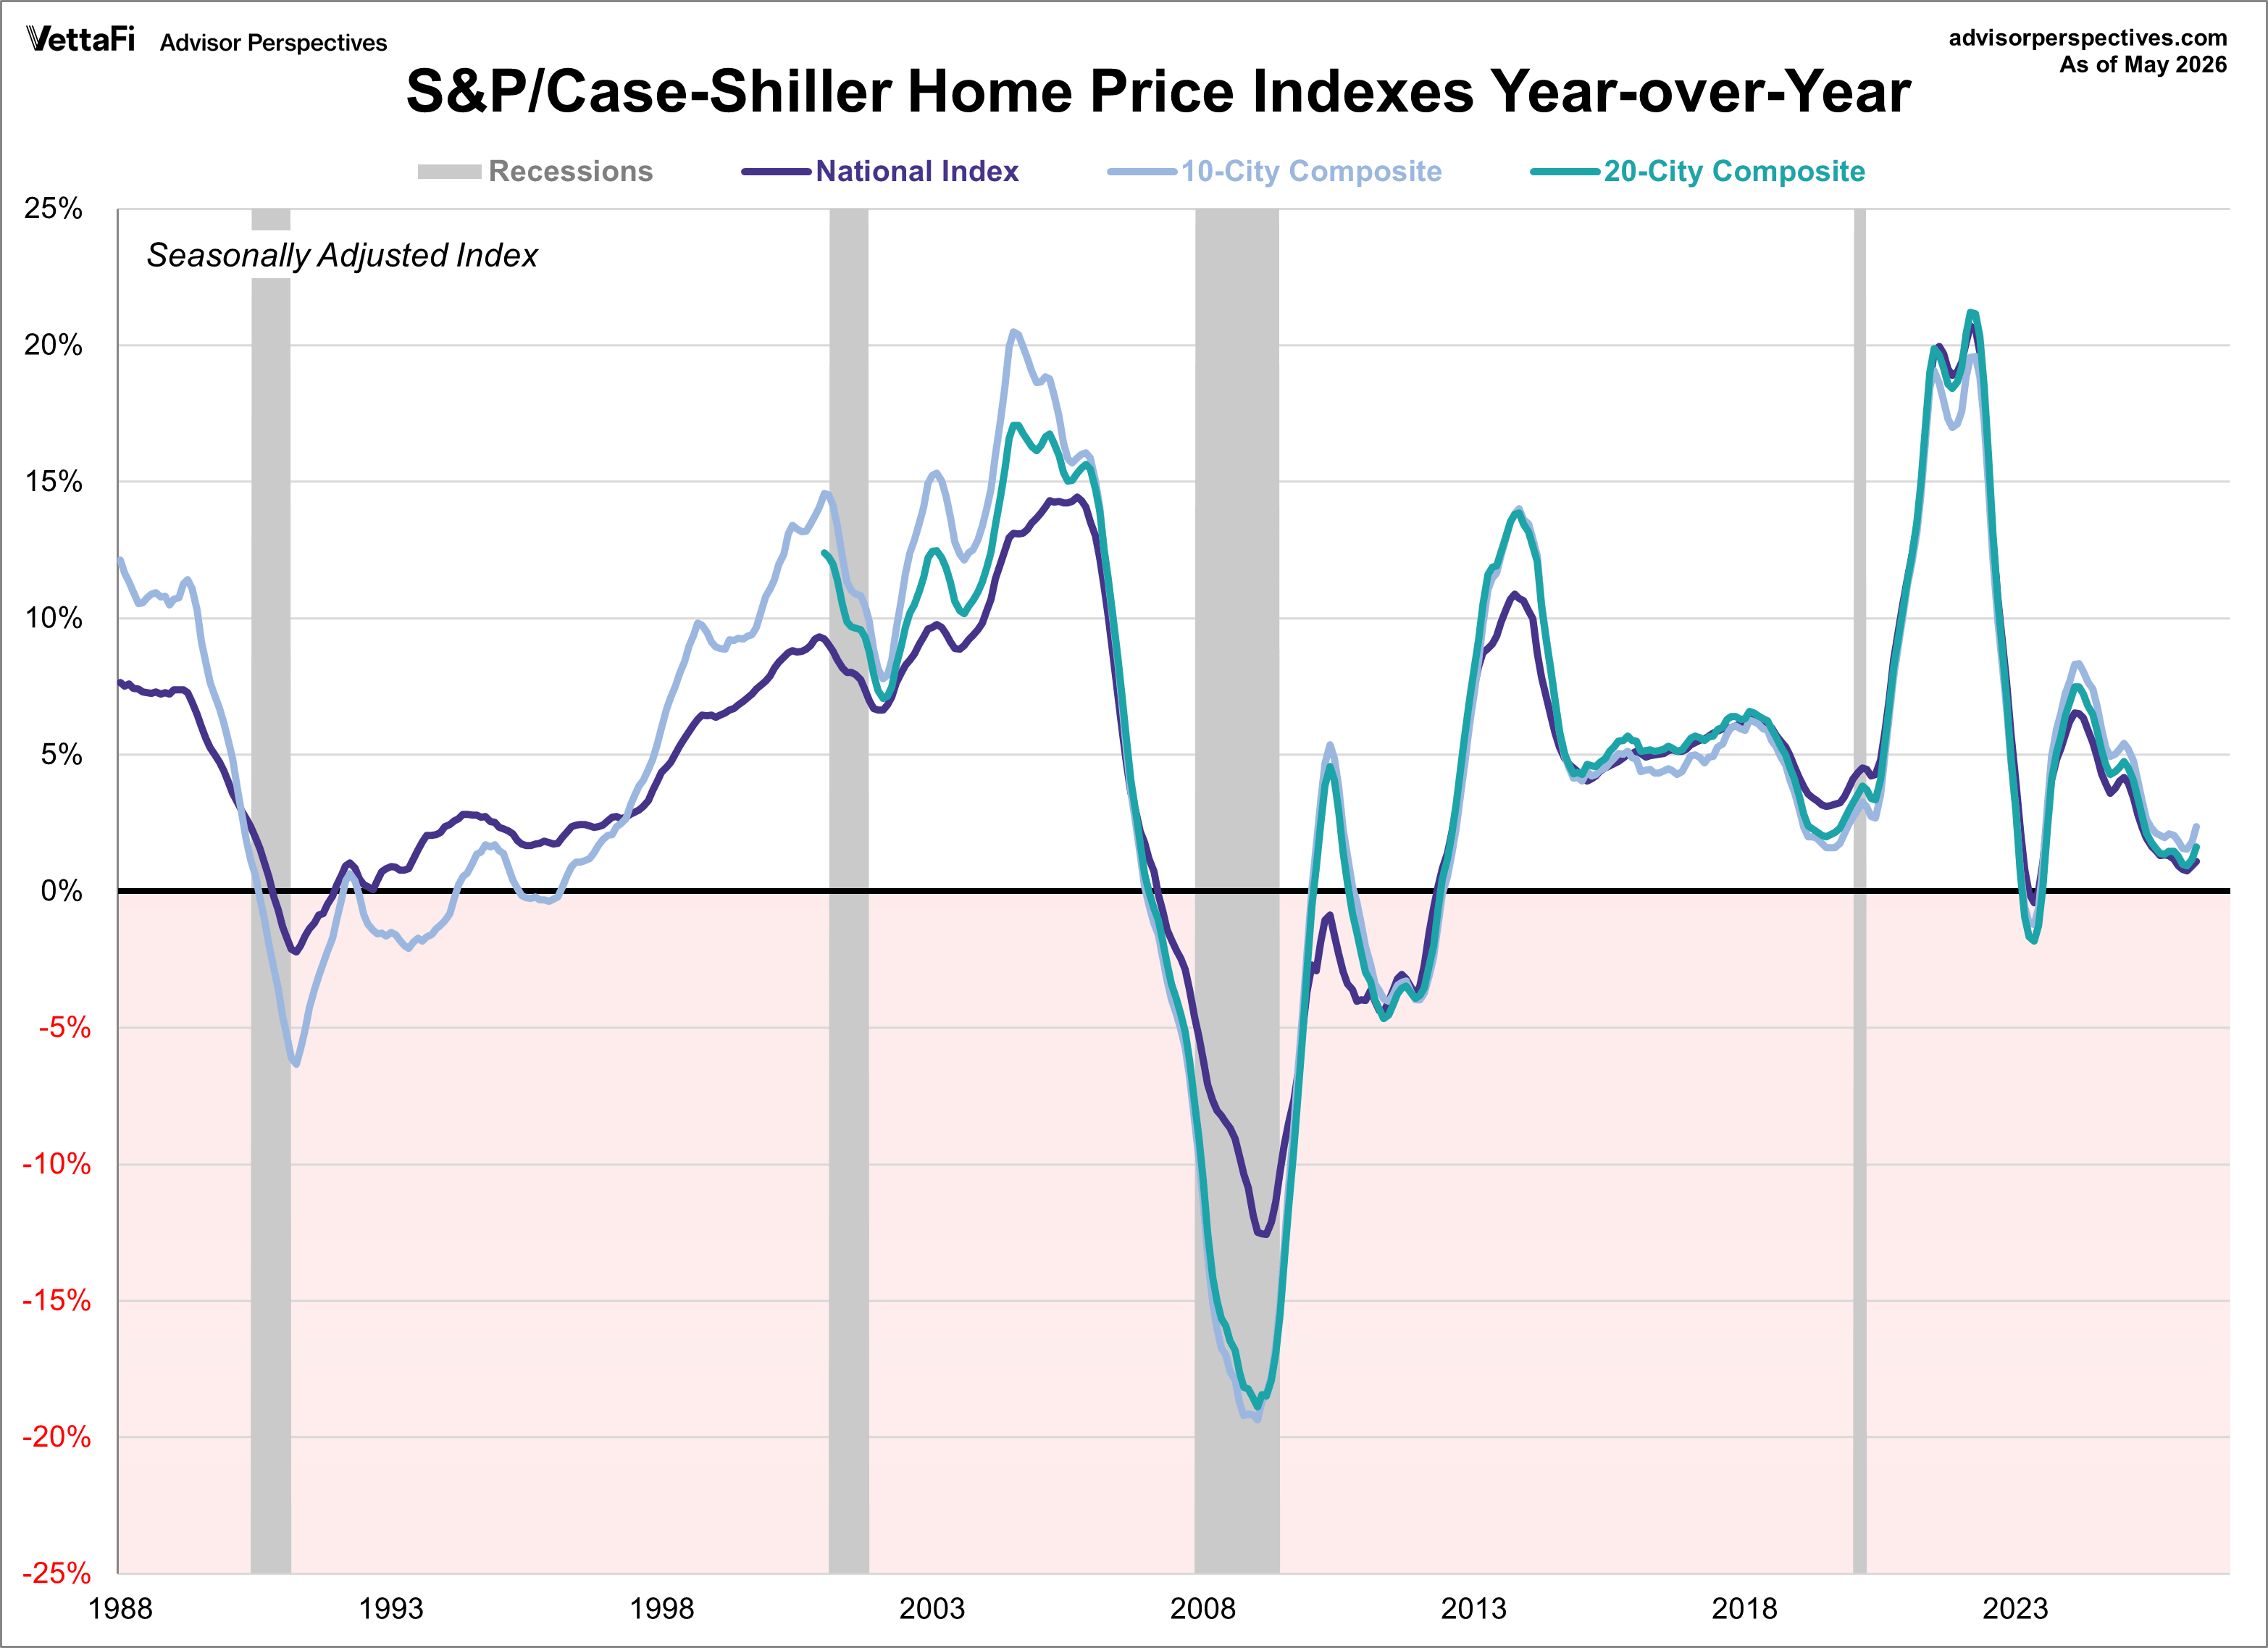
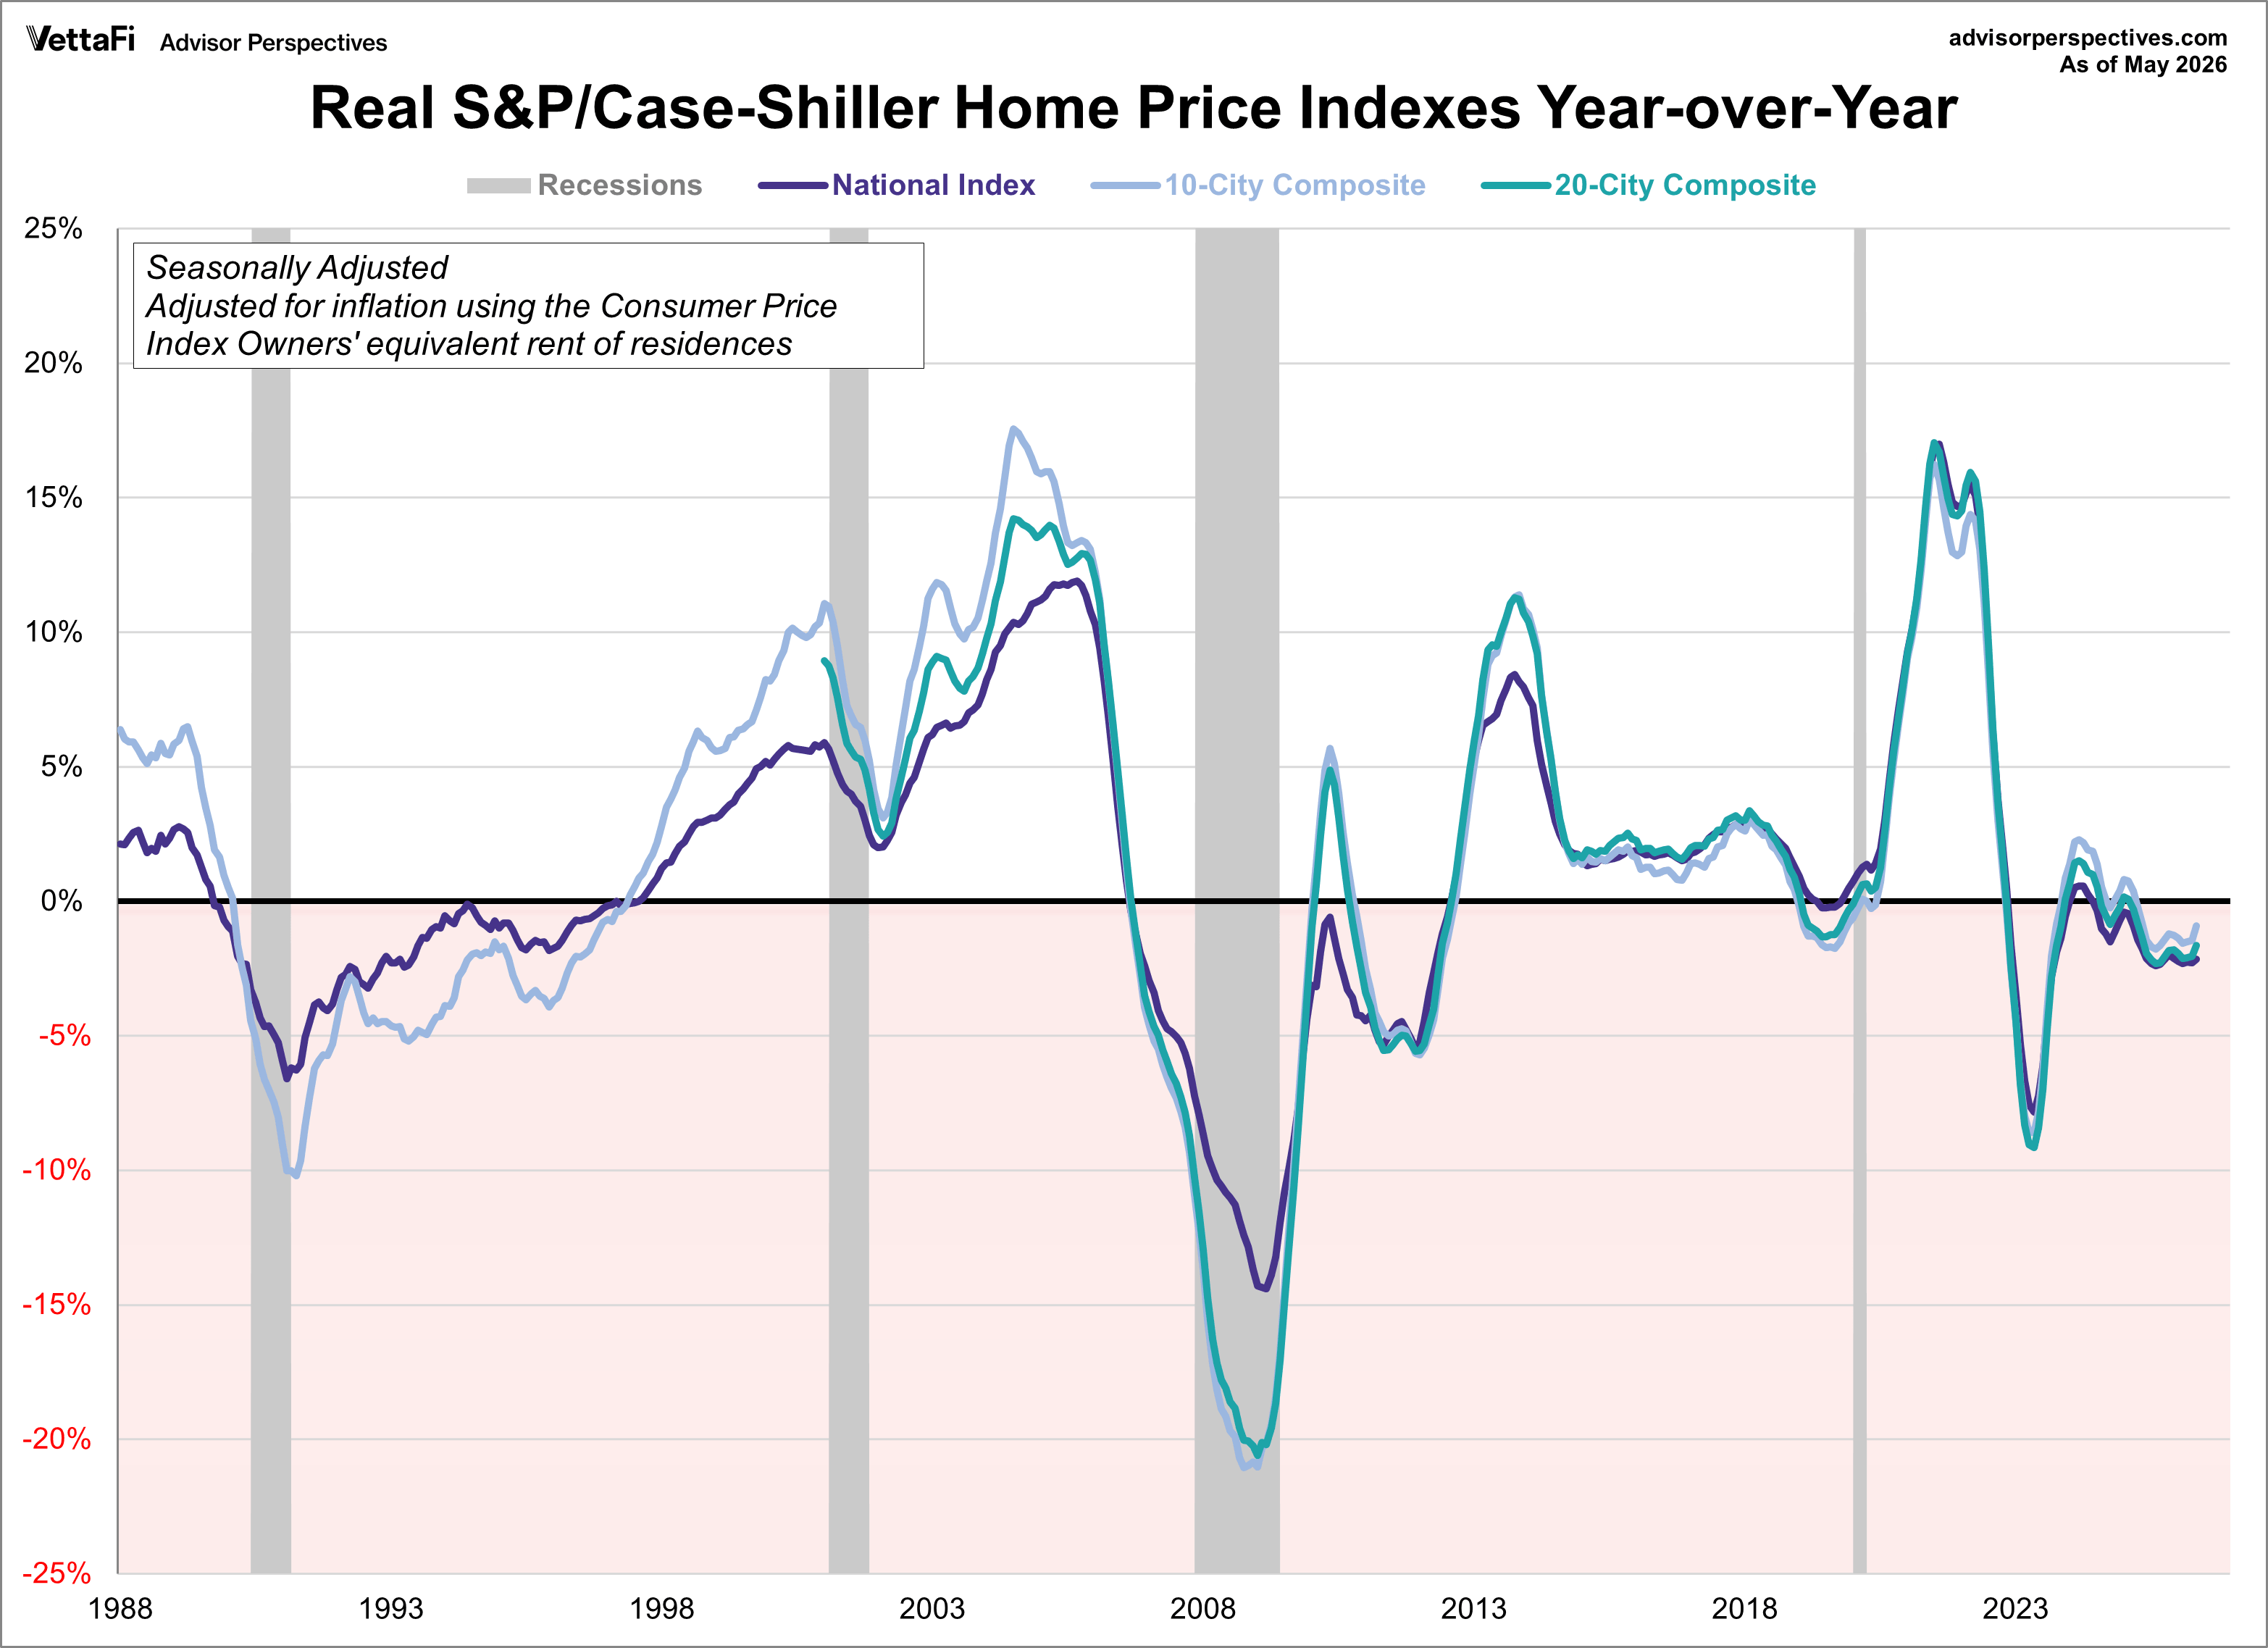
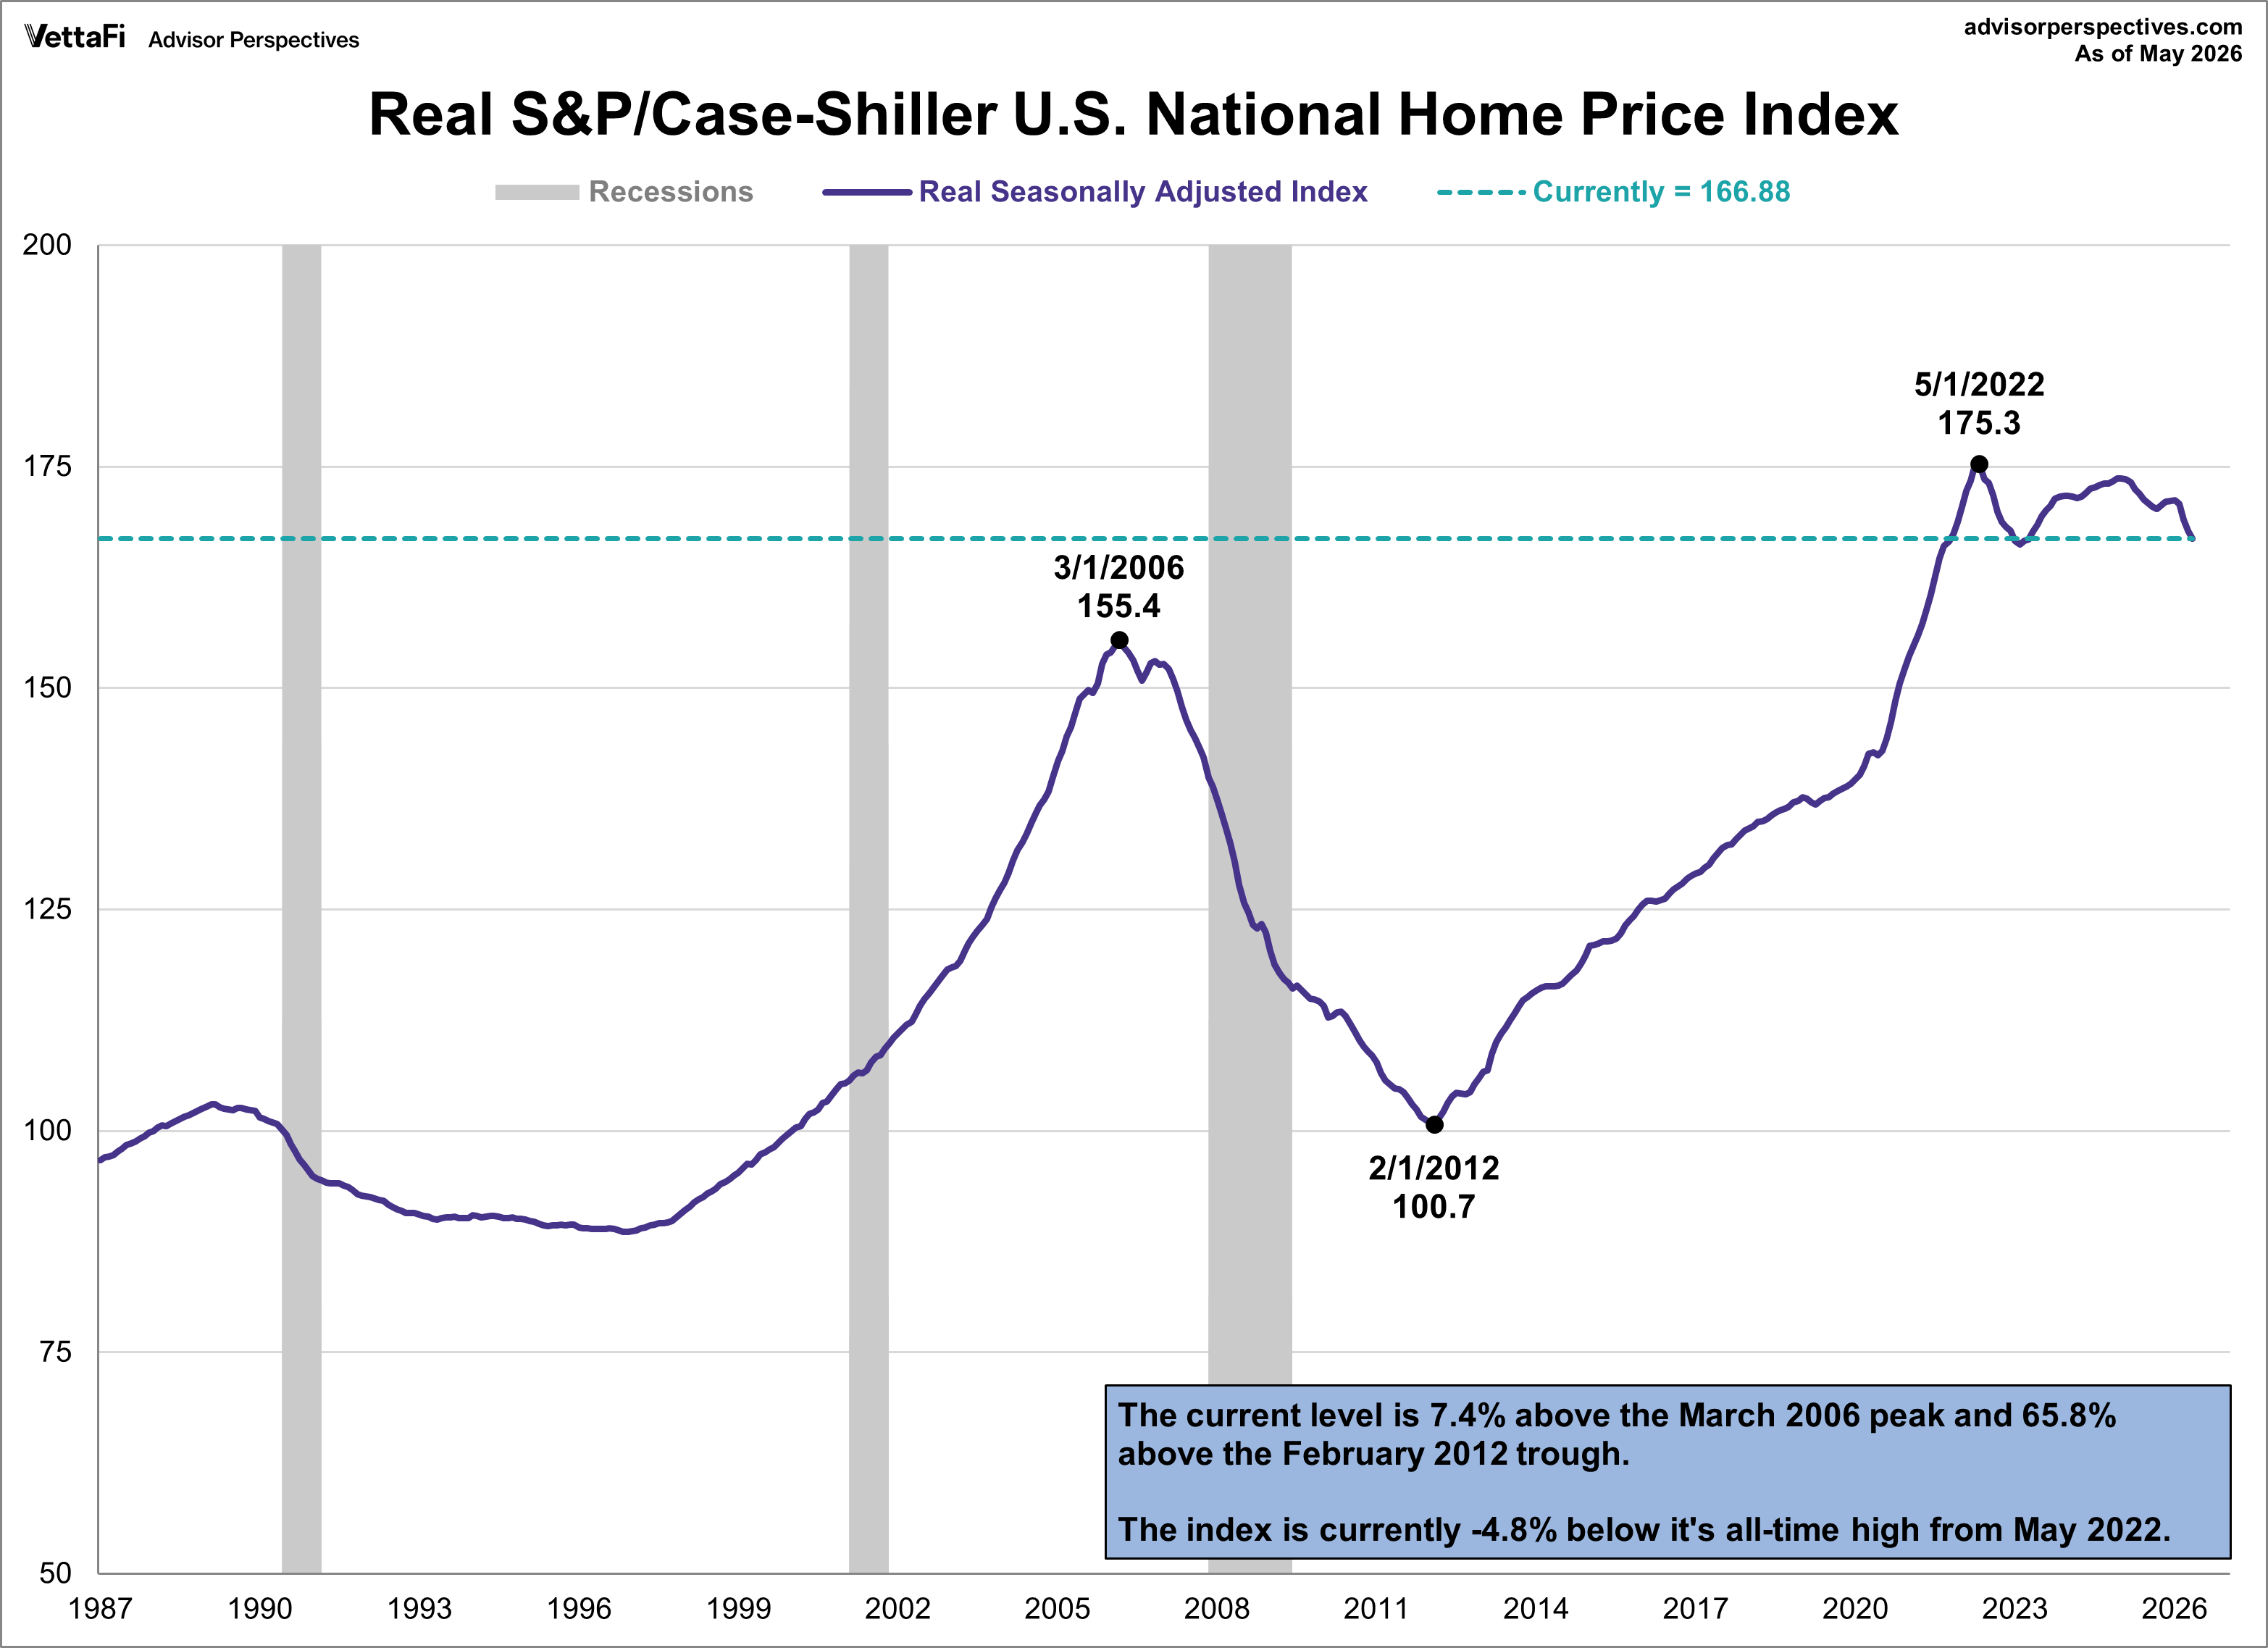
Home prices fell for a third straight month in May according to the S&P Cotality Case-Shiller index, as the housing slowdown continues. On a seasonally adjusted basis, the national index was essentially flat month-over-month and was up 1.1% year-over-year. After adjusting for inflation, the monthly change fell to -0.3% and the annual change fell to -2.1%.
Key Takeaways
-
The S&P Case-Shiller National Home Price Index was flat in May on a seasonally adjusted basis.
-
Chicago home prices led major cities with a 6.9% annual gain, while Las Vegas saw the steepest decline at 1.9%.
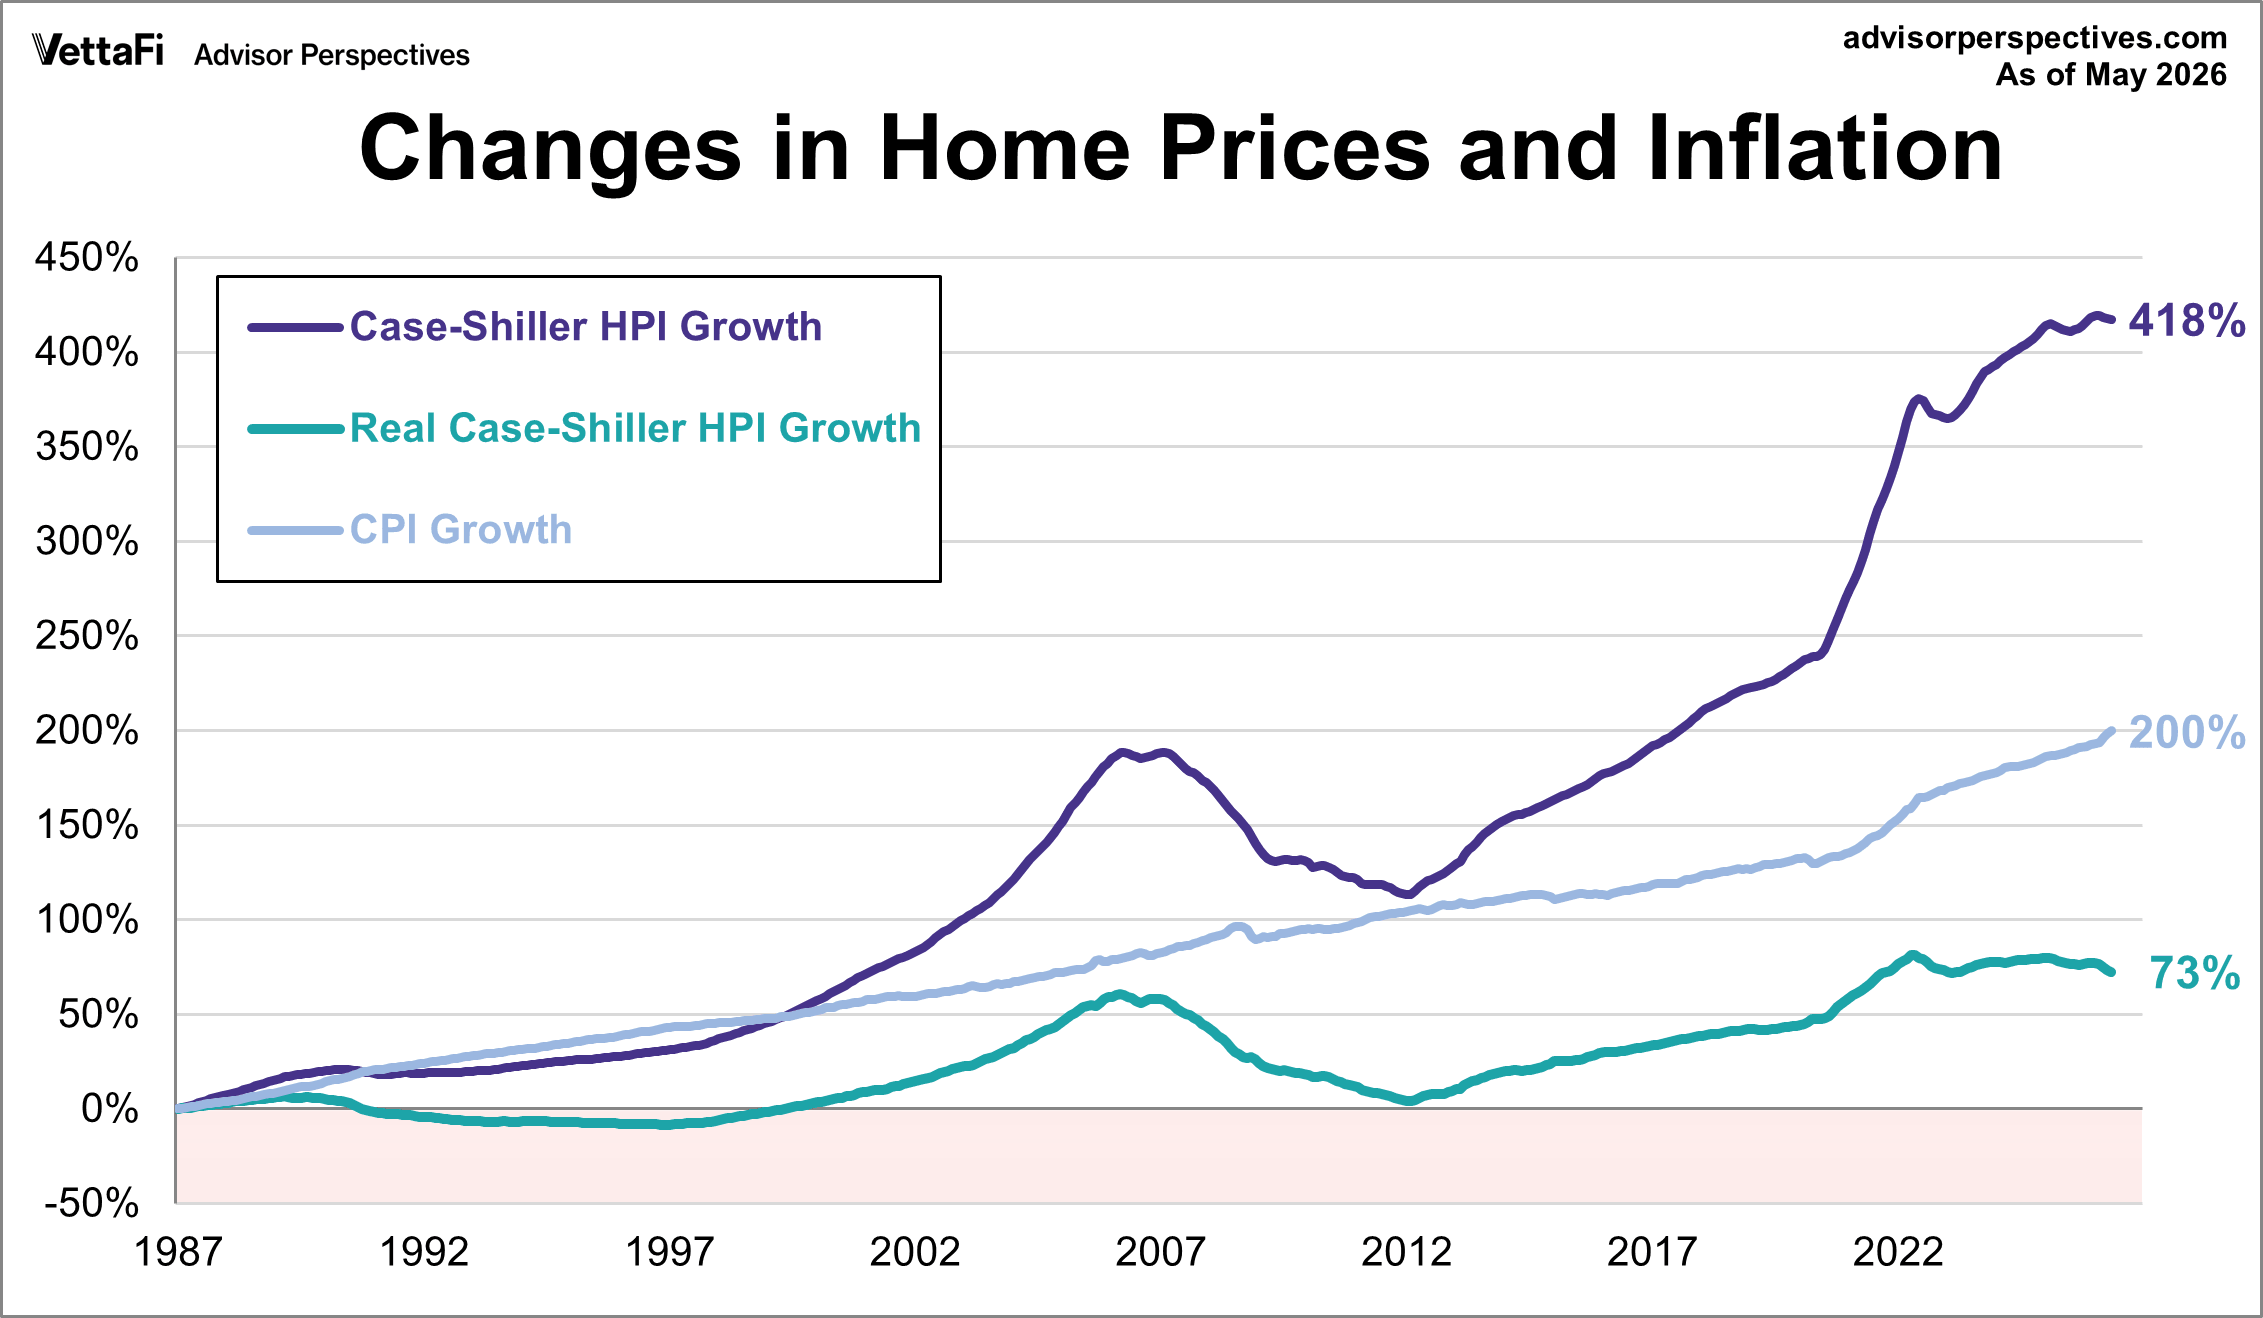
- U.S. home prices have grown 418% since 1987, but only 73% when adjusted for inflation.
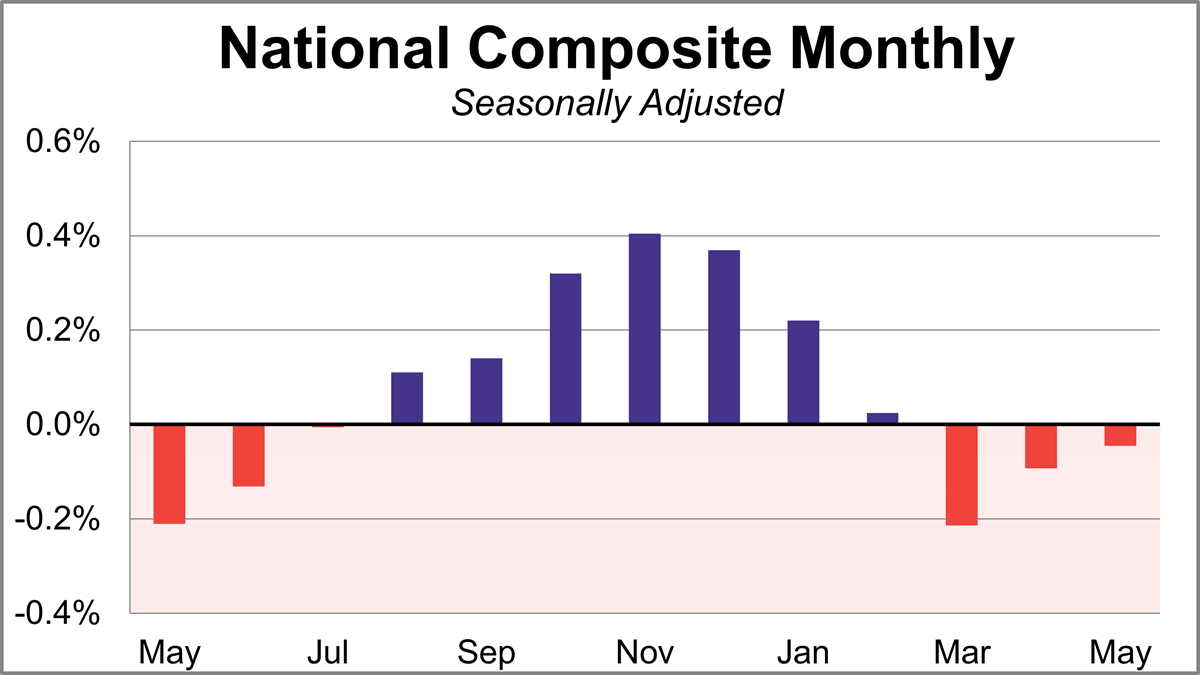
The S&P Case-Shiller benchmark 20-City composite aims to measure the value of residential real estate in the following 20 major U.S. cities: Atlanta, Boston, Charlotte, Chicago, Cleveland, Dallas, Denver, Detroit, Las Vegas, Los Angeles, Miami, Minneapolis, New York, Phoenix, Portland, San Diego, San Francisco, Seattle, Tampa, and Washington D.C.
The benchmark 20-city index rose for the first time in four months in May. The seasonally adjusted home prices for the 20-city index were up 0.1% month-over-month and saw a 1.6% increase year-over-year. After adjusting for inflation, the monthly change was reduced to -0.1% and the annual change fell to -1.6%.
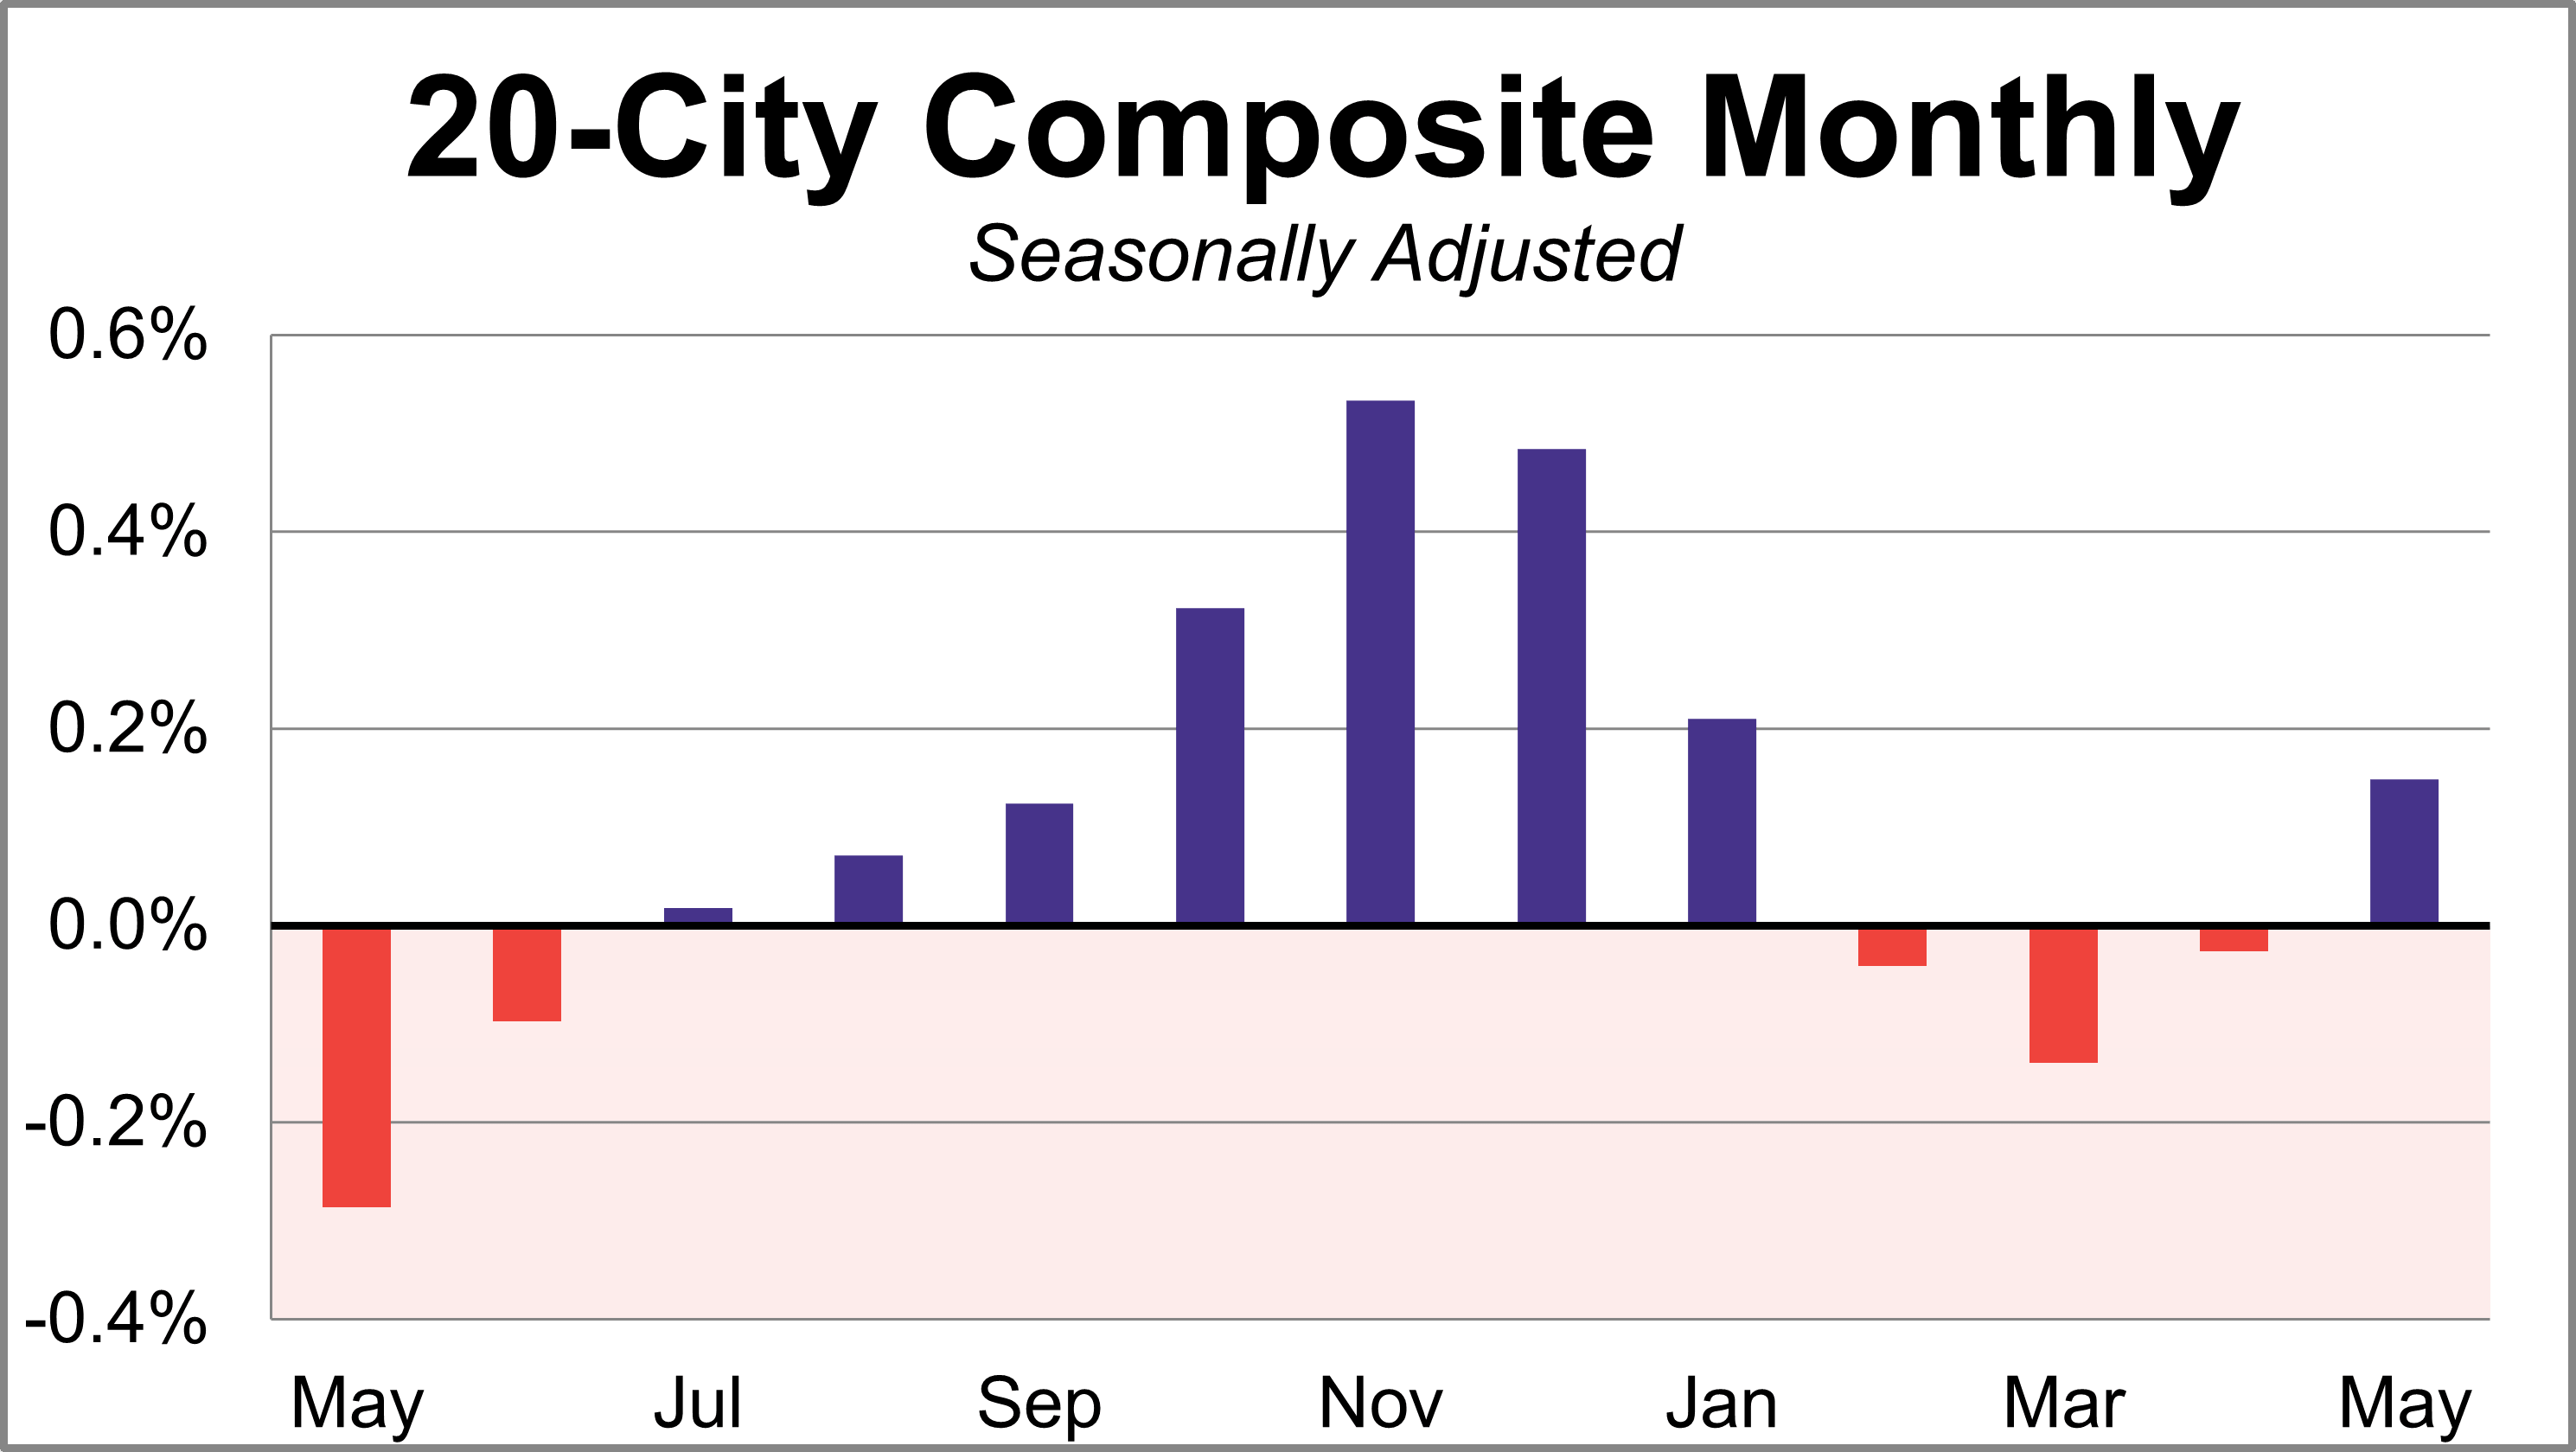
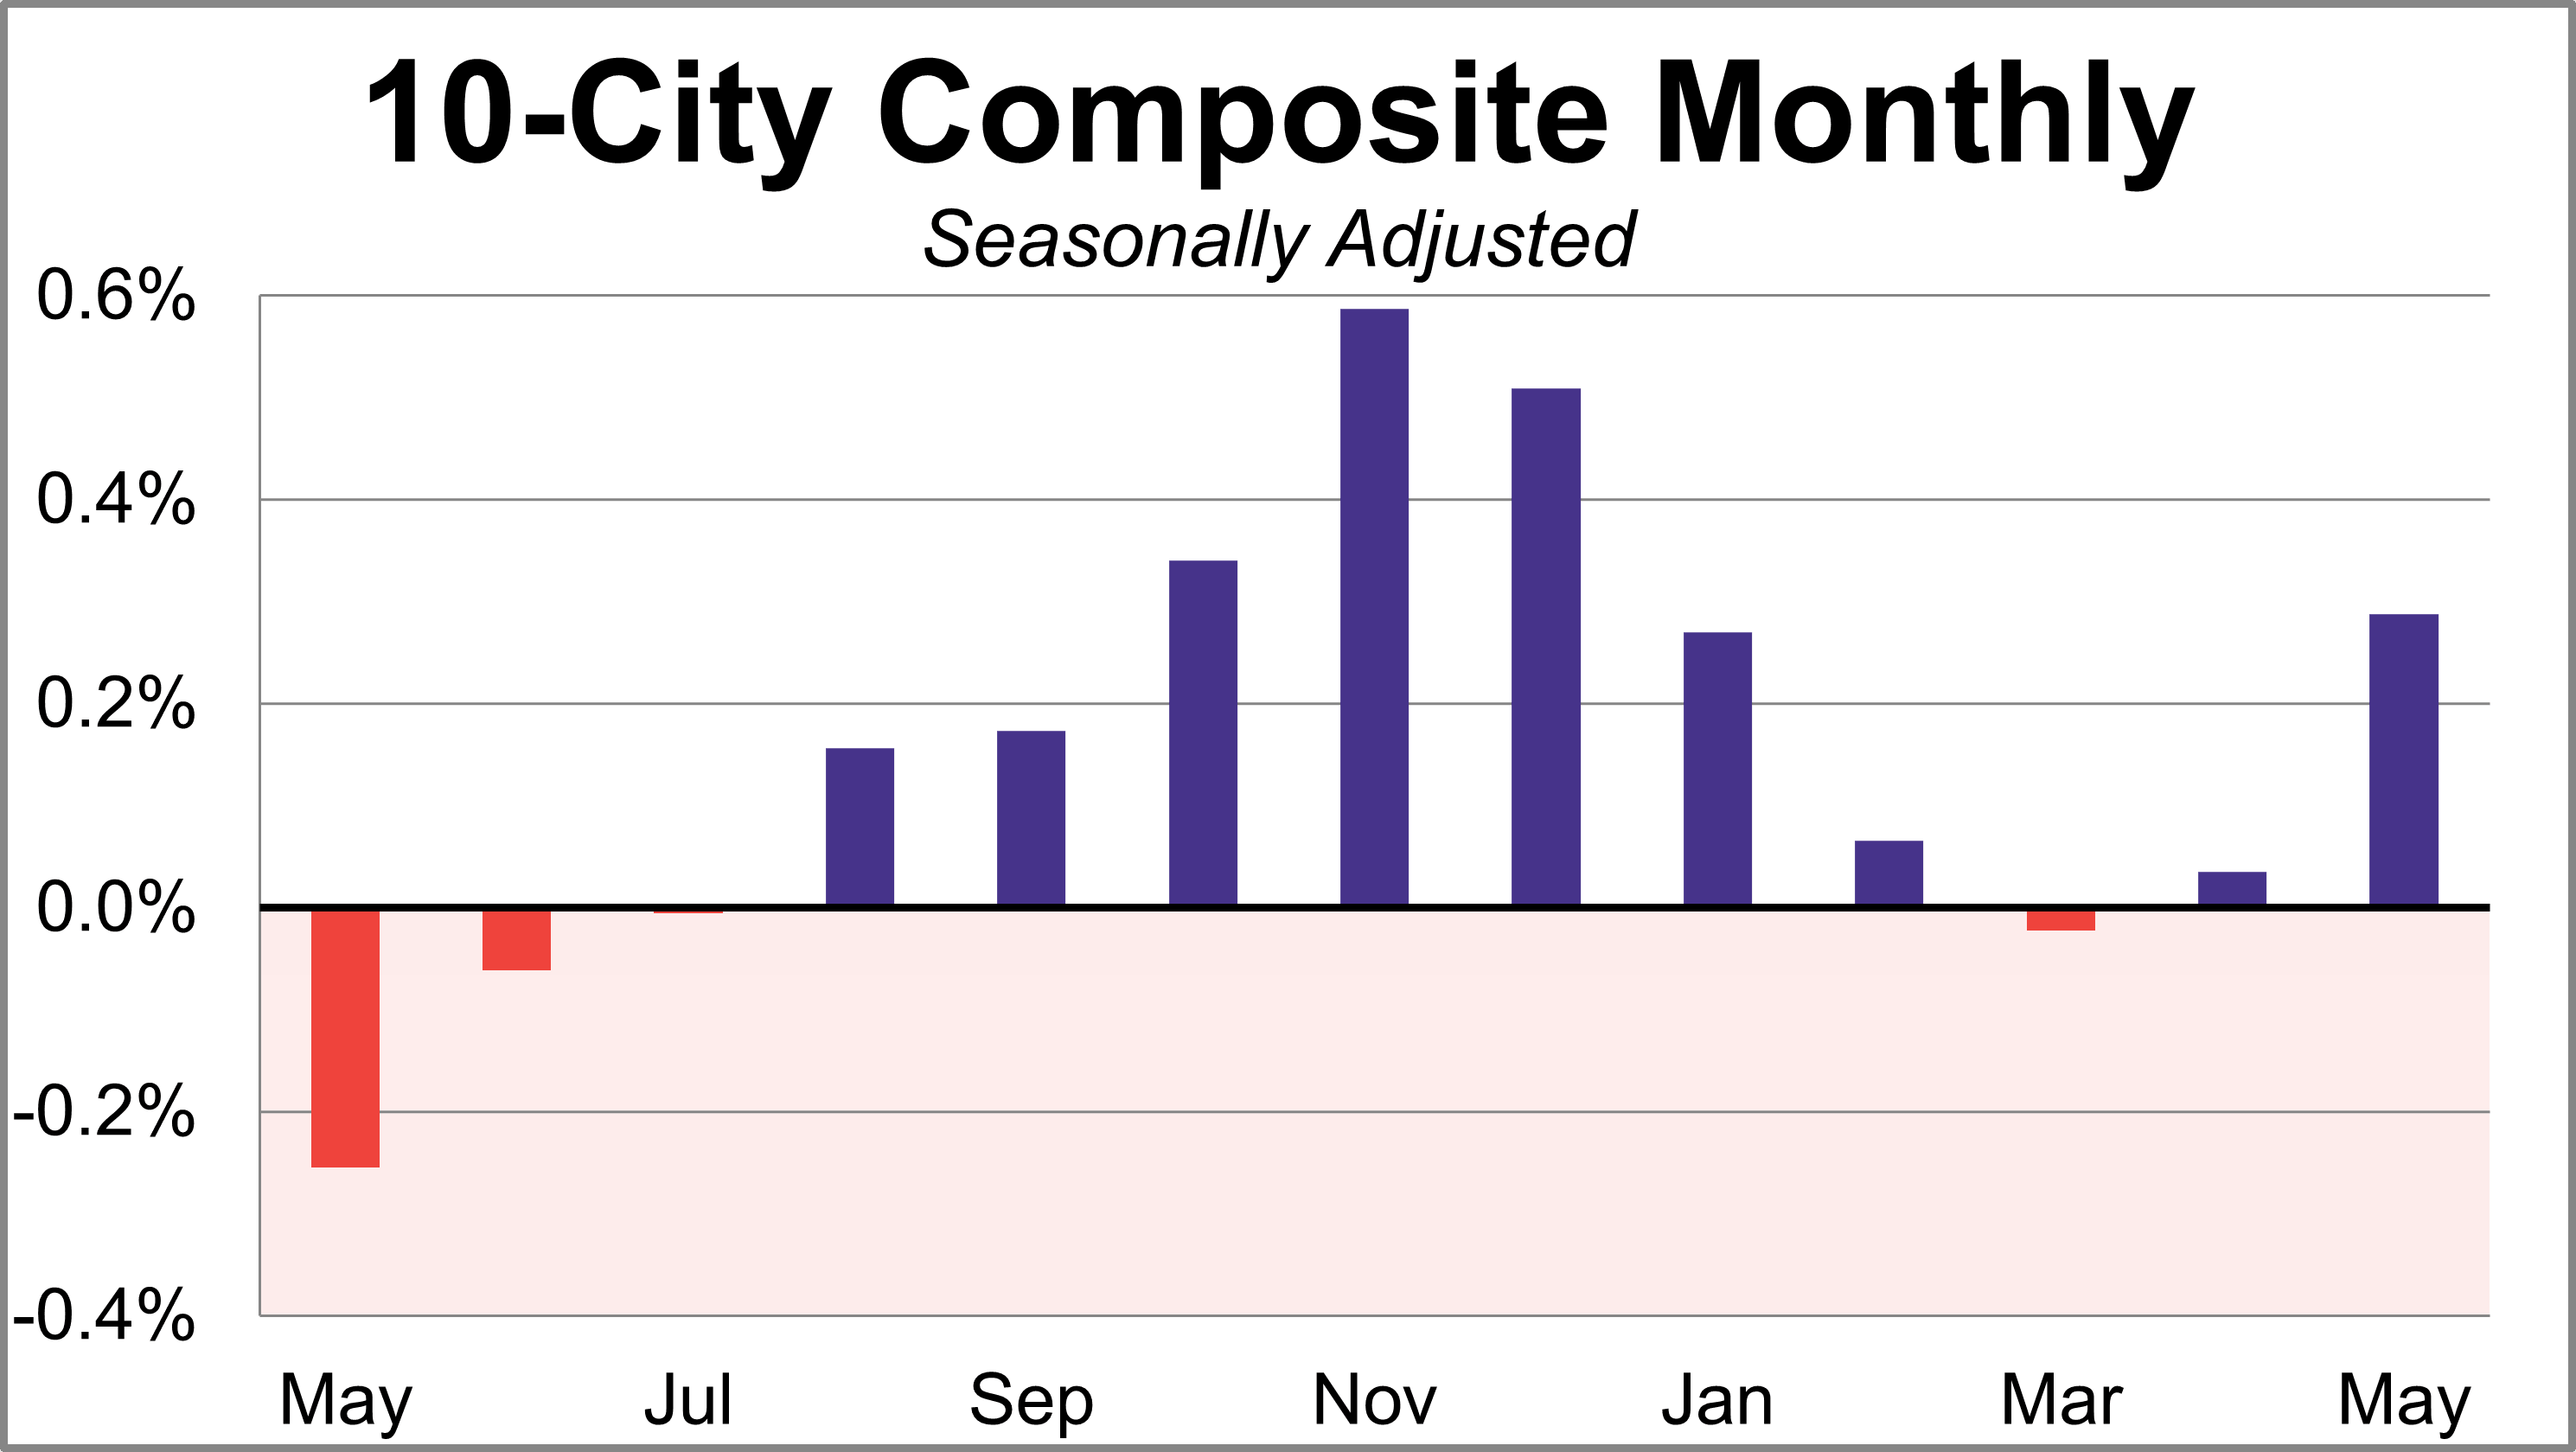
The S&P Case-Shiller benchmark 10-City composite, a subset of the 20-city index, aims to measure the change in value of residential real estate in the following 10 major U.S. cities: Boston, Chicago, Denver, Las Vegas, Los Angeles, Miami, New York, San Diego, San Francisco, and Washington D.C.
The benchmark 10-city index rose for a second straight month in May. The seasonally adjusted home prices for the 10-city index were up 0.3% month-over-month and saw a 2.4% increase year-over-yea. After adjusting for inflation, the monthly change was reduced to 0.0% and the annual change fell to -0.9%.
Here is the analysis from today's Standard & Poor's press release:
ANALYSIS
“May’s data suggests that U.S. home prices continue to decline in real terms, with the S&P Cotality Case-Shiller National Home Price Index up a modest 1.1% year over year,” said Rebecca Kaufman, Associate Director of Commodities at S&P Dow Jones Indices. “At the same time, inflation peaked at 4.2% in May, its highest level in over three years. Even on a nominal basis, the market remains noticeably weaker than a year ago. In May 2025, the National Home Price Index was up 2.4% year over year.
“The geographic dispersion of home price trends continues to persist,” Kaufman continued. “While major metropolitan areas in the Northeast and Midwest recorded year-over-year gains exceeding the national average, many metropolitan areas in the West and Sunbelt regions remain under pressure.
“For the third consecutive month, Chicago led all metros with a 6.9% annual increase in May, followed by New York (4.2%) and Cleveland (3.1%). In contrast, Las Vegas posted the largest decline, falling 1.9% year over year, with Seattle (-1.8%), Denver (-1.8%), and Tampa (-1.6%) also registering notable losses.
“This divergence may reflect shifting post-pandemic housing dynamics, including a growing return-to-office mandate that appears to be supporting traditional urban markets.
“Monthly price appreciation continues to reflect the seasonal strength often associated with the spring homebuying season,” Kaufman observed. “On a non-seasonally adjusted (NSA) basis, the National Index rose 0.6% in May from April, while the 10-City and 20-City Composites each advanced 0.9%.
“After adjusting for seasonality, the National Index declined 0.05% month over month, while the 10-City and 20-City Composites posted modest gains of 0.3% and 0.2%, respectively. The gap between the NSA and seasonally adjusted results underscores the extent to which seasonal factors are supporting headline price growth. Even where prices increased on a seasonally adjusted basis, gains remained modest and were negative in real terms.
“Affordability remains a significant headwind for the housing market,” Kaufman concluded. “Thirty-year mortgage rates increased to 6.5% in May, leaving the ultra-low 3% borrowing costs a distant memory. At the same time, stubbornly high inflation rates are keeping both the cost of home financing and the cost of living high for prospective buyers.
“Against this backdrop, housing demand remains constrained, elevated borrowing costs continue to discourage potential homebuyers, and housing values decline in real terms for existing homeowners.”