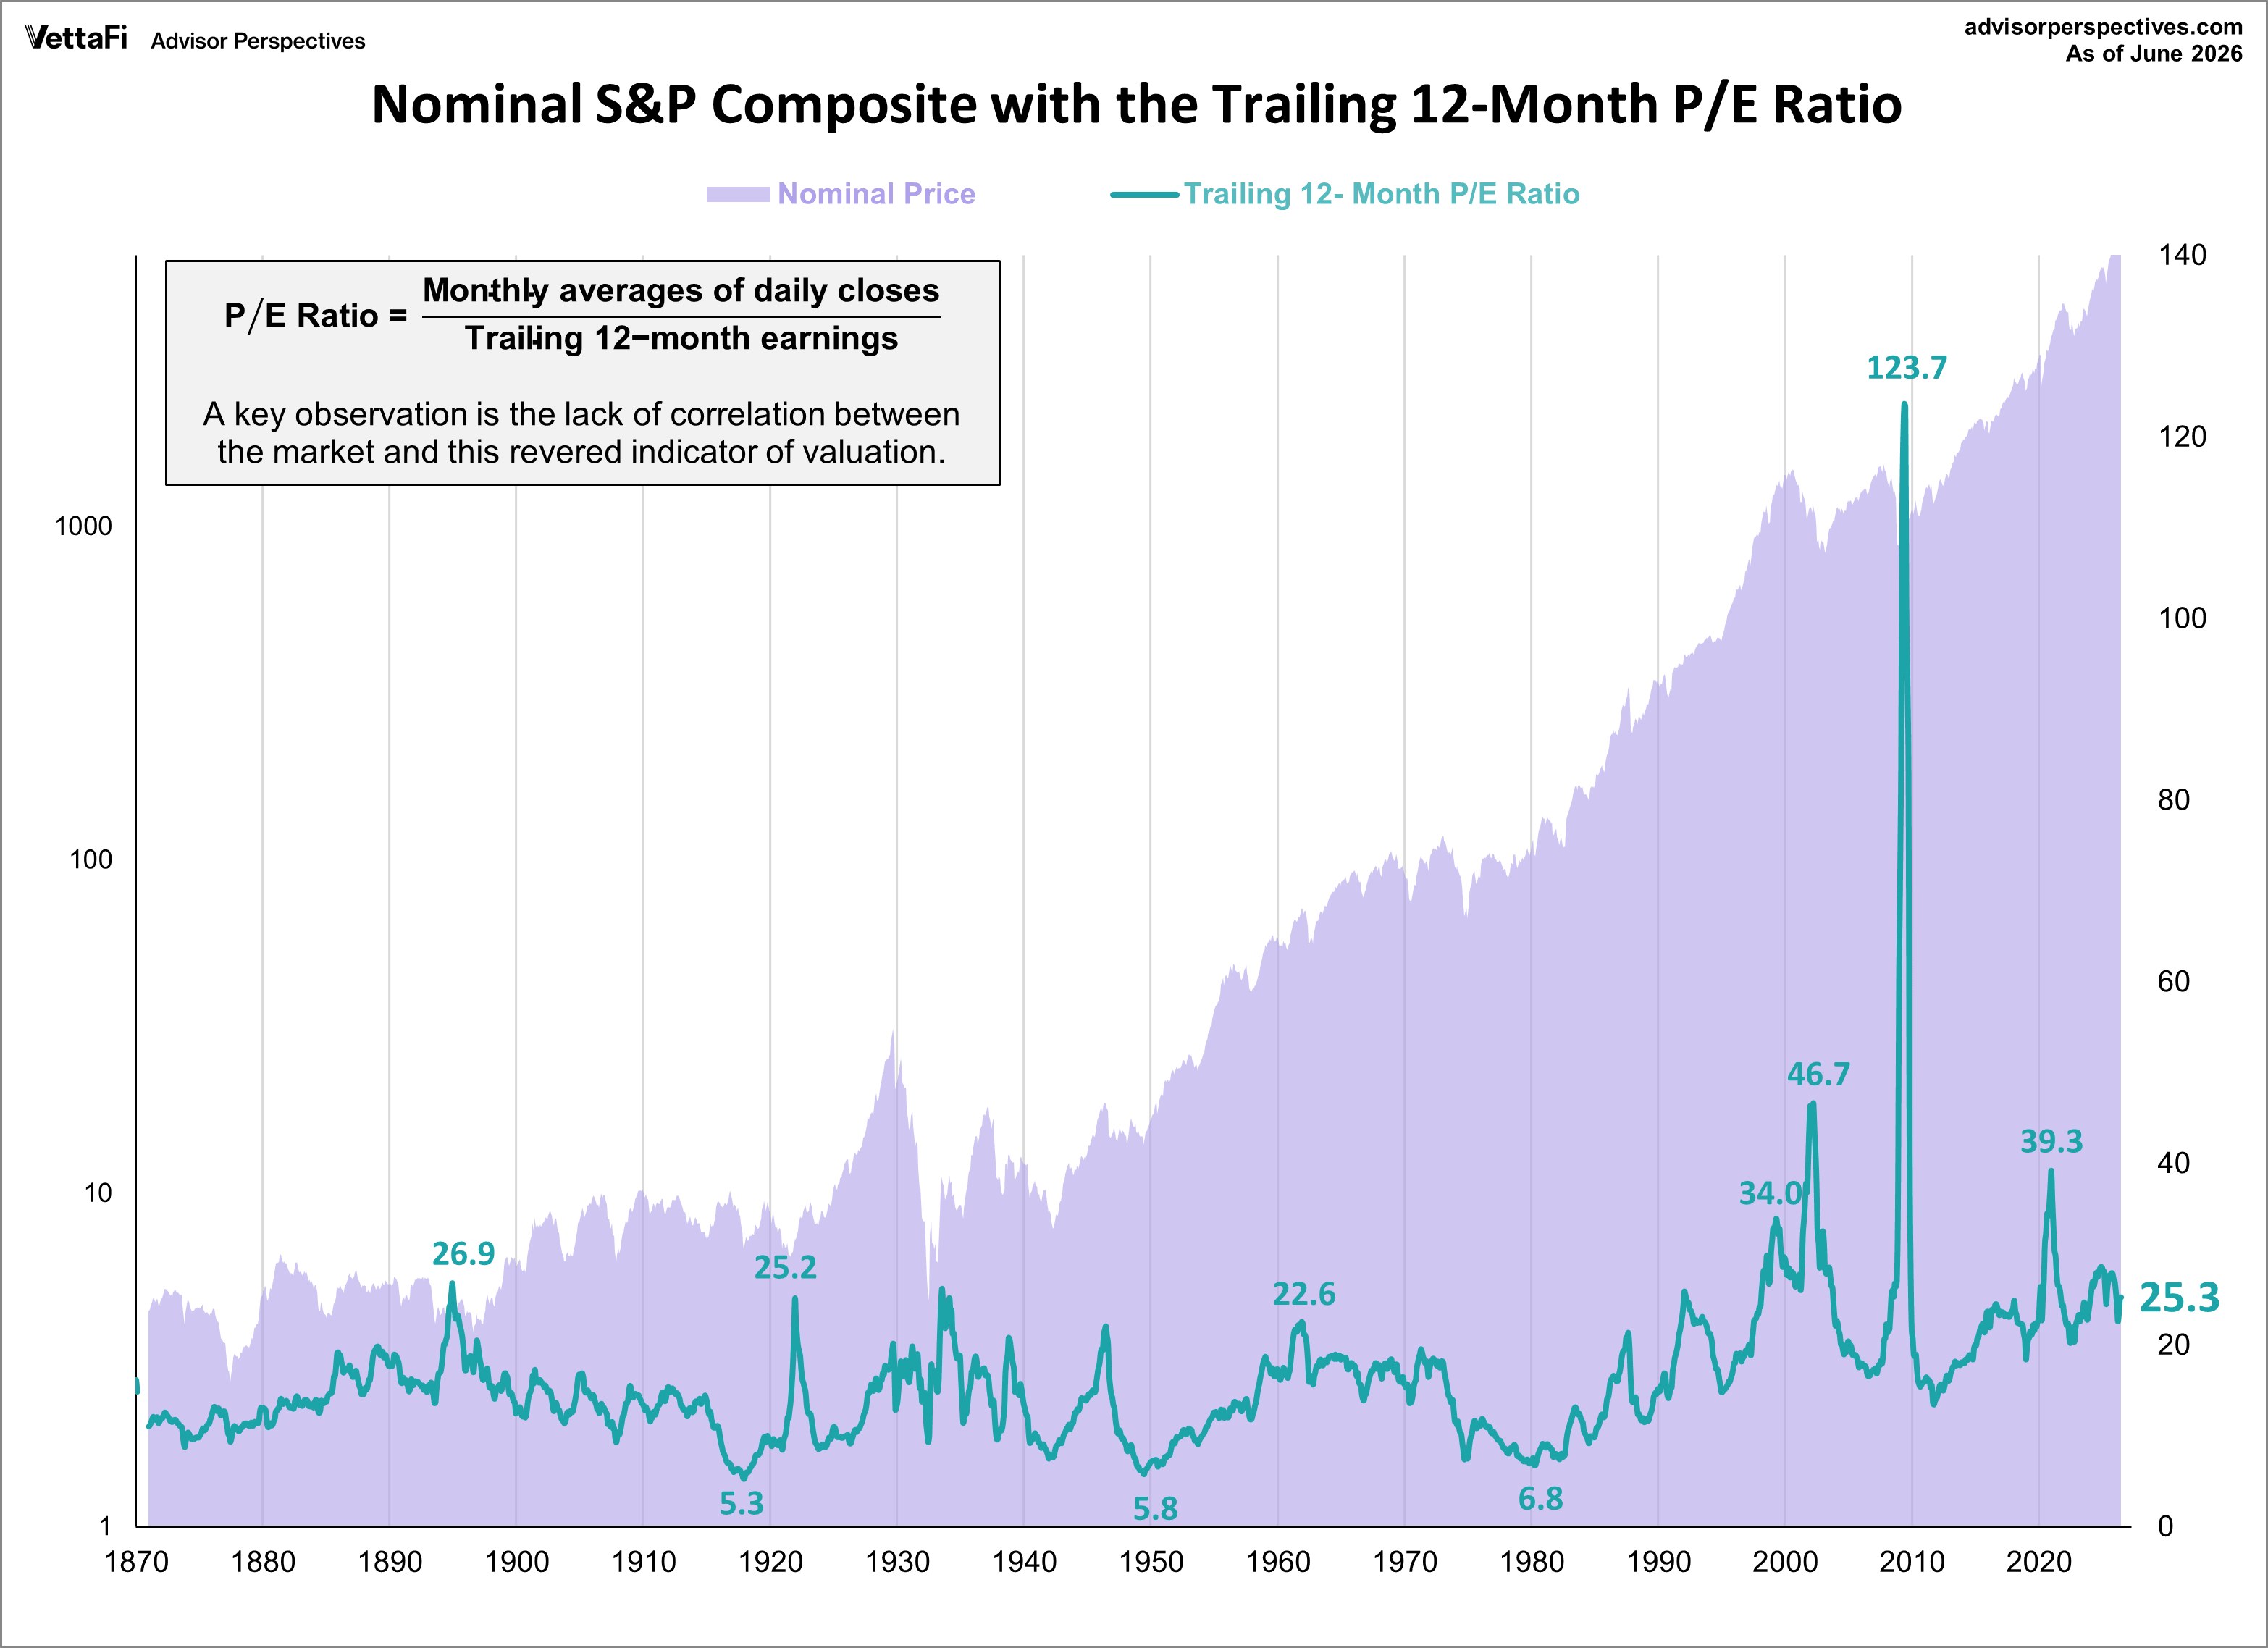
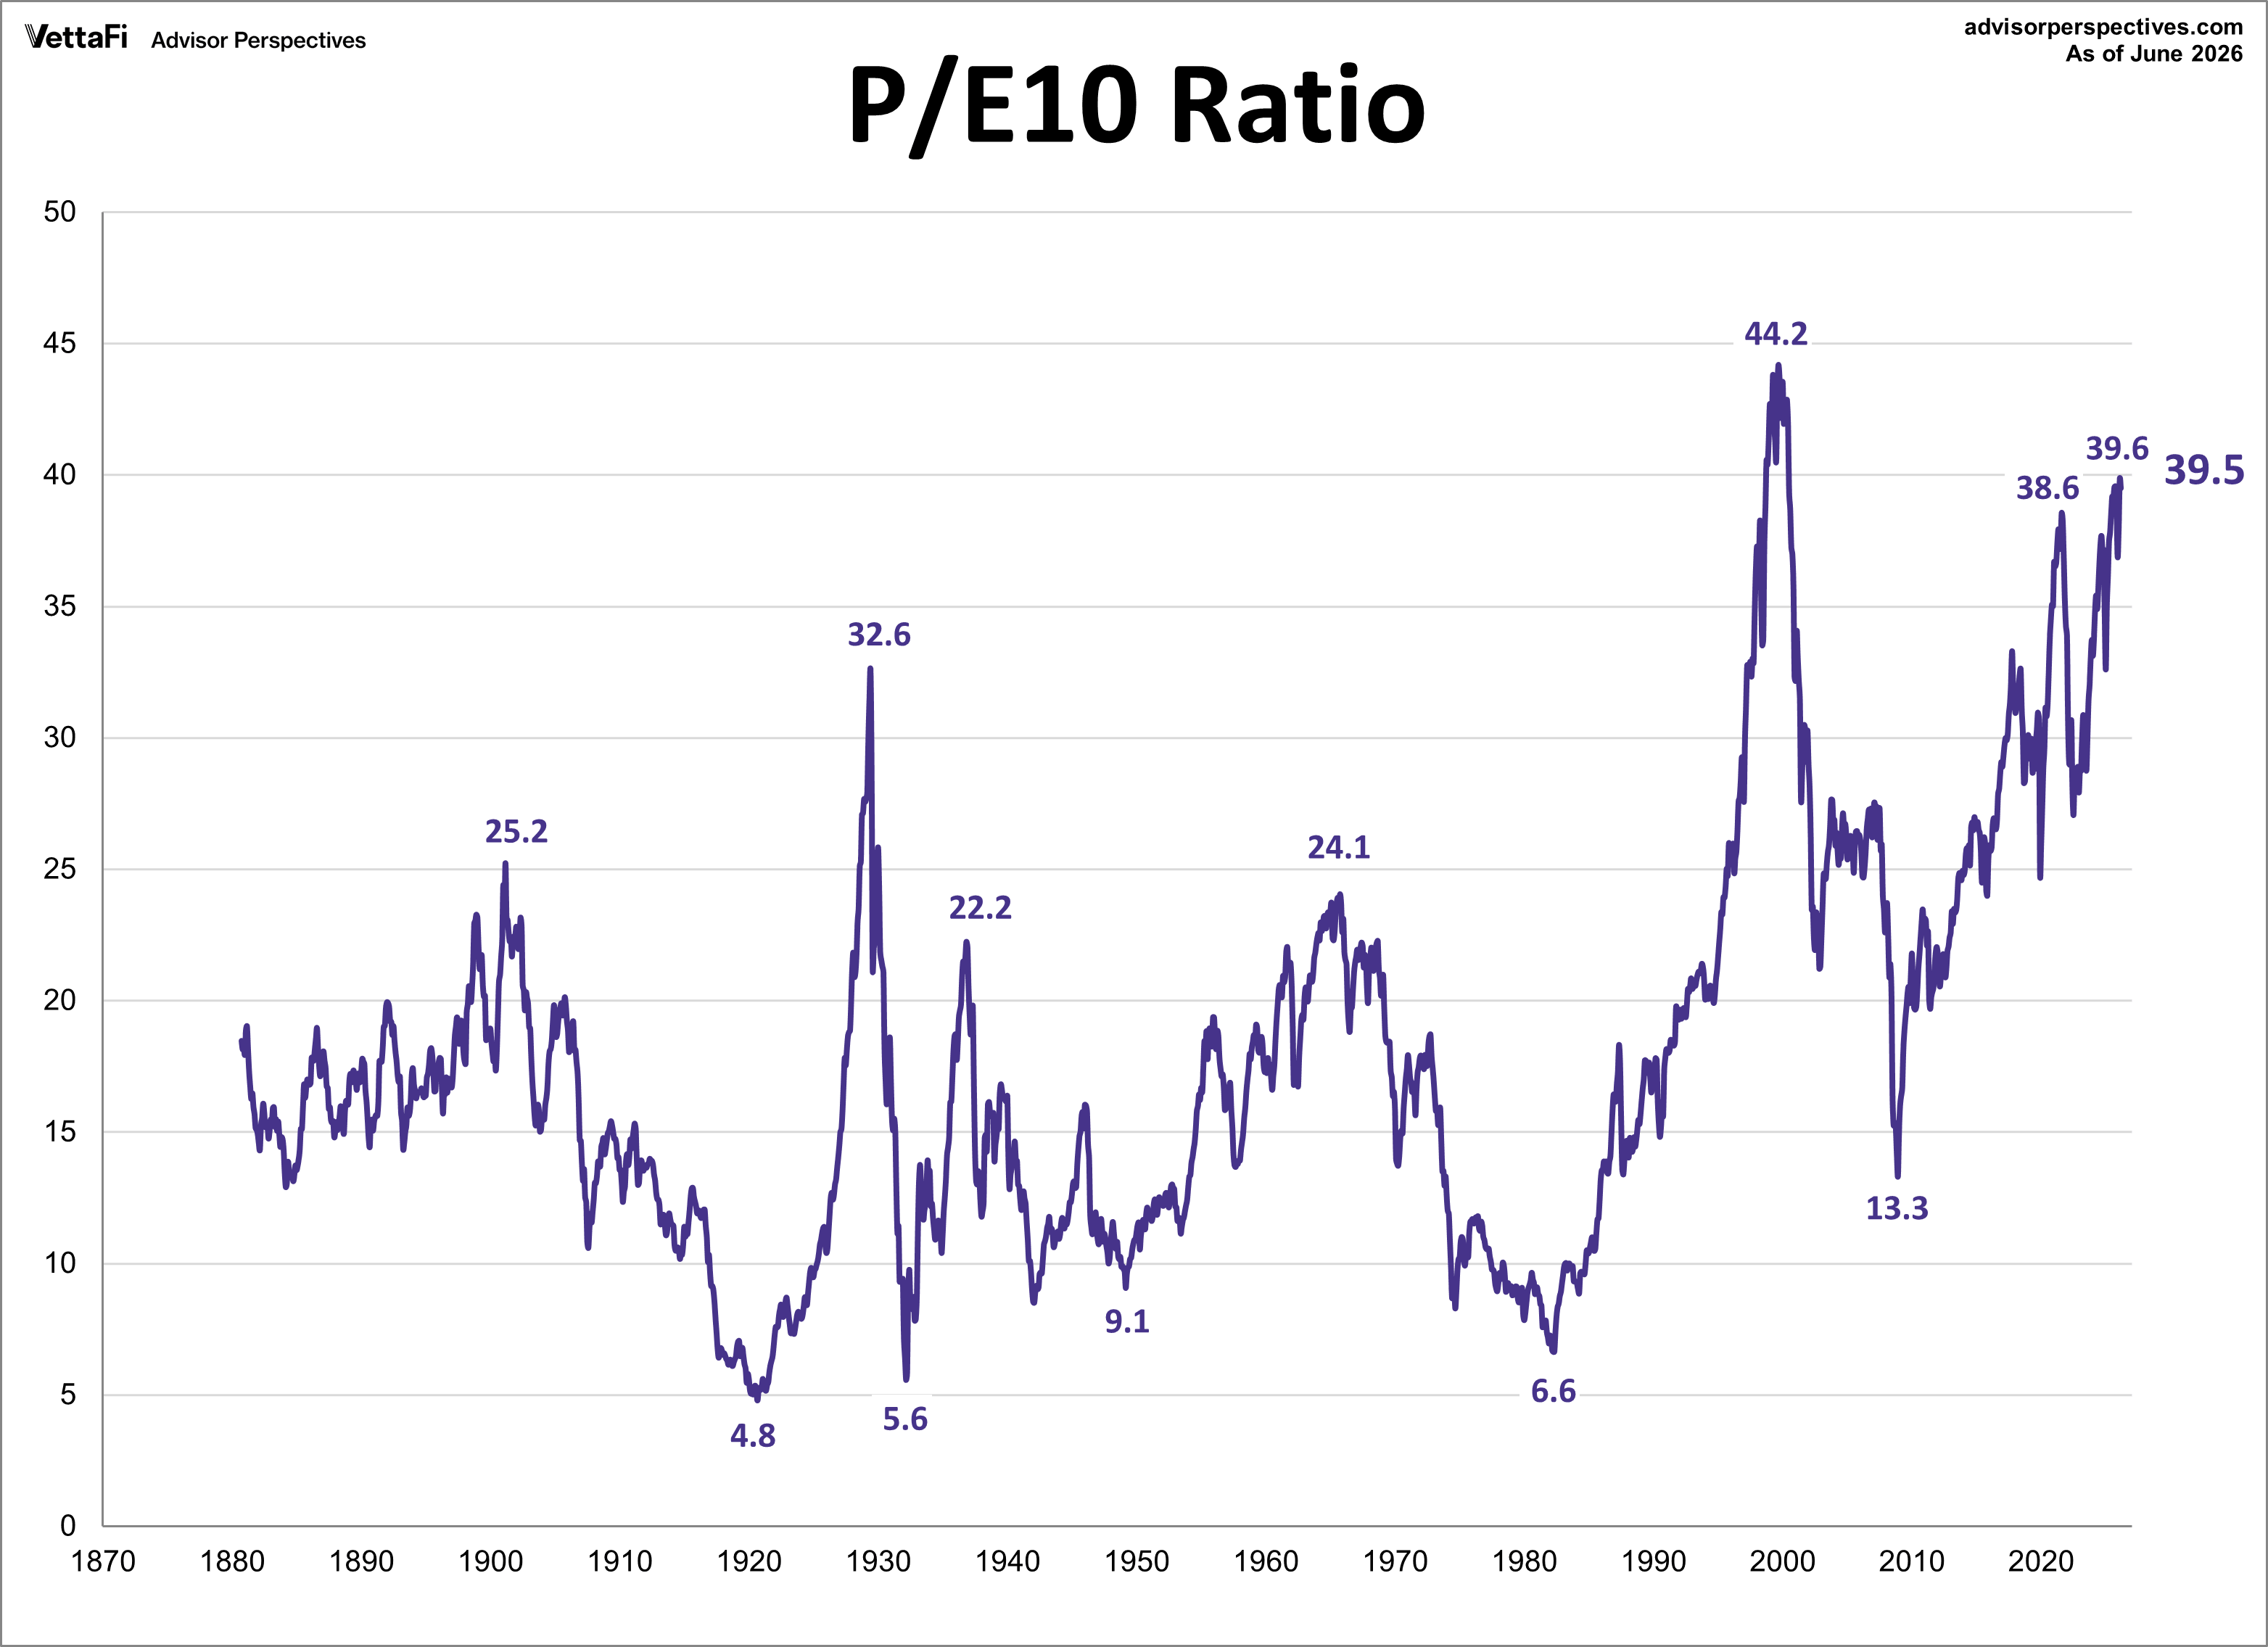
This article examines market valuation using two key metrics: the Trailing Twelve-Months (TTM) Price-to-Earnings (P/E) ratio and the P/E10 ratio. While the TTM P/E is a standard method, it has significant flaws. The P/E10, a more reliable metric, provides a clearer picture of long-term valuation trends. As of June 2026, the TTM P/E ratio is 25.3 and the latest P/E10 ratio is 39.5.
The Conventional TTM P/E Ratio
The conventional TTM P/E ratio divides the current price by the earnings from the past twelve months. The 'price' part of the P/E calculation is available in real-time on TV and the Internet. The 'earnings' part, however, is more difficult to find. The authoritative source for these fundamental metrics is the Robert Shiller S&P Composite dataset.
Historically, the average TTM P/E has been around 16.2. However, as a valuation indicator, it can be misleading during periods of market stress. For example, during the 2008-2009 financial crisis, the P/E ratio surged into the triple digits because earnings plummeted faster than prices. This and other examples, such as the Tech Bubble and the 2020 pandemic where the TTM P/E reached 46.7 and 39.3, respectively, show why the TTM P/E can be an unreliable measure of market value at critical times. The chart below illustrates the unsuitability of the TTM P/E as a consistent indicator of market valuation.

The More Reliable P/E10 Ratio
Legendary economist and value investor Benjamin Graham noticed the same bizarre P/E behavior during the Roaring Twenties and subsequent market crash. Graham collaborated with David Dodd to devise a more accurate way to calculate the market's value. They attributed the illogical P/E ratios to temporary and sometimes extreme fluctuations in the business cycle. Their solution was to divide the price by a multi-year average of earnings and suggested 5, 7 or 10-years.
Yale professor and Nobel laureate Robert Shiller, the author of Irrational Exuberance, has popularized the concept to a wider audience of investors and has selected the 10-year average of "real" (inflation-adjusted) earnings as the denominator. Shiller refers to this ratio as the Cyclically Adjusted Price Earnings Ratio, abbreviated as CAPE, or the more precise P/E10, which is our preferred abbreviation.
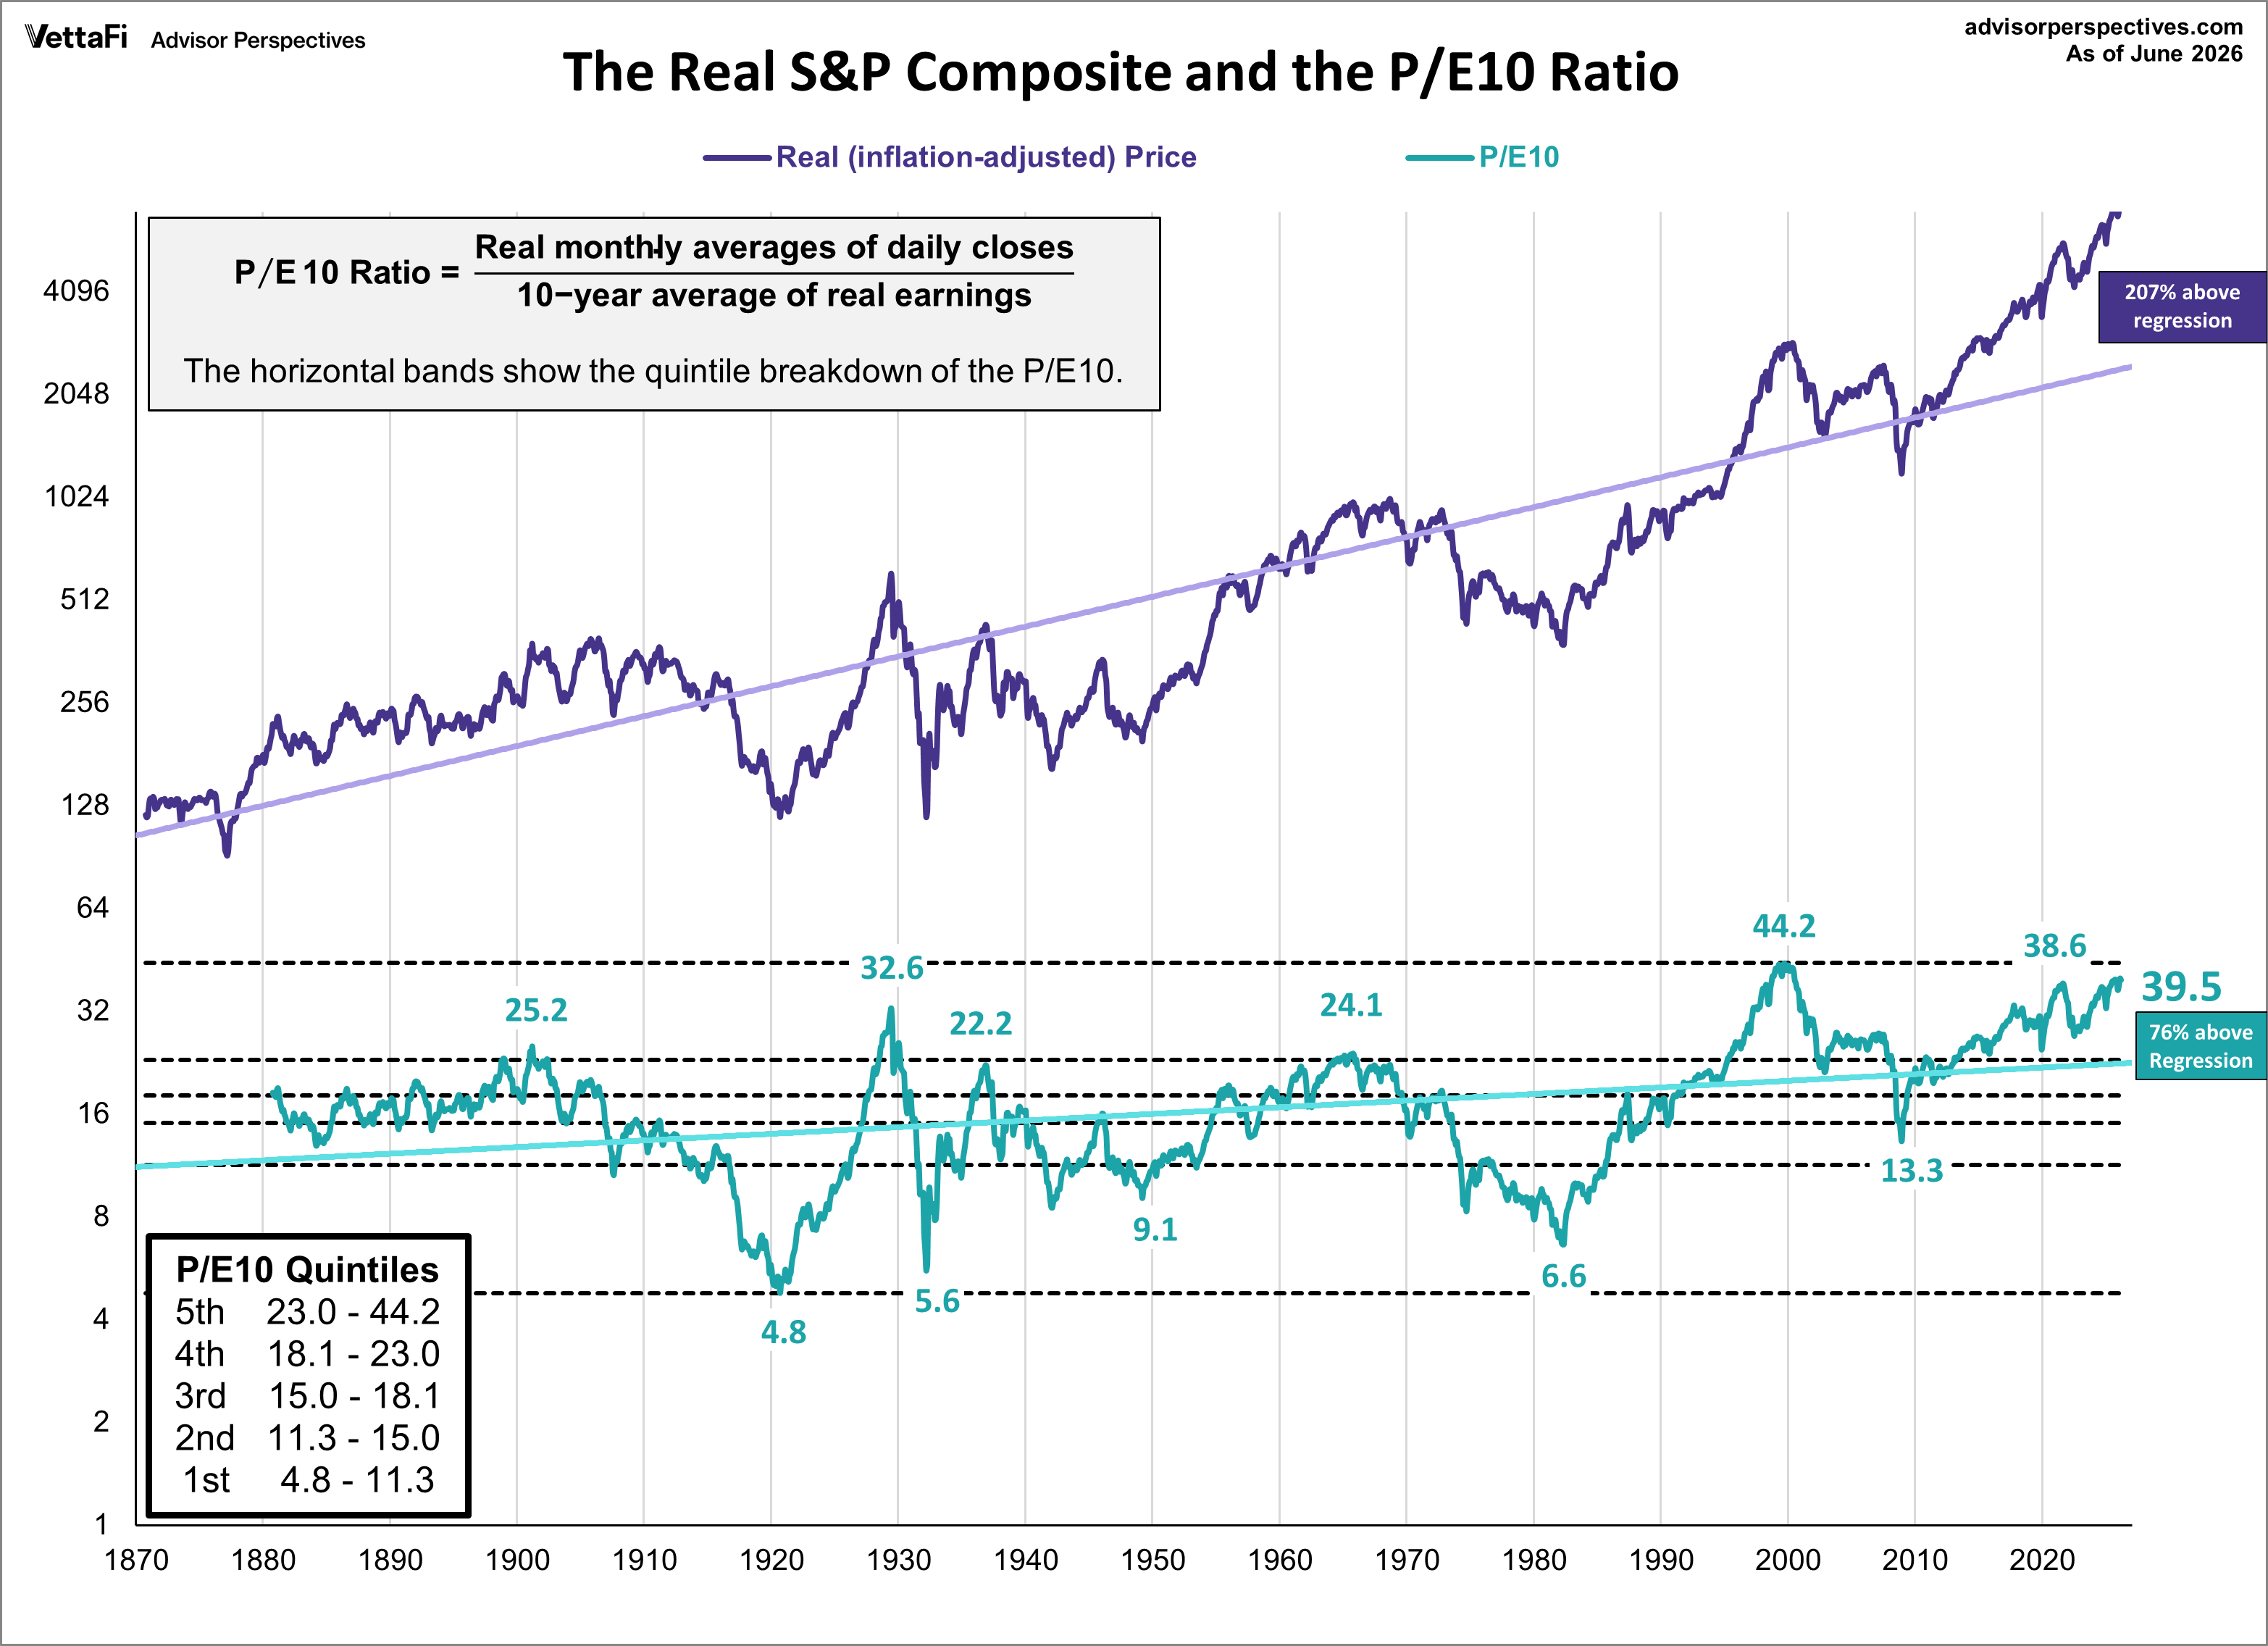
As the chart below illustrates, the P/E10 ratio closely tracks the real (inflation-adjusted) price of the S&P Composite, with a detrended correlation of 0.9977 since 1881. The historic average for the P/E10 is 17.8, but it has experienced dramatic swings between over- and undervalued periods. The latest ratio of 39.5 is 76% above its long-term trendline.
P/E10 Historical Context and Current Valuation
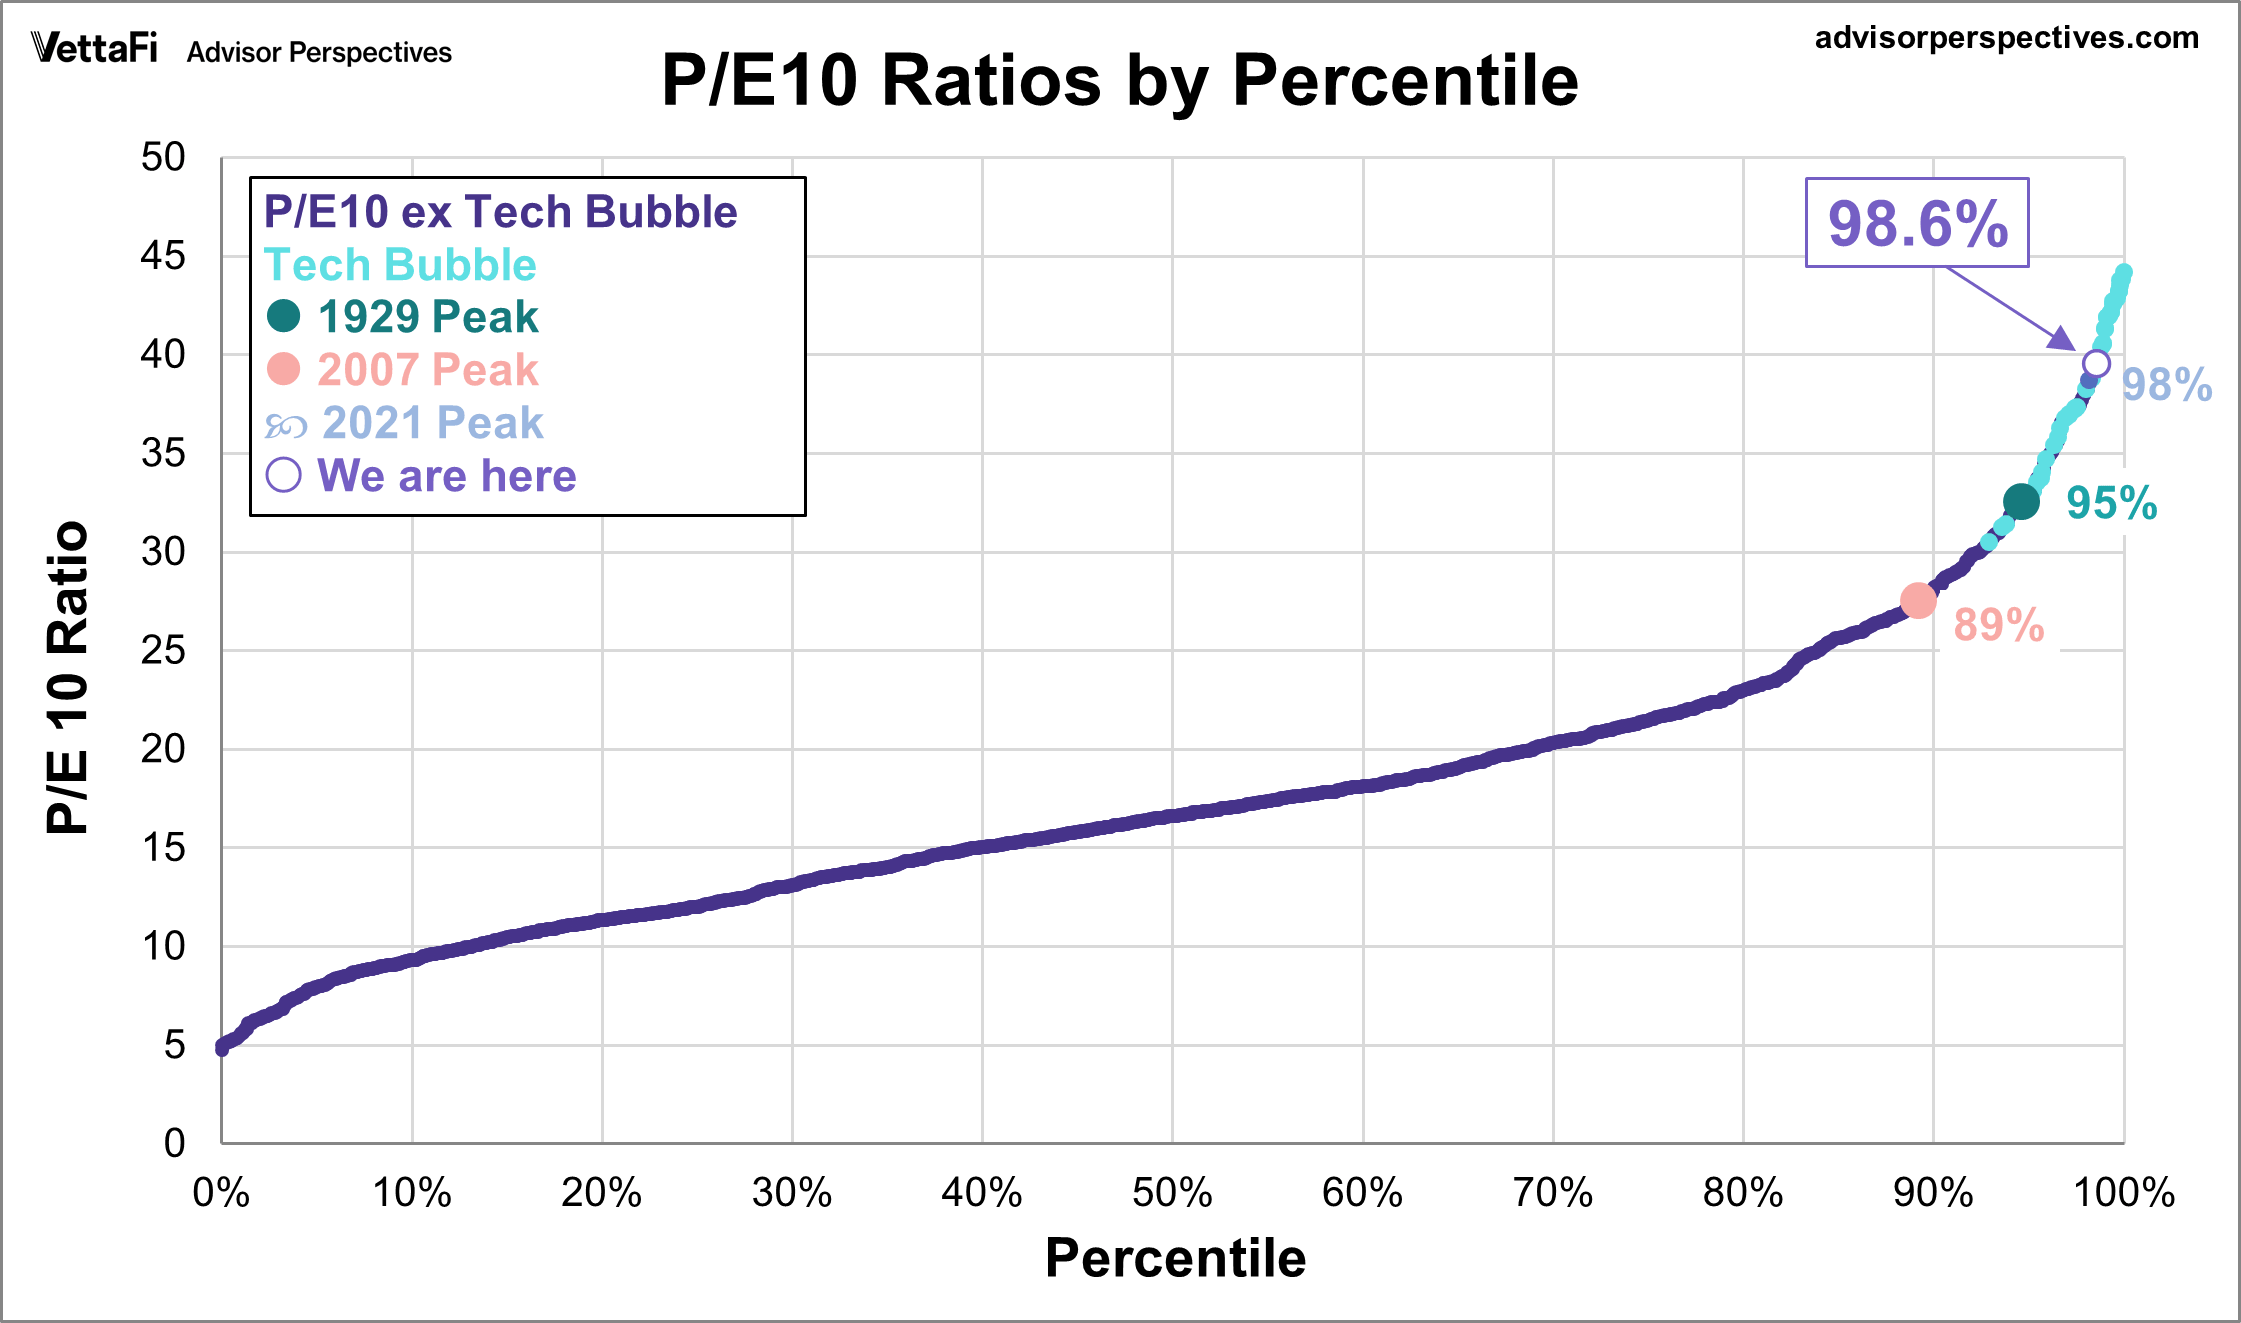
To put the current P/E10 into historical context, we can use both quintile and percentile analysis. The P/E10 is currently in the highest quintile, suggesting a highly overvalued market. Historically, when the P/E10 has fallen from the top quintile, it has often continued its decline into the lowest quintile. Reaching a single-digit P/E10 today would require the S&P 500 to fall below 1876, unless corporate earnings see a sustained and significant increase.
Looking at the data on a percentile basis, the current ratio sits at approximately the 99th percentile of its historical range. This means it has only been higher for about 1% of its history.
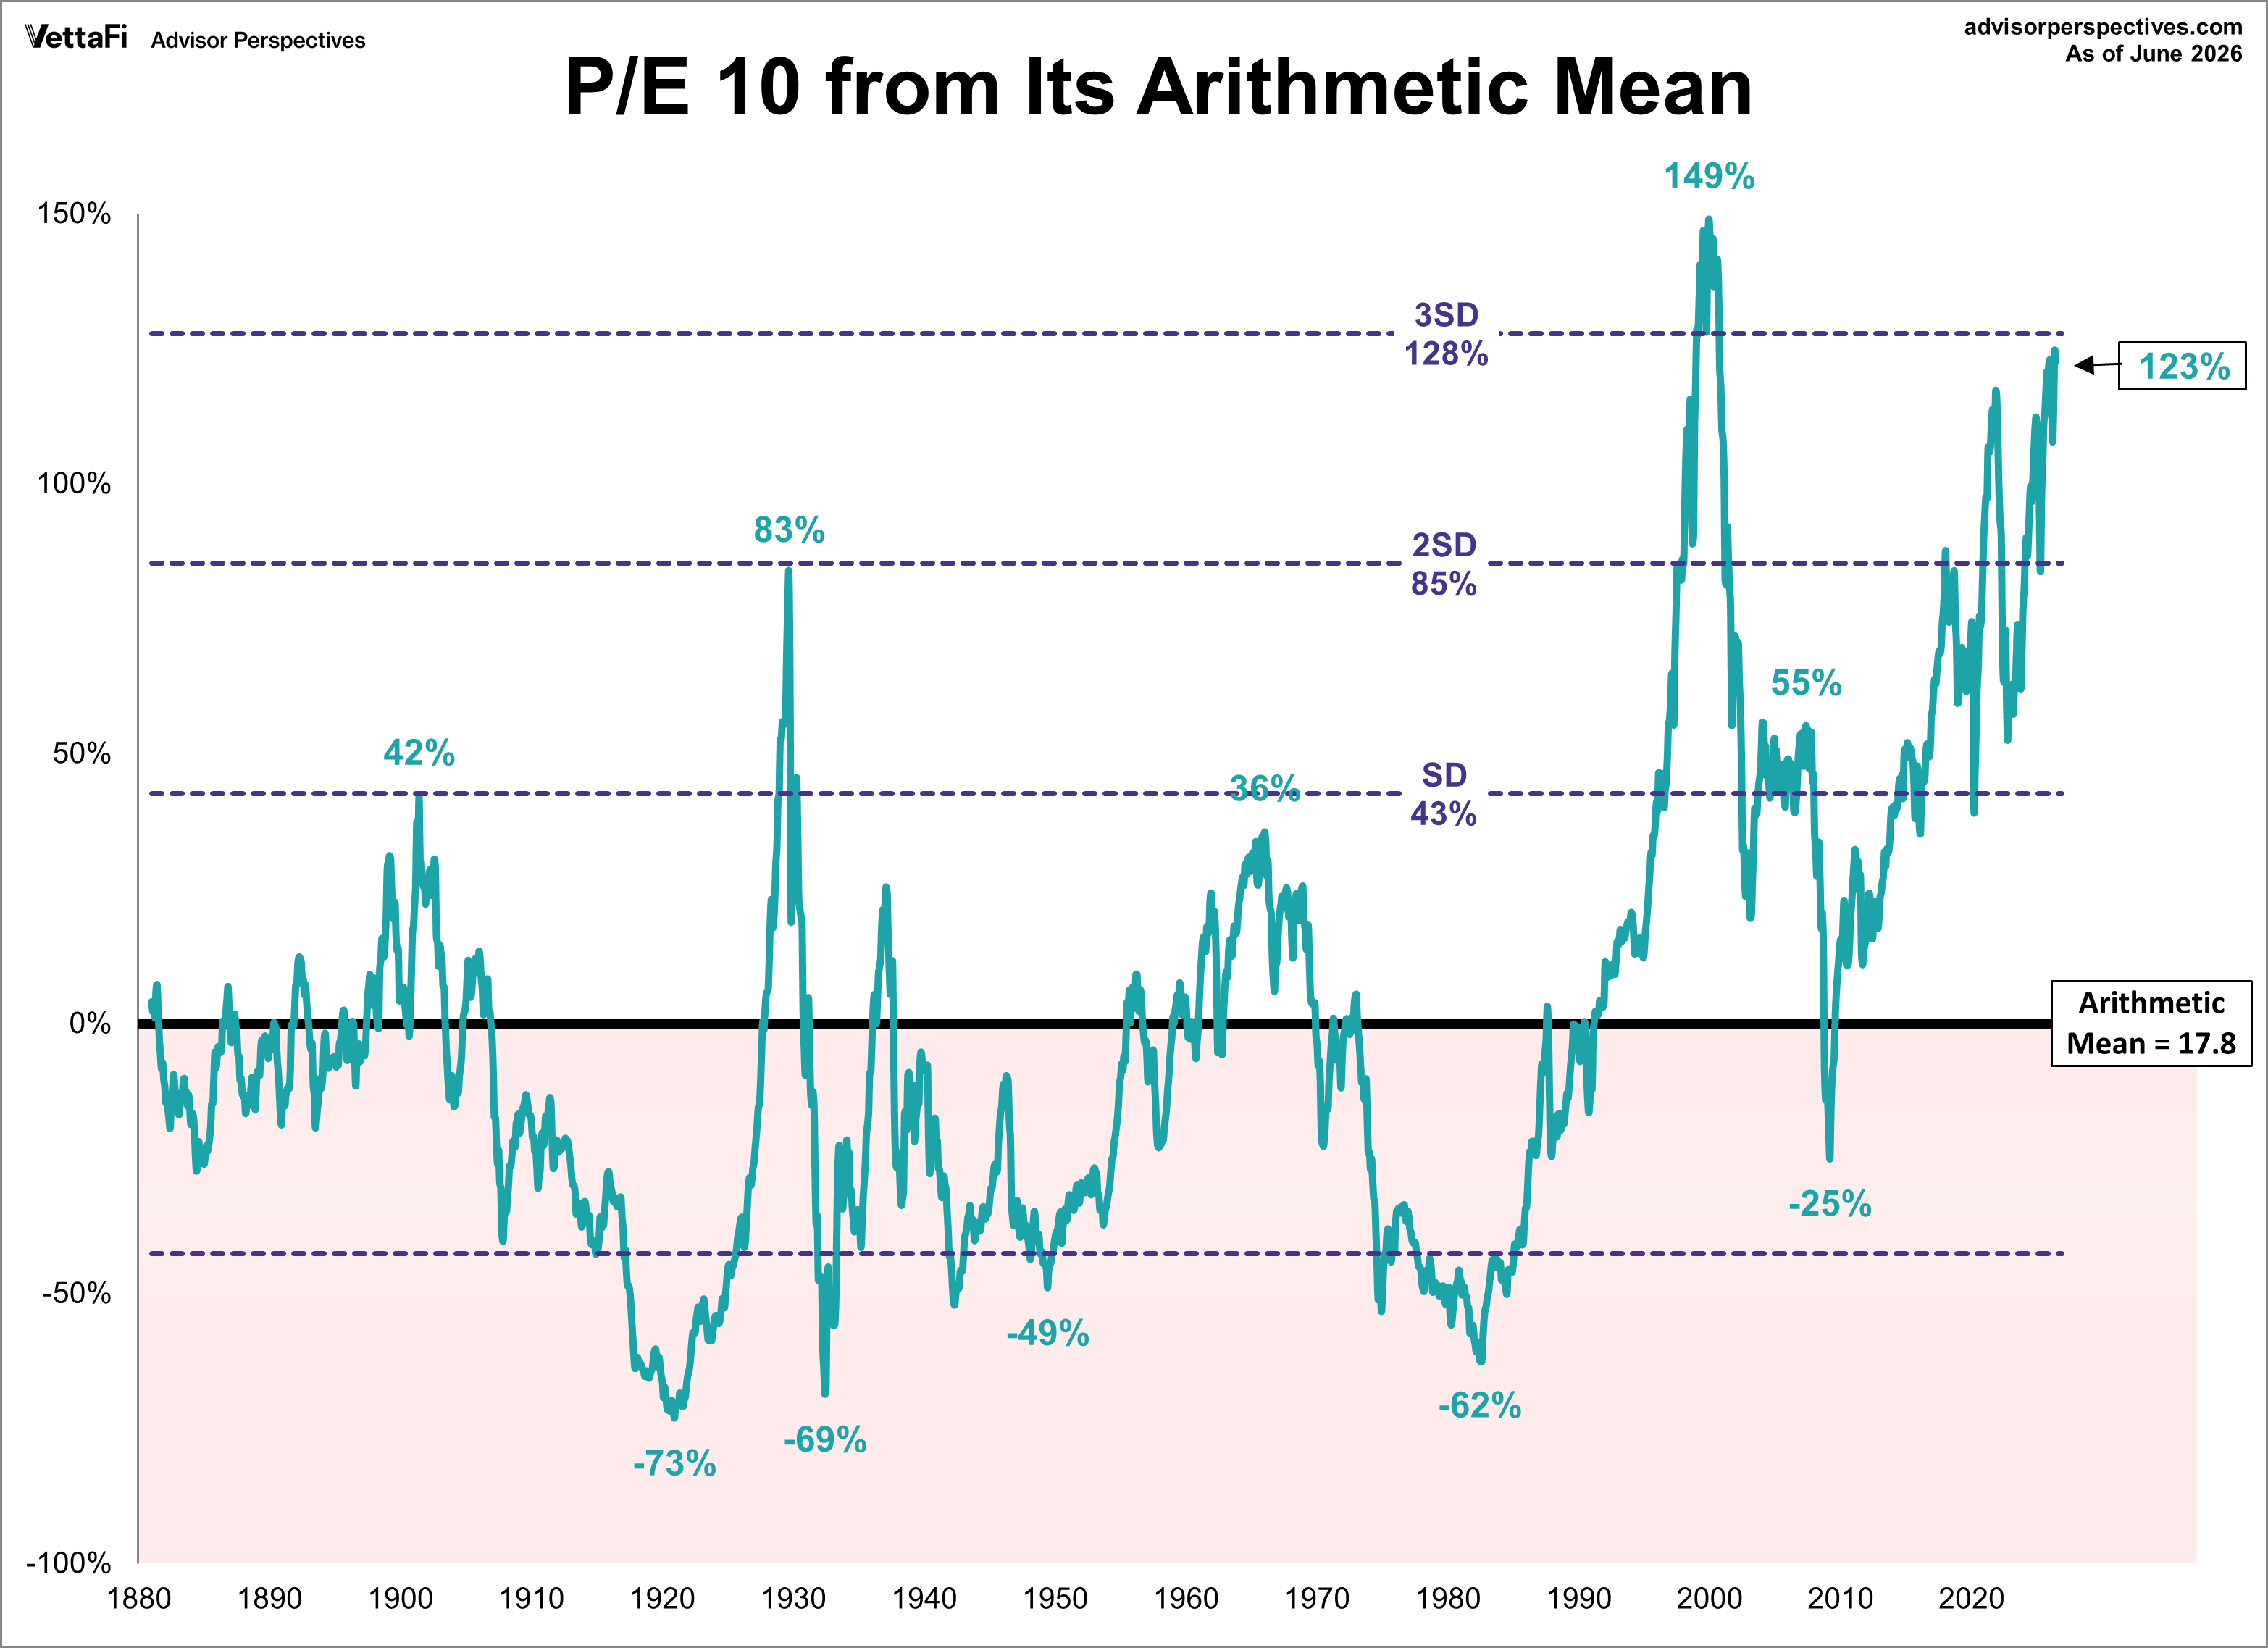
The average P/E10 Ratio is 17.8. The chart below shows the ratio relative to its arithmetic mean, giving a more intuitive sense to the numbers. For example, the P/E10 Ratio reached its all-time high of 44.2 in December 1999, suggesting that the market price was 149% above the historic average. The all-time low in December 1920 was 4.8, which is approximately 73% below the historic averages. That's quite a range. As of June 2026, the latest P/E10 Ratio of 39.5 is 123% above its historic average.
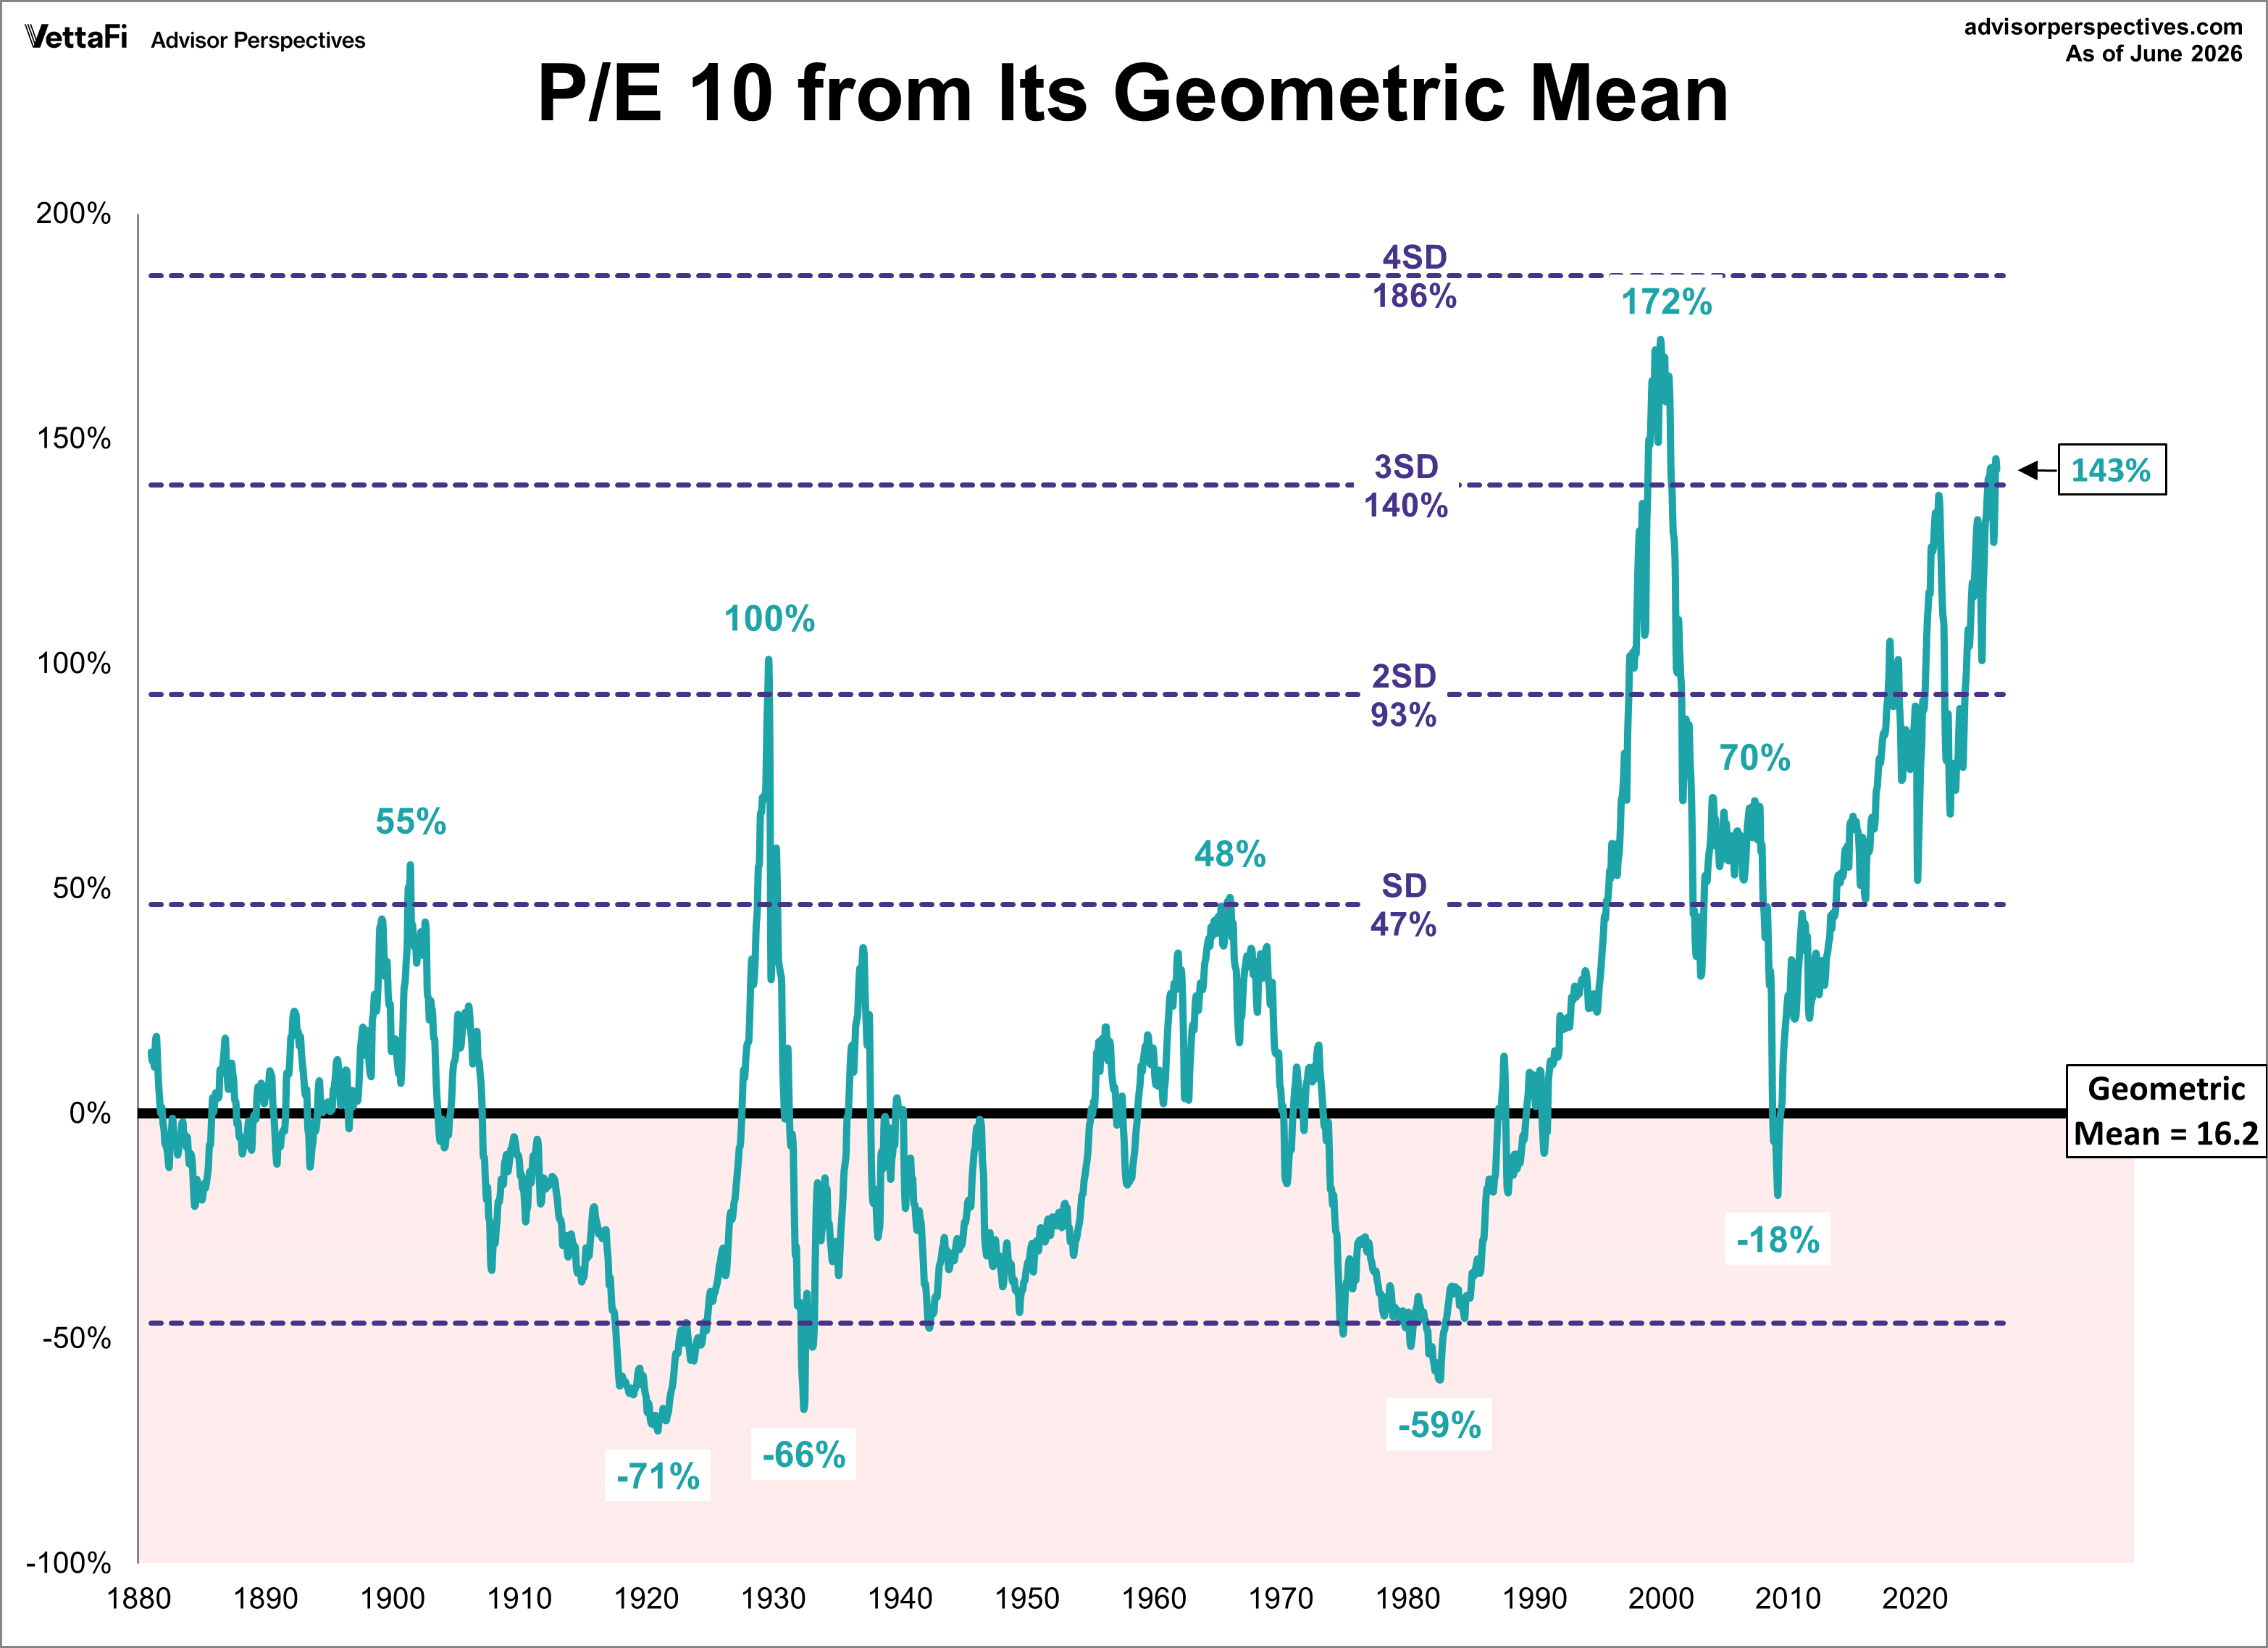
The next chart is adjusted to the geometric mean, which is 16.2. Using the geometric mean, the all-time high and low mentioned above are adjusted to 172% above and 71% below the historic averages, respectively. As of June 2026, the latest P/E10 Ratio is 143% above its historic geometric average.
What Are the Impacts of Rates and Inflation on Market Valuations? For more on this topic, see our monthly update: Market Valuation, Inflation, and Treasury Yields: Clues from the Past.
Wouldn't Valuations Be Much Lower If We Exclude the Financial Crisis Earnings Crash? This is an often asked question, the assumption being that the unprecedented negative earnings of the Financial Crisis skewed the P/E10 substantially higher than would otherwise have been the case. While that may seem a reasonable assumption, a simple experiment shows that the earnings plunge did not dramatically impact the ratio. Let's assume that the December 2007 TTM earnings of 66.18 remained constant for the next 29 months, totally eliminate the collapse in earnings of the Great Recession. What impact does this have on the P/E 10? The mean (average) only drops from 16.6 to 16.5. The lower bound of the top quintile drops from 21.2 to 20.8.
Exactly What Is the S&P Composite index? For readers unfamiliar with the index, see this article for some background information. ETFs associated with the S&P 500 include: iShares Core S&P 500 ETF (IVV), SPDR S&P 500 ETF Trust (SPY), Vanguard S&P 500 ETF (VOO), and SPDR Portfolio S&P 500 ETF (SPYM).
Read more updates by Jen Nash