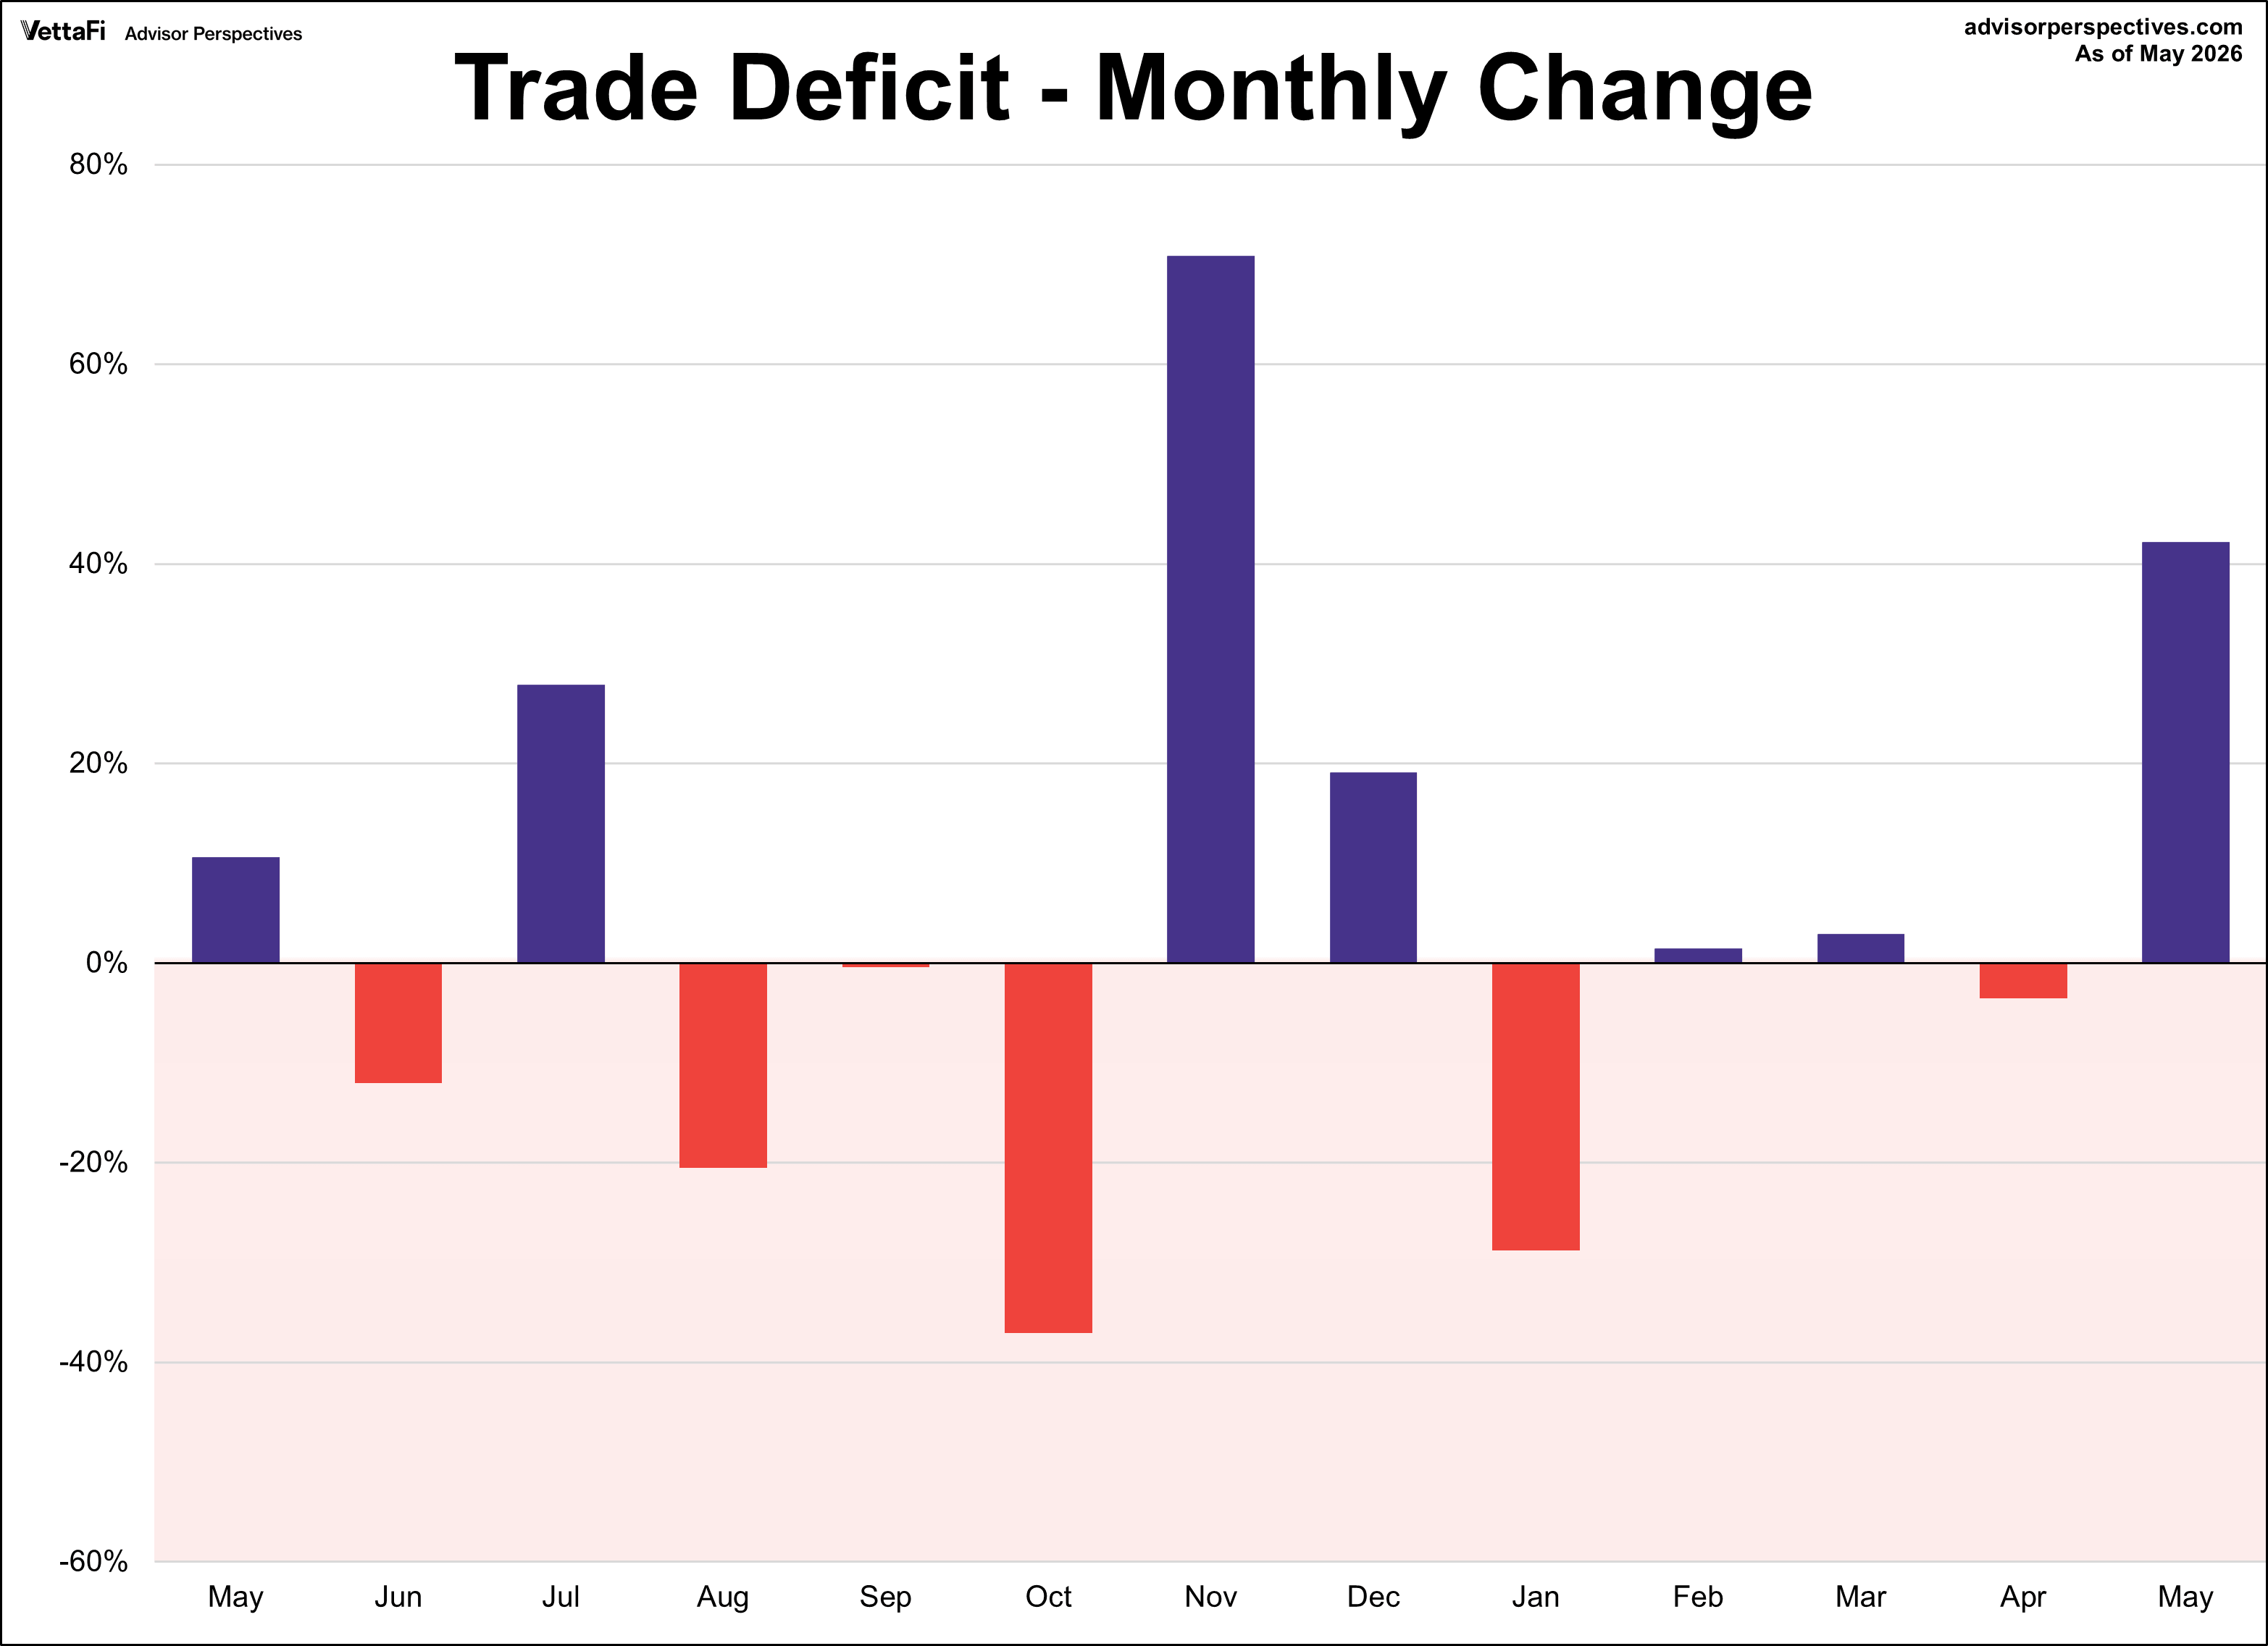
The U.S. trade deficit expanded over 40% in May to $77.59B, its widest gap since March 2025. The latest reading missed the forecast of -$78.30B. Compared to a year ago, the trade deficit is 16.2% larger.
The U.S. international trade in goods and services is published monthly by the Bureau of Economic Analysis with data going back to 1992. The monthly reports include revisions that go back several months. This trade balance measures the difference in value between imported and exported goods and services. Here is an excerpt from the latest report:
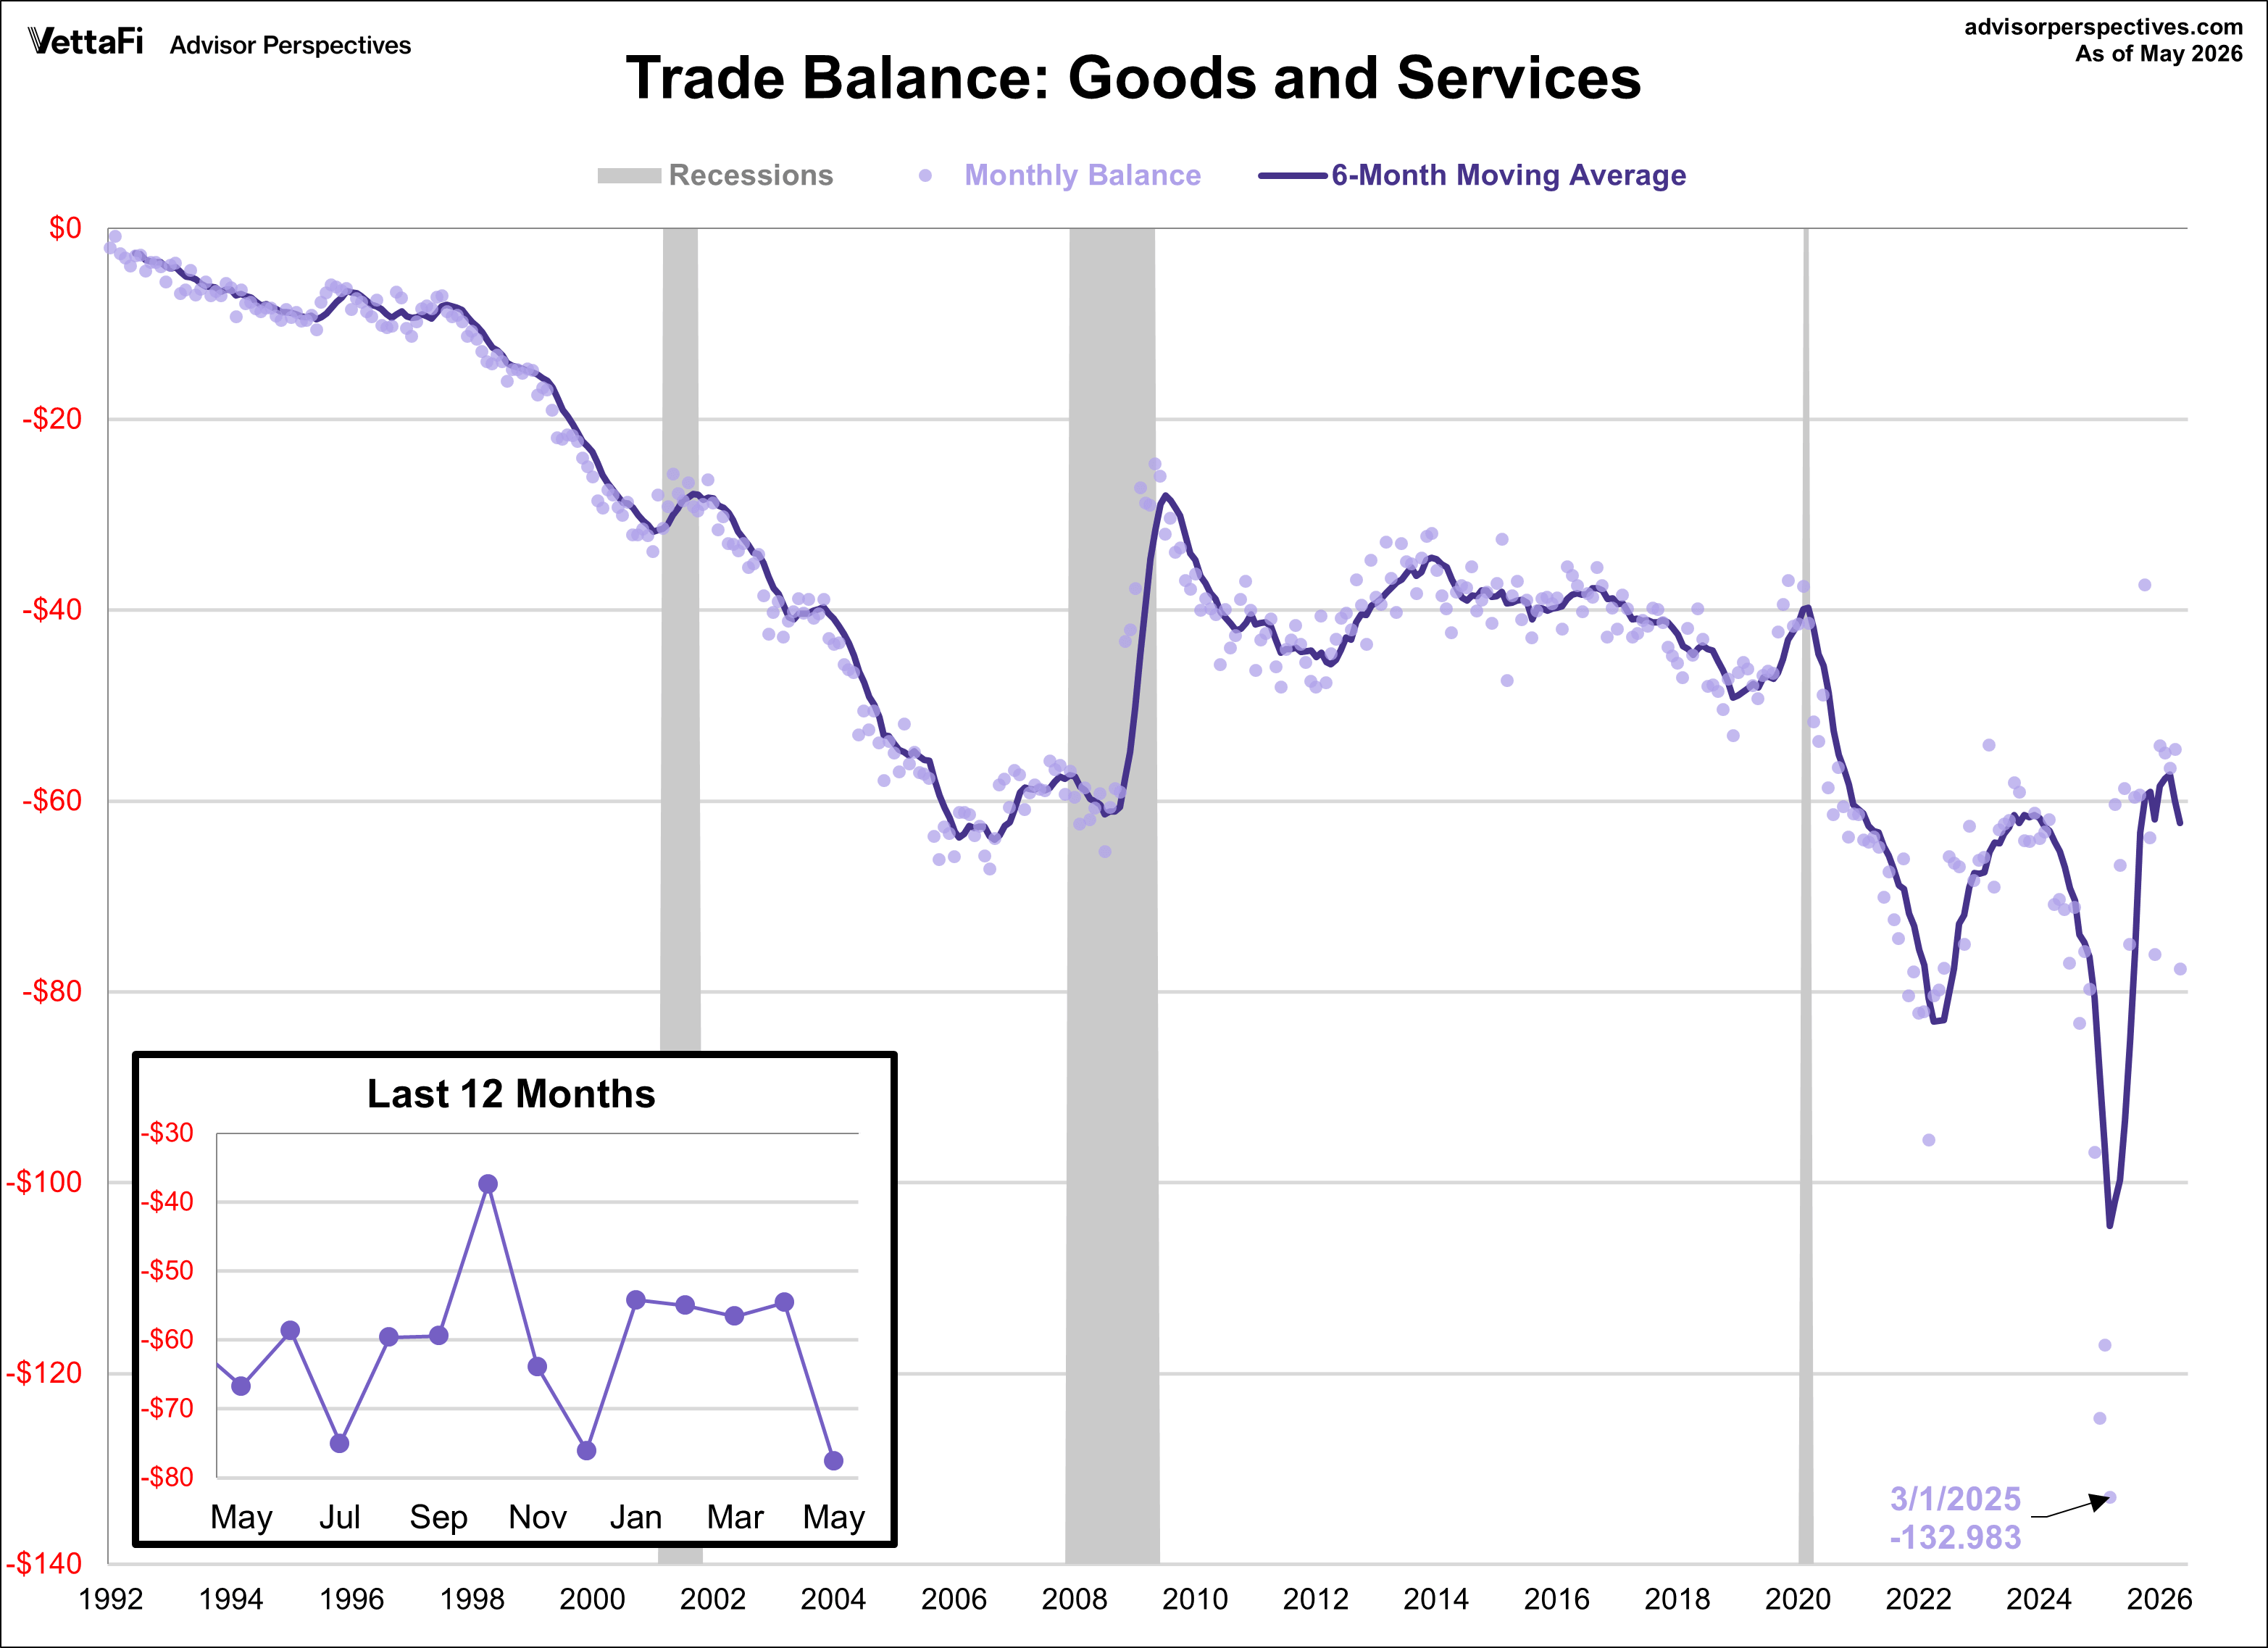
The U.S. goods and services trade deficit increased in May 2026 according to the U.S. Bureau of Economic Analysis and the U.S. Census Bureau. The deficit increased from $54.6 billion in April (revised) to $77.6 billion in May, as exports decreased and imports increased. The goods deficit increased $23.6 billion in May to $106.5 billion. The services surplus increased $0.6 billion in May to $28.9 billion.
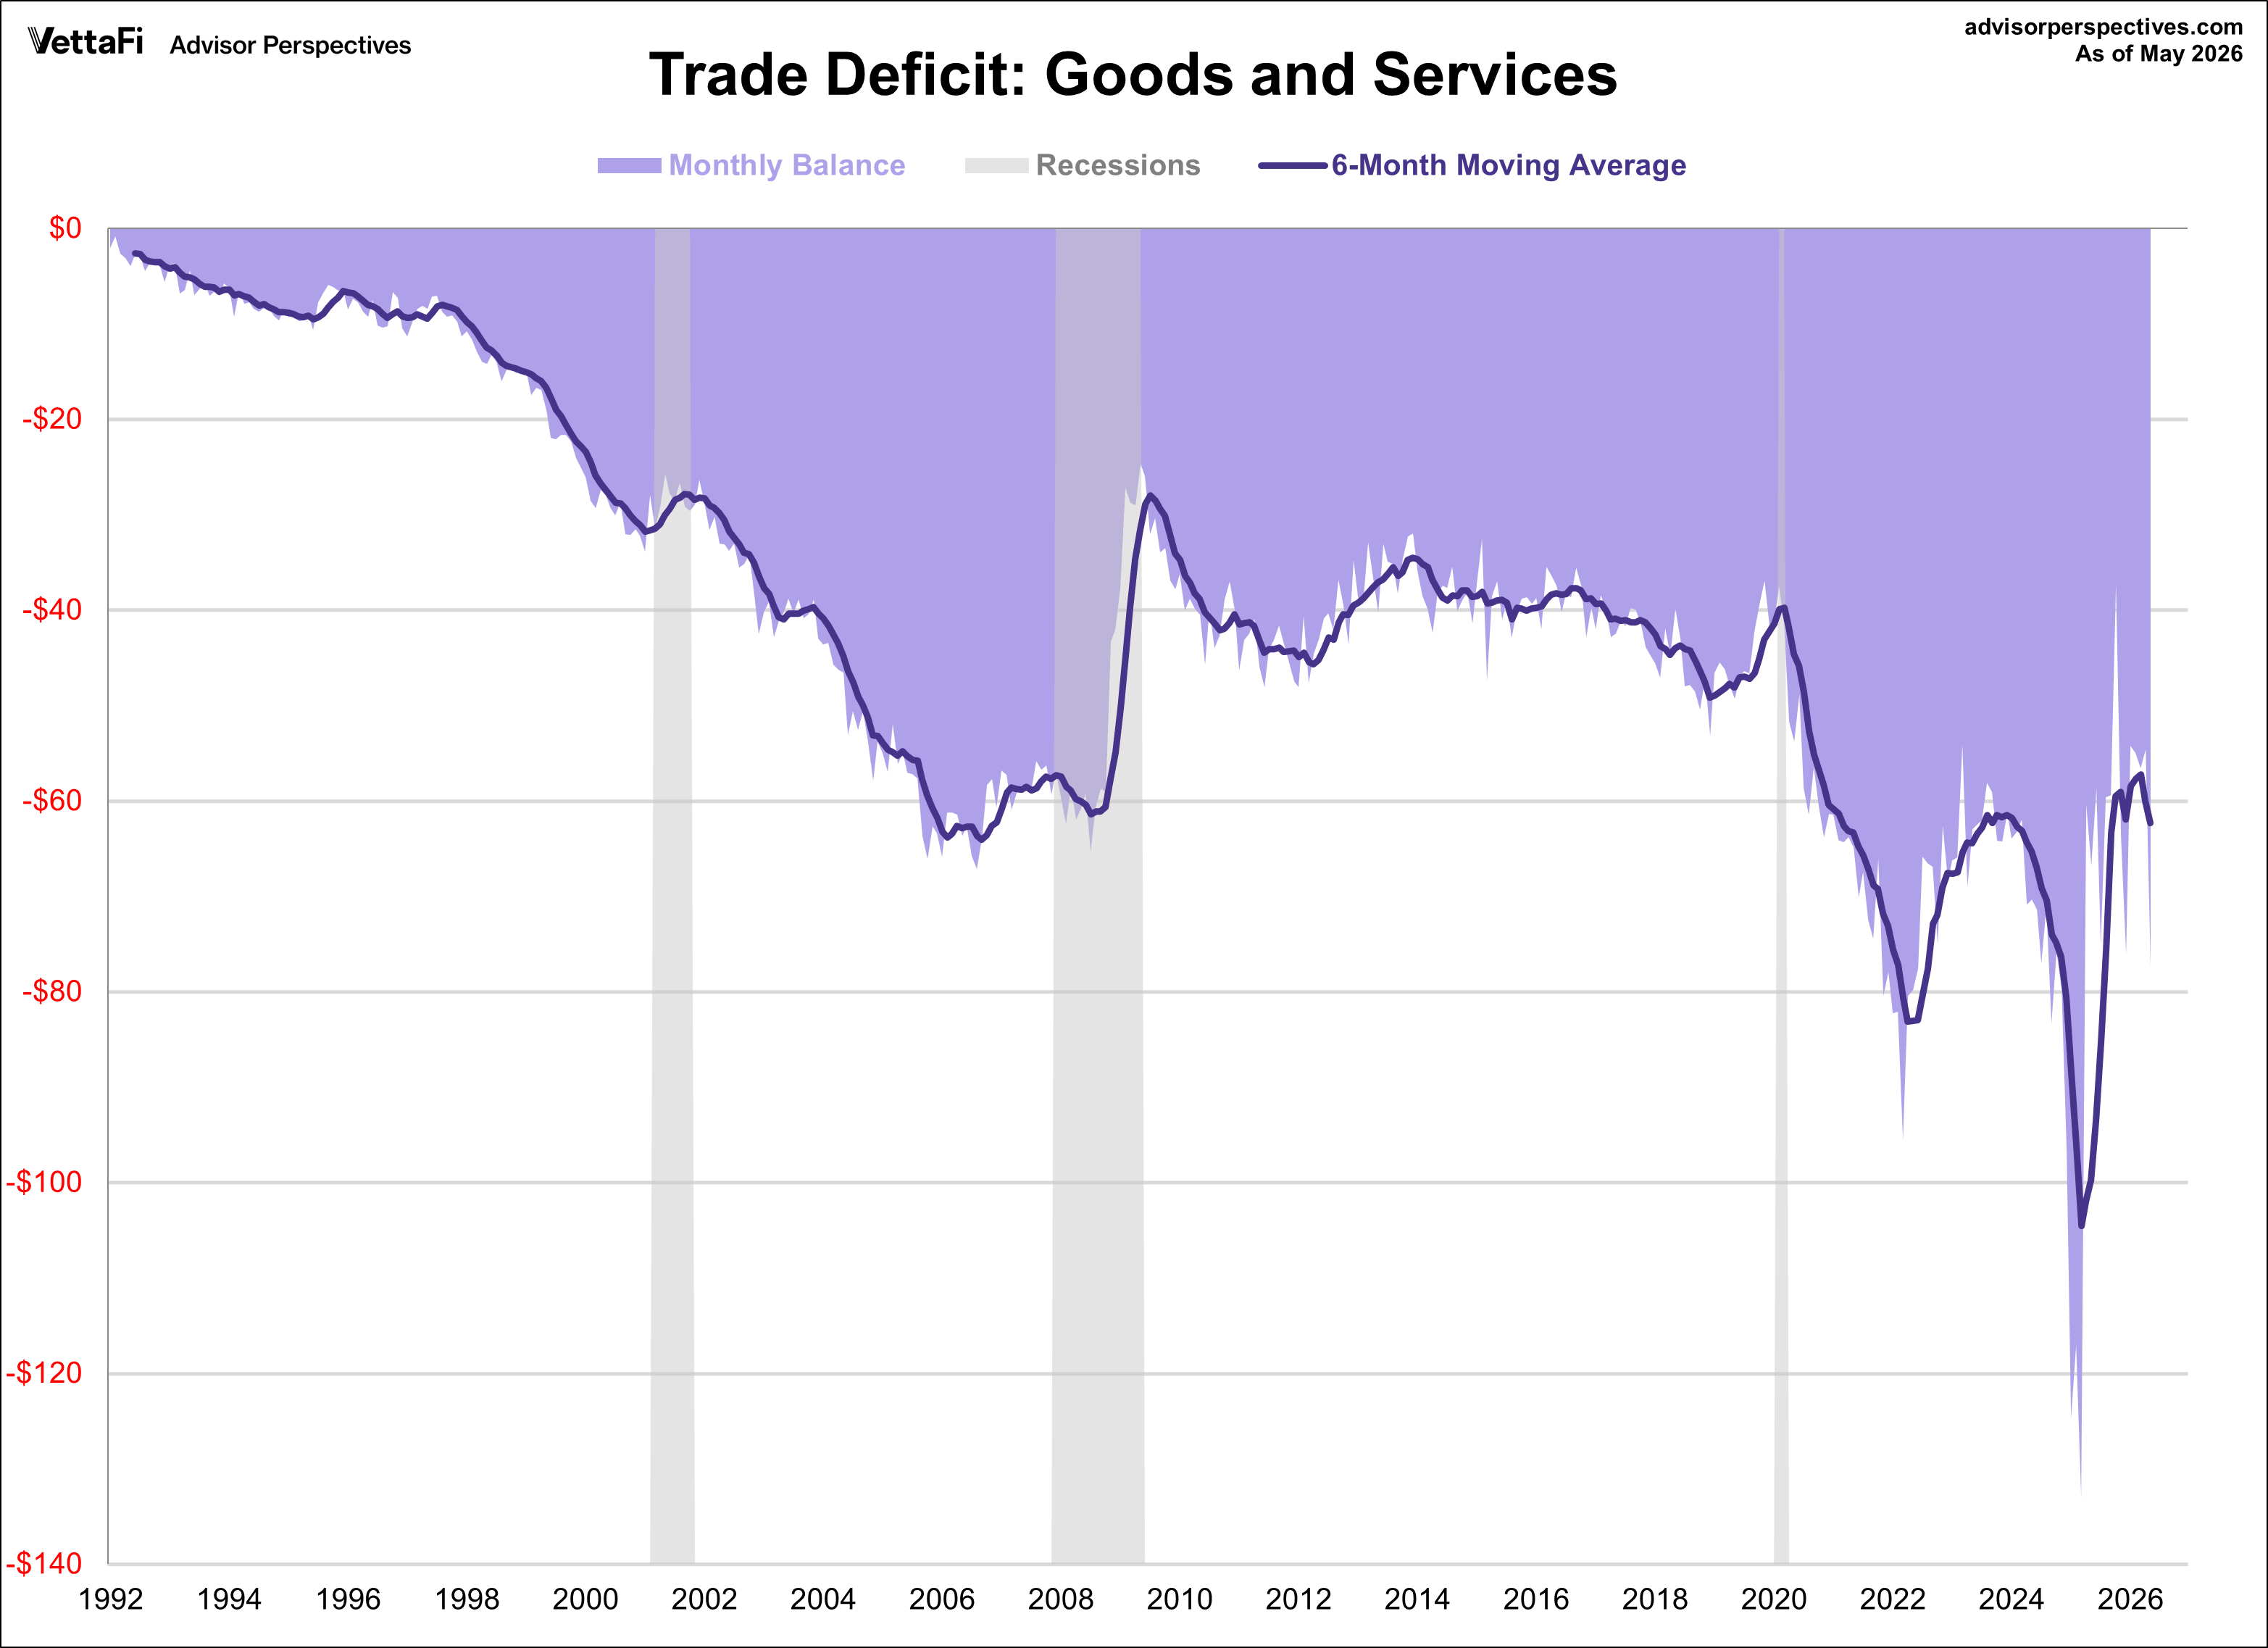
This indicator is somewhat volatile, with an 9.3% absolute average monthly change. The latest data point saw a 42.2% month-over-month change. Here is a snapshot that includes the six-month moving average which gives a better sense of the overall trend. The latest six-month moving average is at -$62.33B.
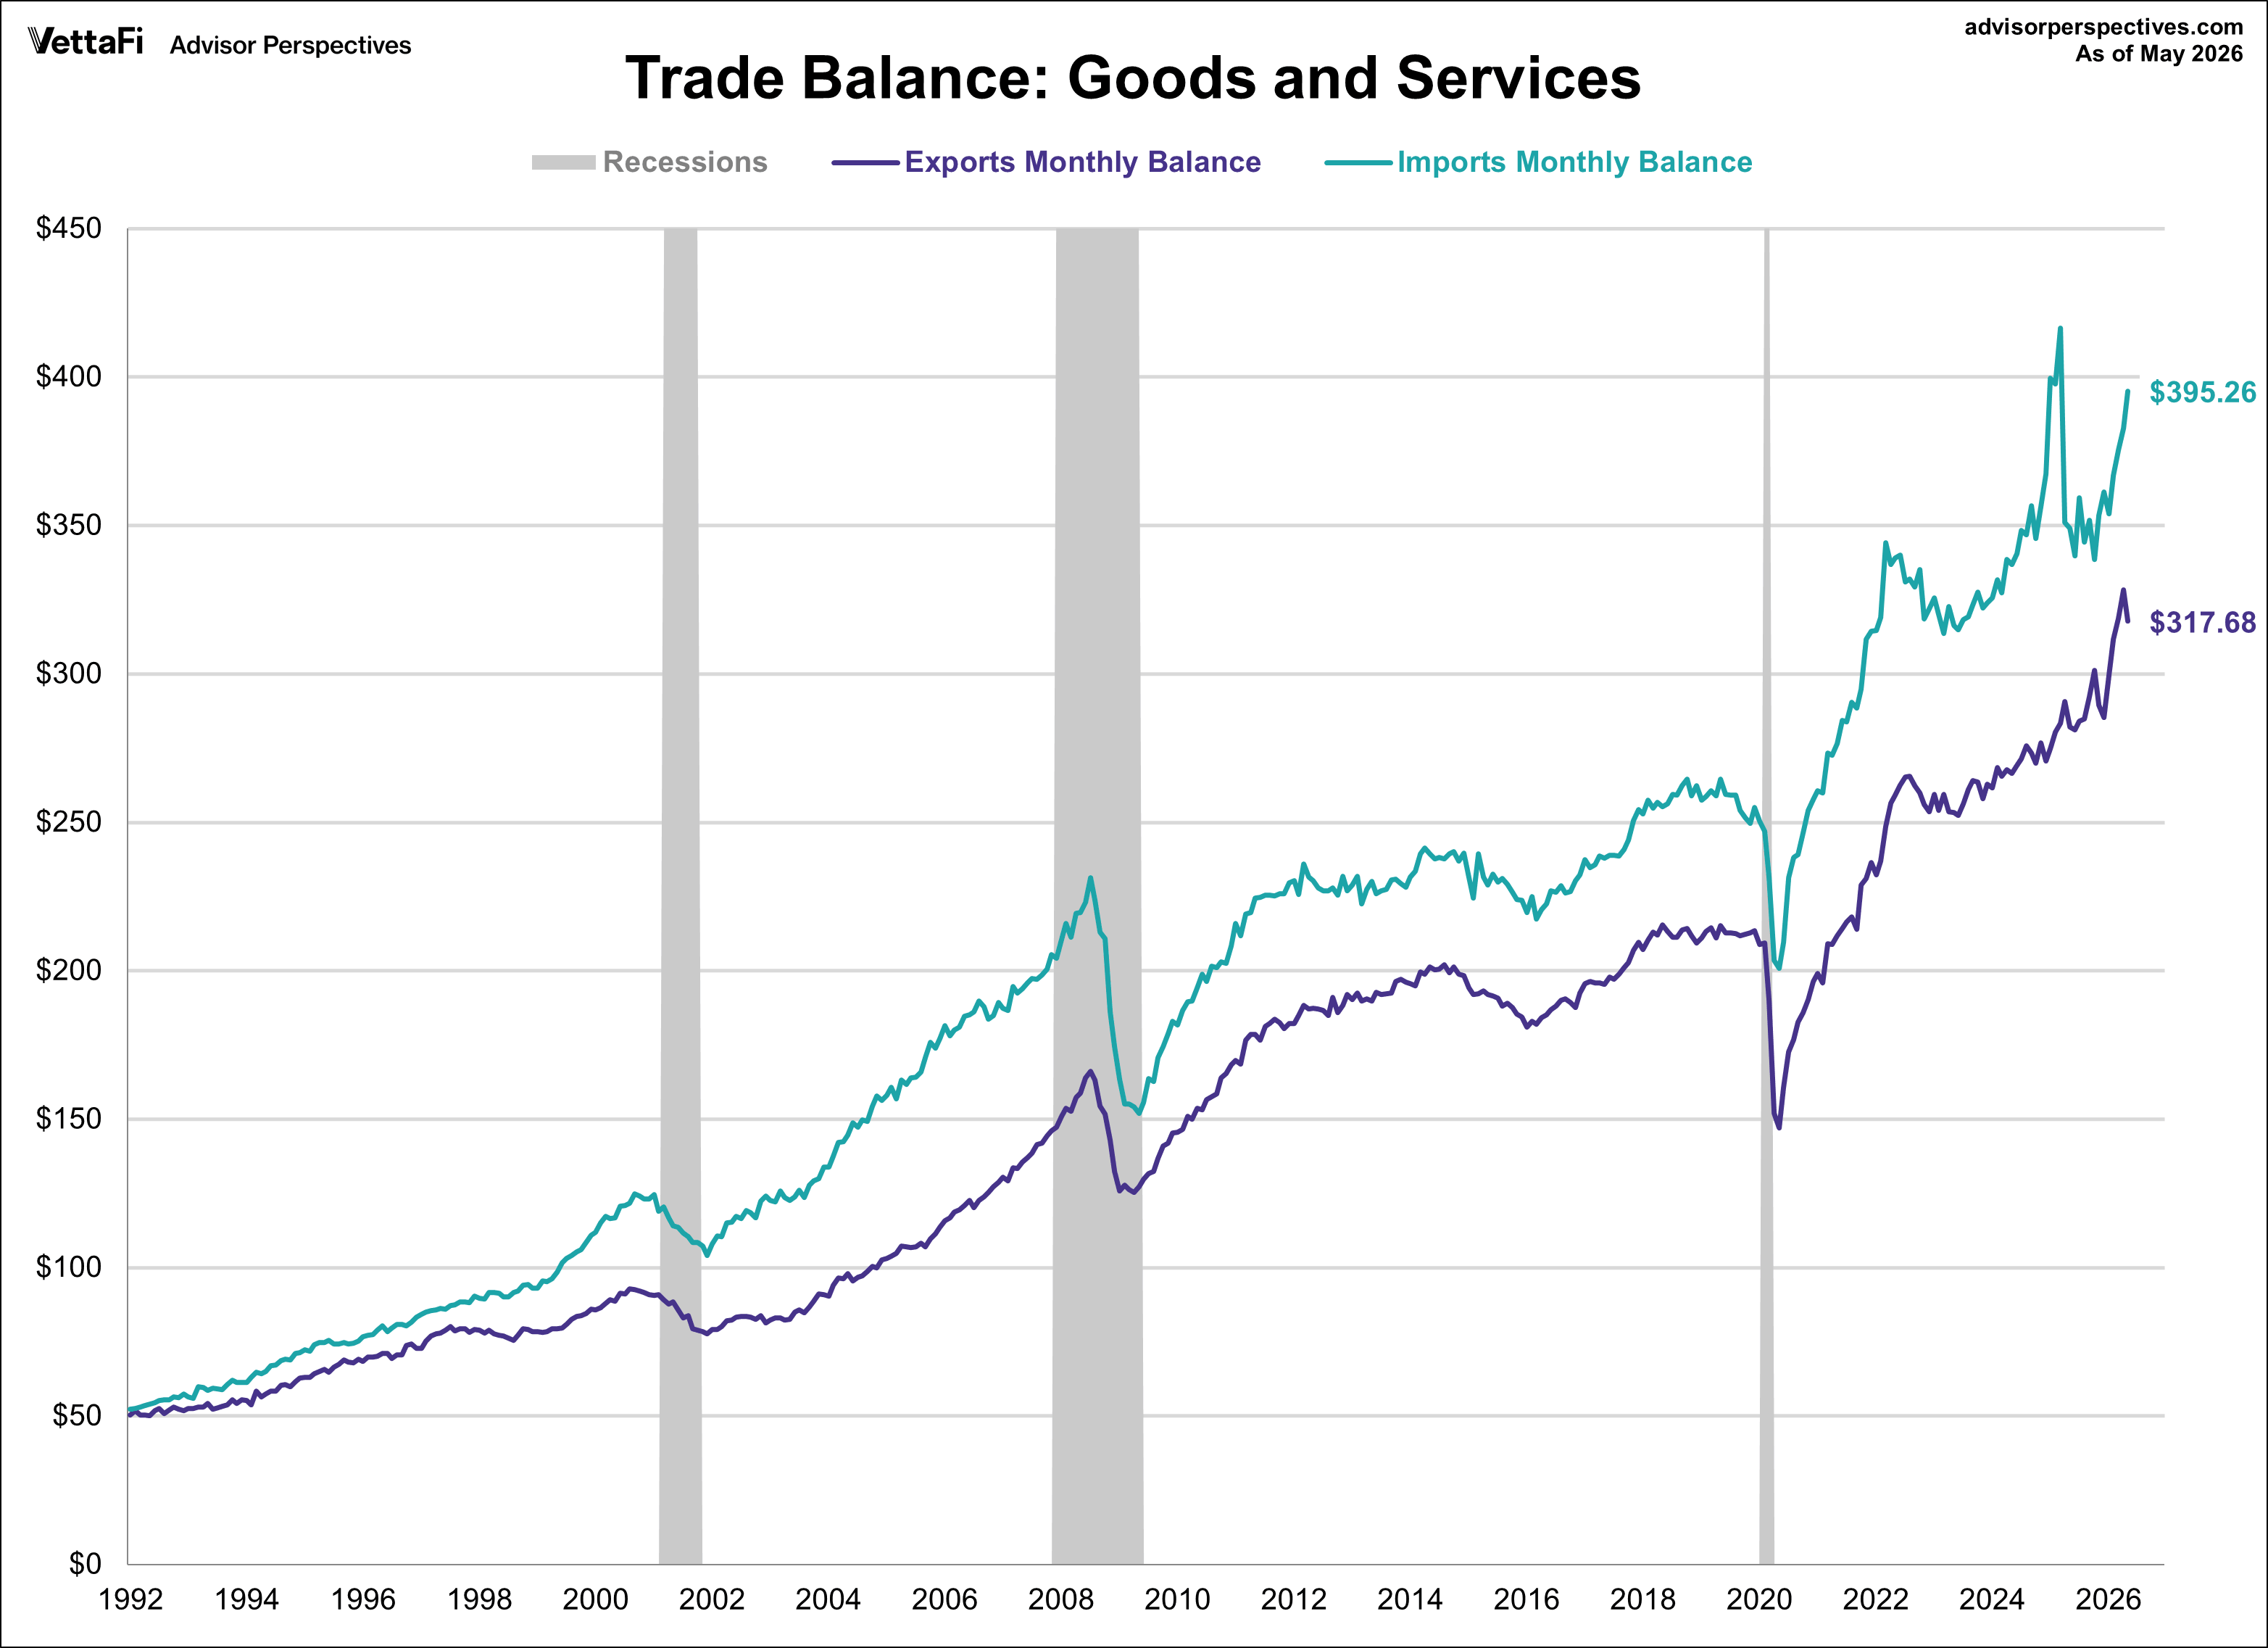
As mentioned earlier, the trade balance measures the difference in value between imported and exported goods and services. In May, imports were up $12.51 billion (3.3%) to $395.26B, the highest level since March 2025. Meanwhile, exports declined by $10.51 billion (3.2%) to $317.68B. Since exports decreased and imports rose, the trade deficit increased.