Philadelphia Fed Manufacturing Index: Lowest Level of 2026
Membership required
Membership is now required to use this feature. To learn more:
View Membership BenefitsThe Philly Fed's Manufacturing Business Outlook Survey is a monthly survey of about 250 manufacturers in the Third Federal Reserve District, which covers eastern Pennsylvania, southern New Jersey, and Delaware. Participants of the survey indicate the relative level of general business conditions in the region. Since this is a diffusion index, negative readings indicate contraction, positive ones indicate expansion. While it focuses exclusively on business in this district, this regional survey gives a reliable direction of the broader Chicago Fed's National Activity Index.
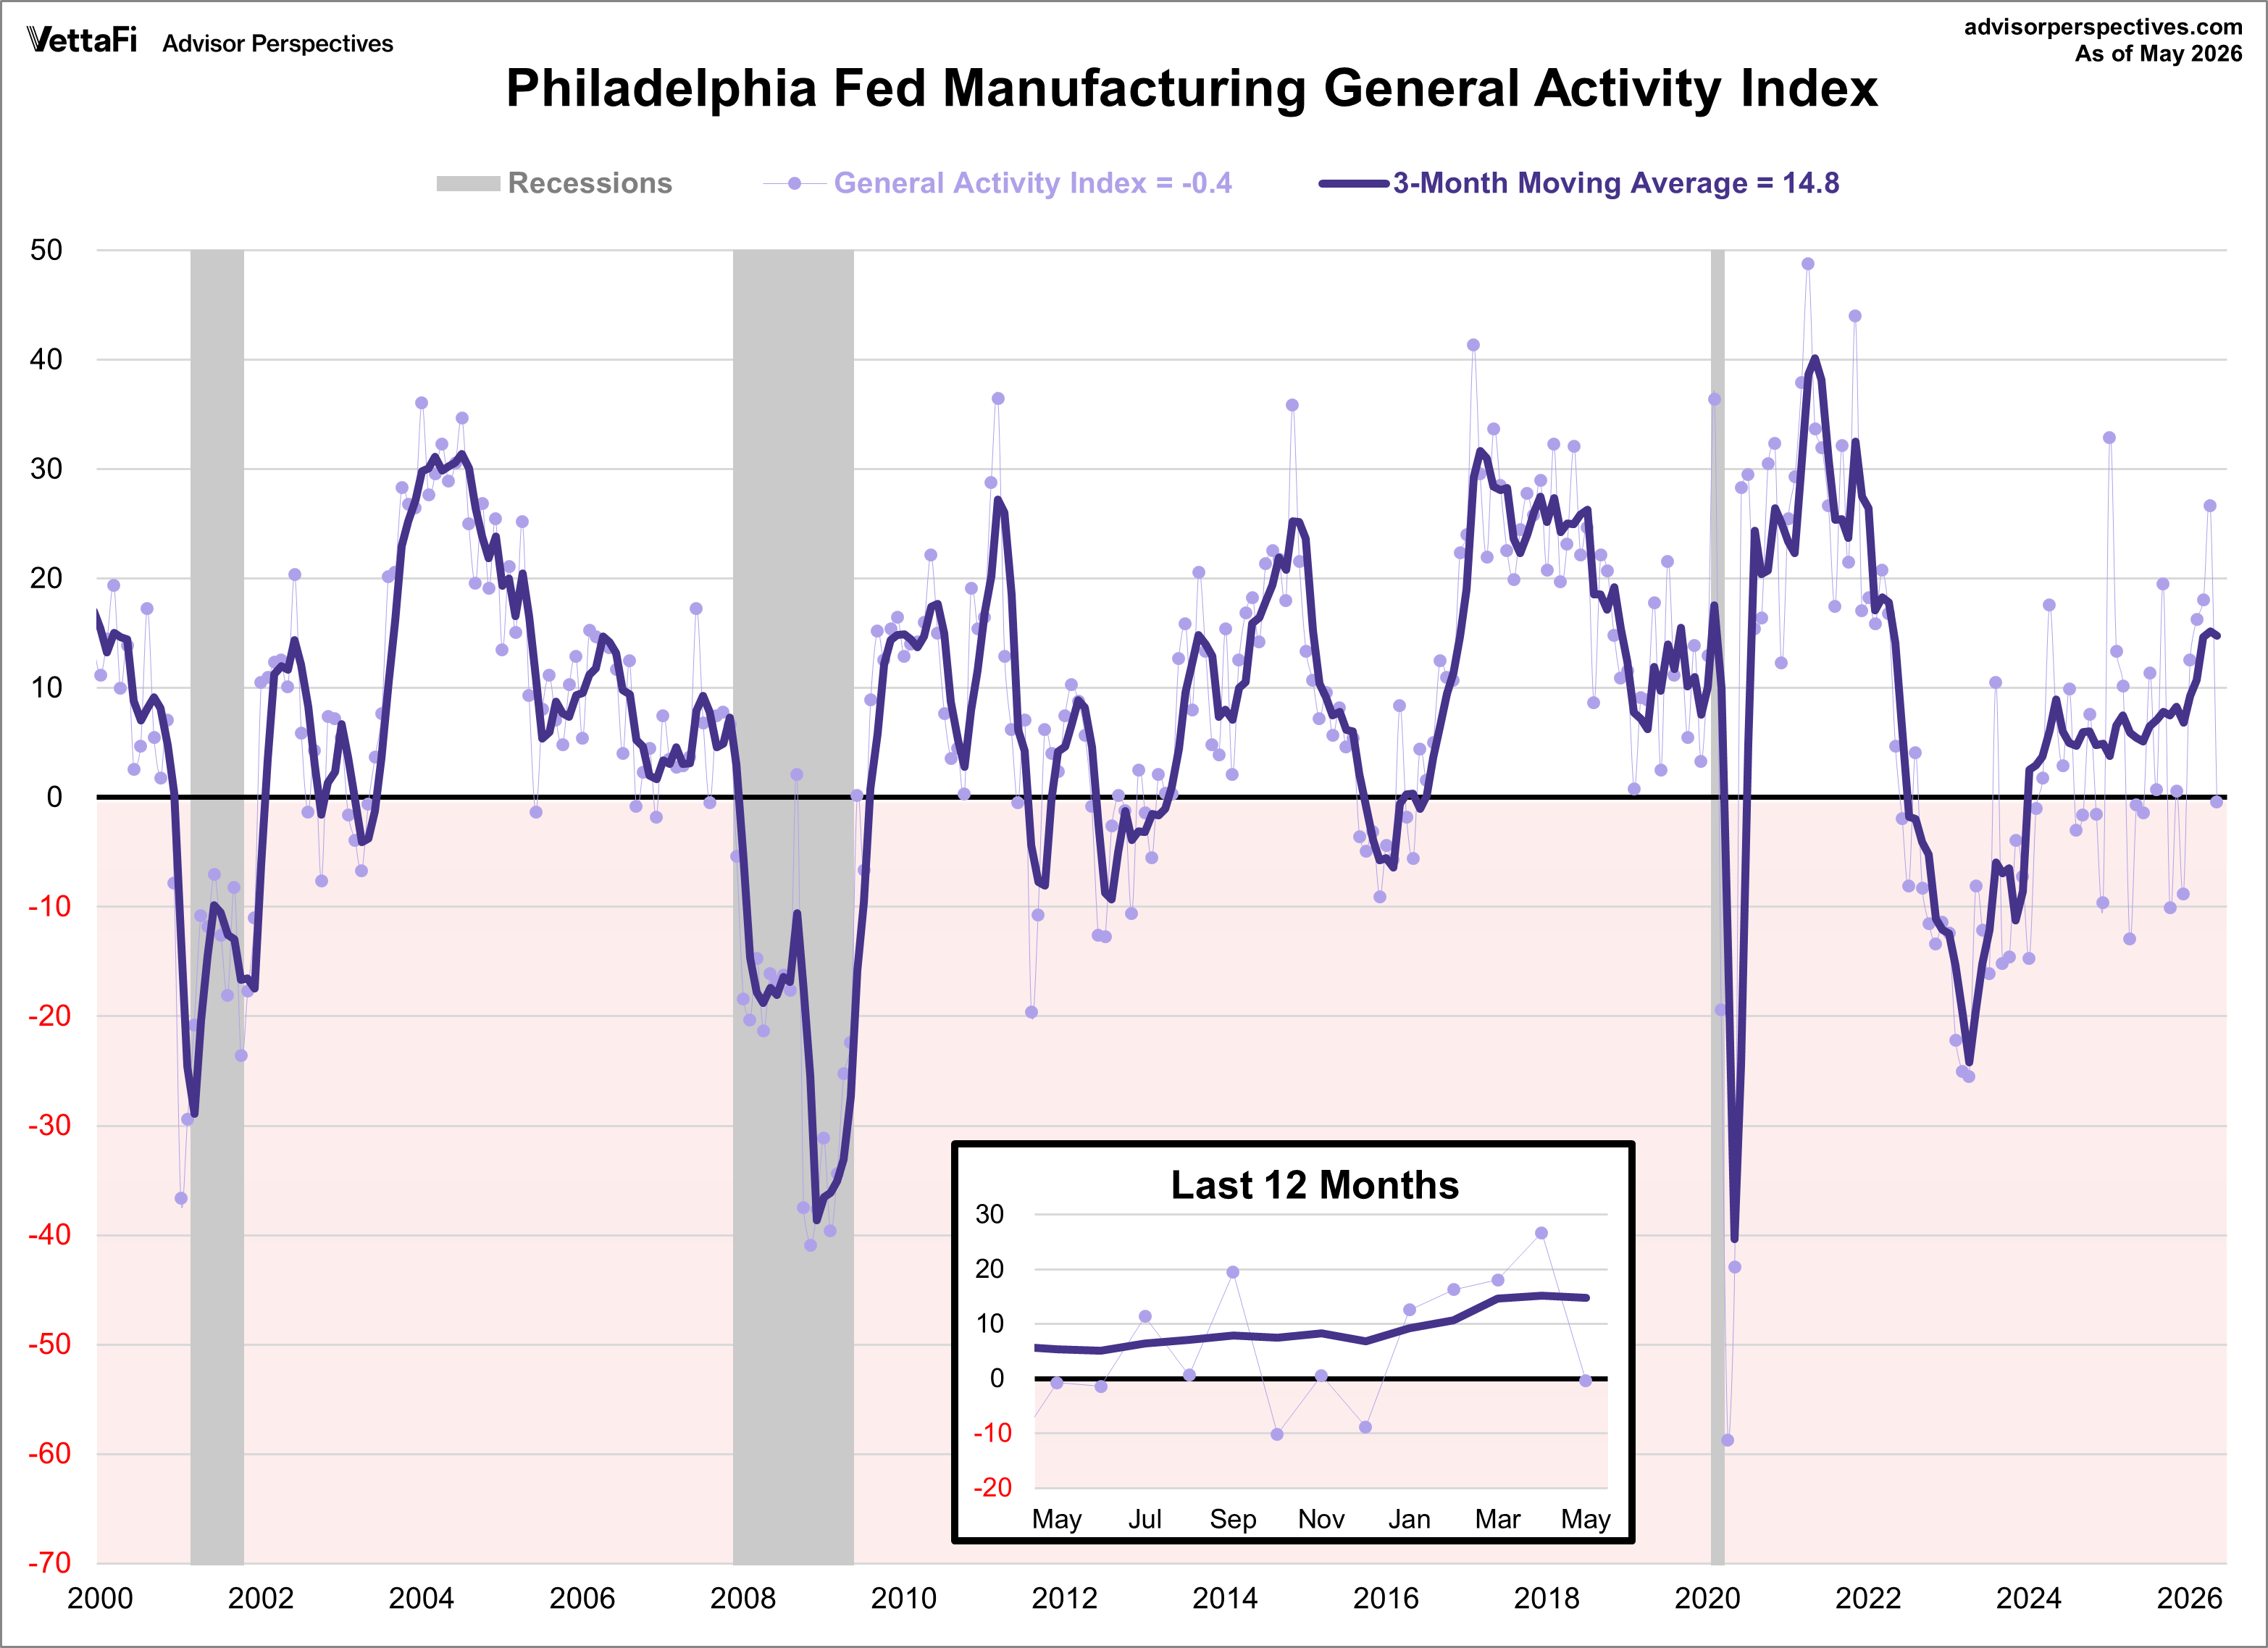
The latest Philadelphia Fed manufacturing index showed activity weakened in May, with the index sinking 27.1 points to -0.4. The latest reading marked the lowest level for the index this year and was worse than the forecast of 17.6.
Here is the summary from the survey:
Manufacturing activity in the region weakened overall, according to the firms responding to the May Manufacturing Business Outlook Survey. The survey’s indicators for general activity, new orders, and shipments all fell sharply this month. The employment index ticked up but remained negative, continuing to suggest overall declines in employment. Both price indexes declined this month but remained elevated. The firms continue to expect overall growth over the next six months, and most future indicators rose this month from already elevated readings.
The first chart below gives us a look at this diffusion index since 2000, which shows us how it has behaved in proximity to the three 21st century recessions. The green dots show the indicator itself, which is quite noisy. Therefore, we've included the three-month moving average (purple line), which is more useful as an indicator of coincident economic activity. We can see longer and deeper periods of contraction during each of the recessions with shallower contractions in '02, '03, '11, '12, '13, and '15. More recently, the index's 3-month moving average contracted from July 2022 to December 2023 however no recession was called during that time.
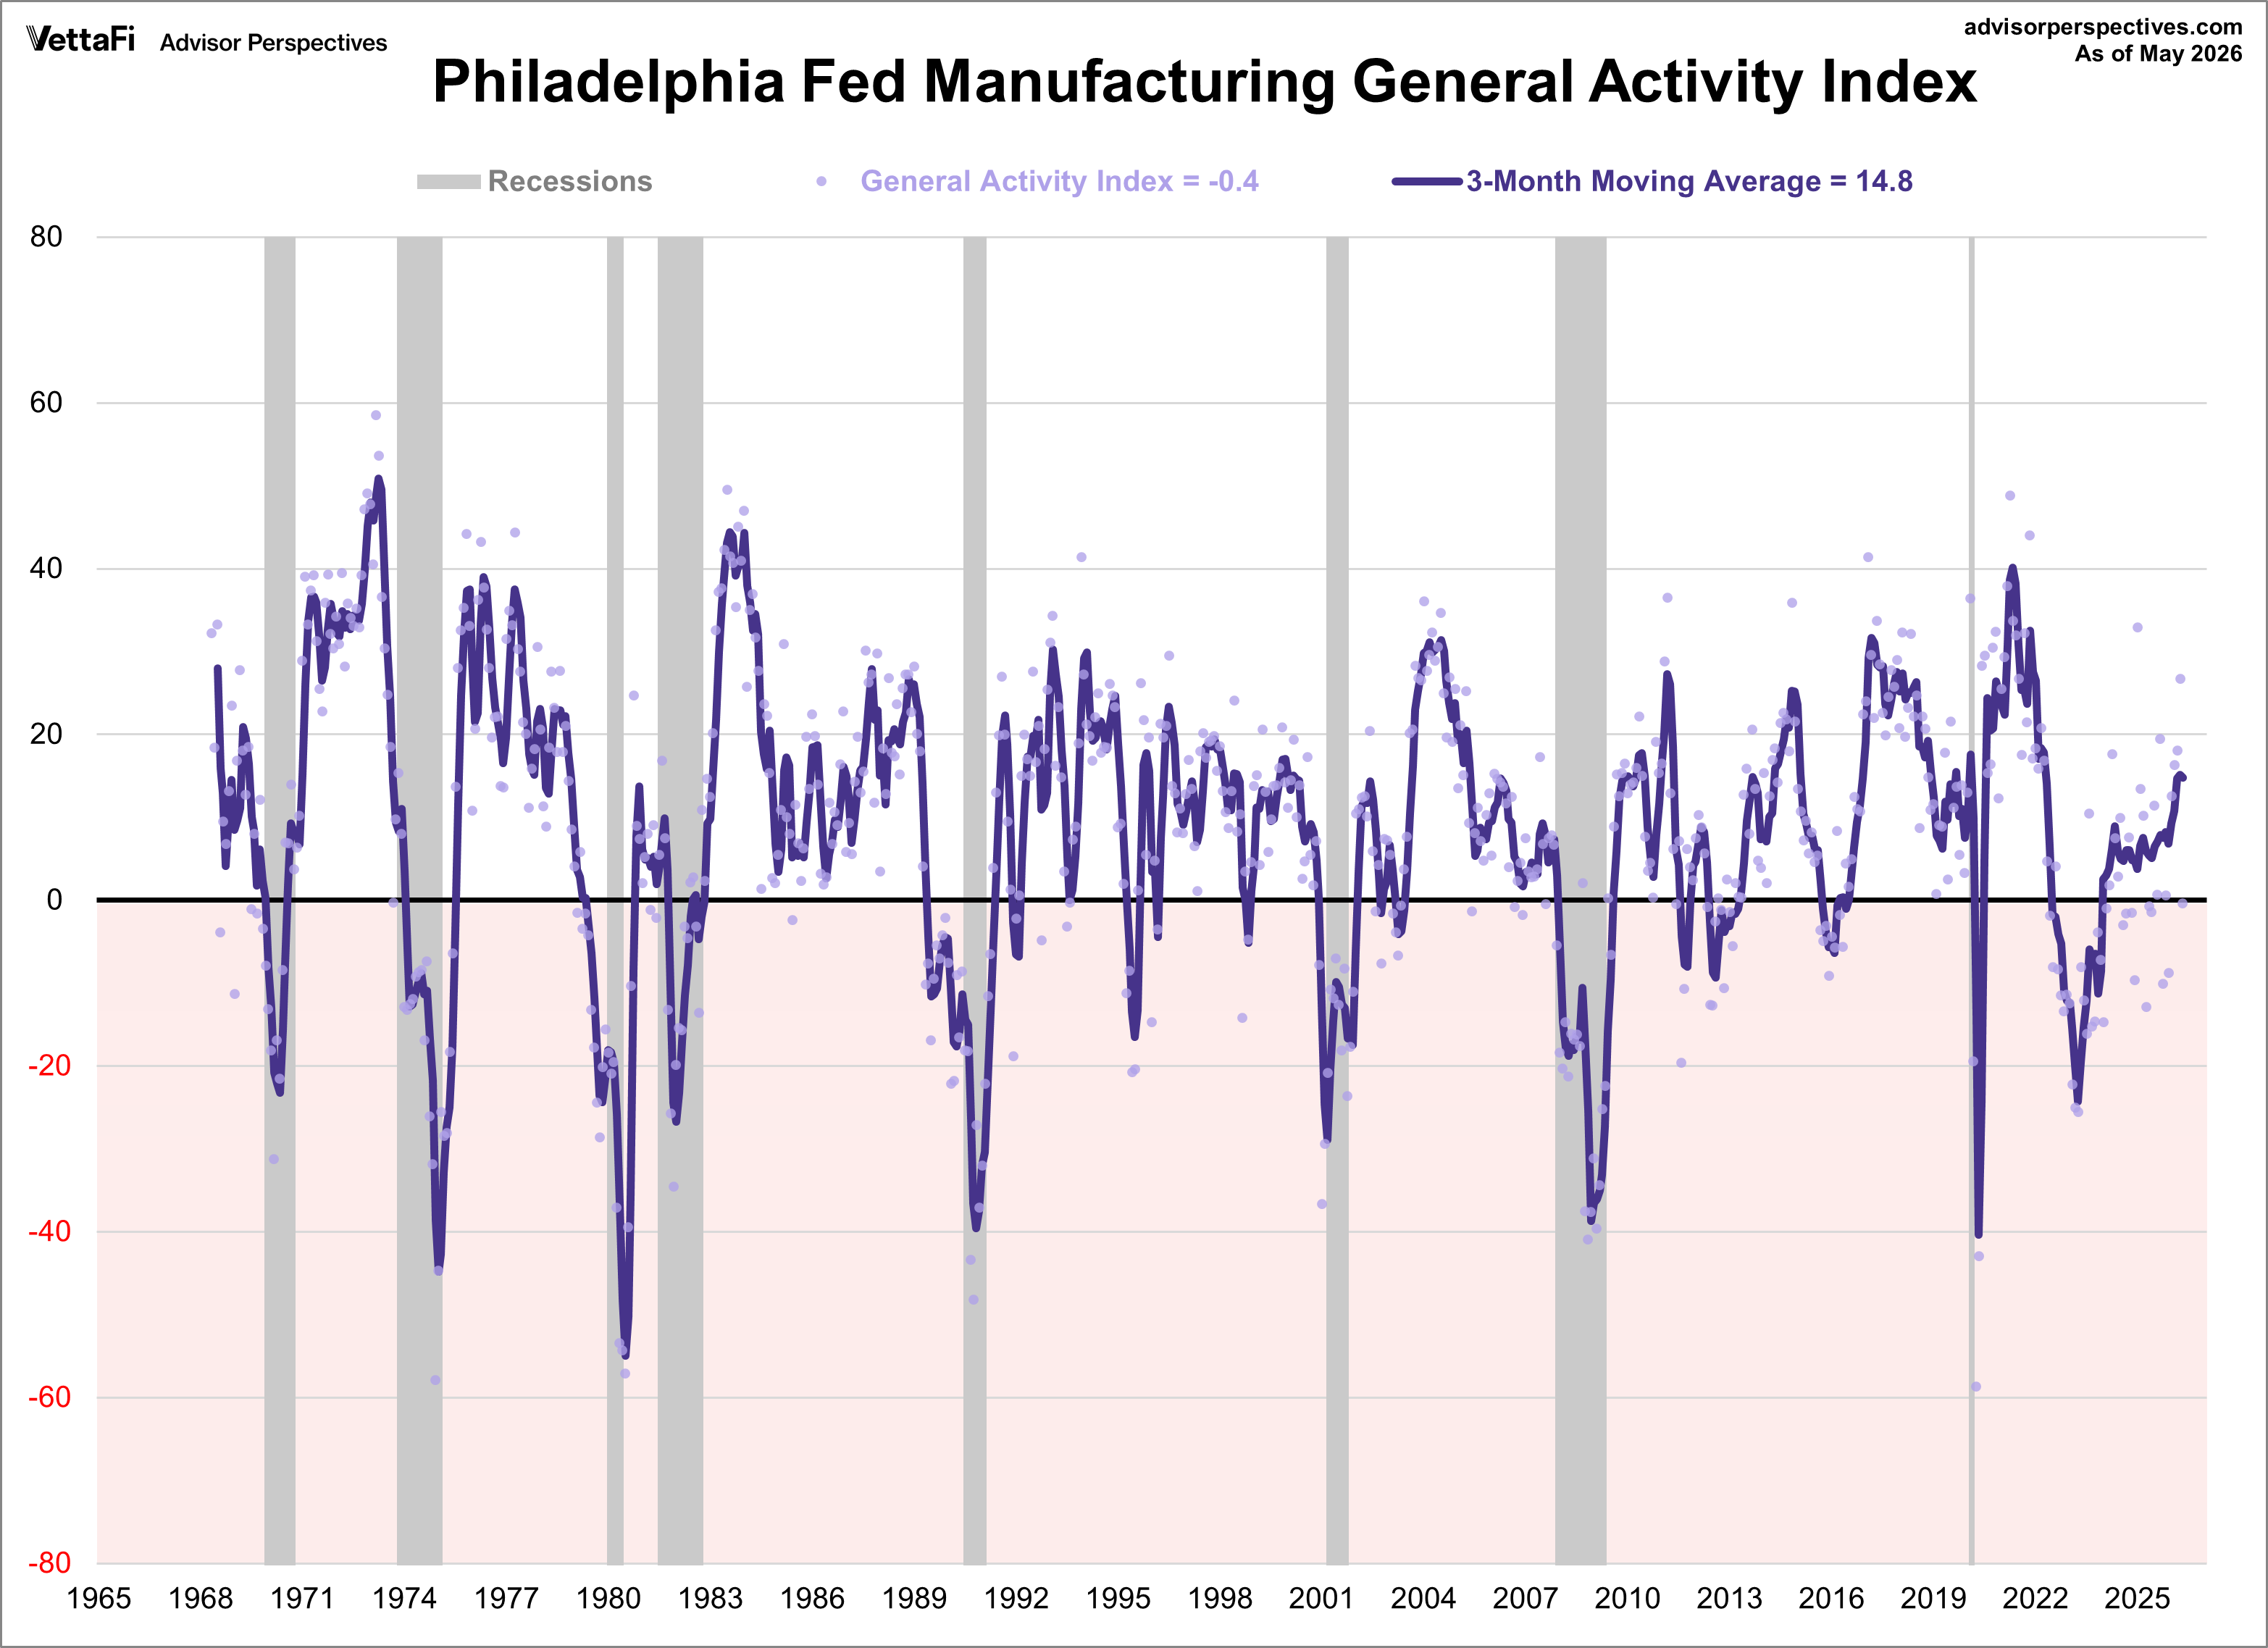
In the next chart, we see the complete series, which dates from May 1960. For proof of the high volatility of the headline indicator, note that the average absolute monthly change across this data series is 8.2.
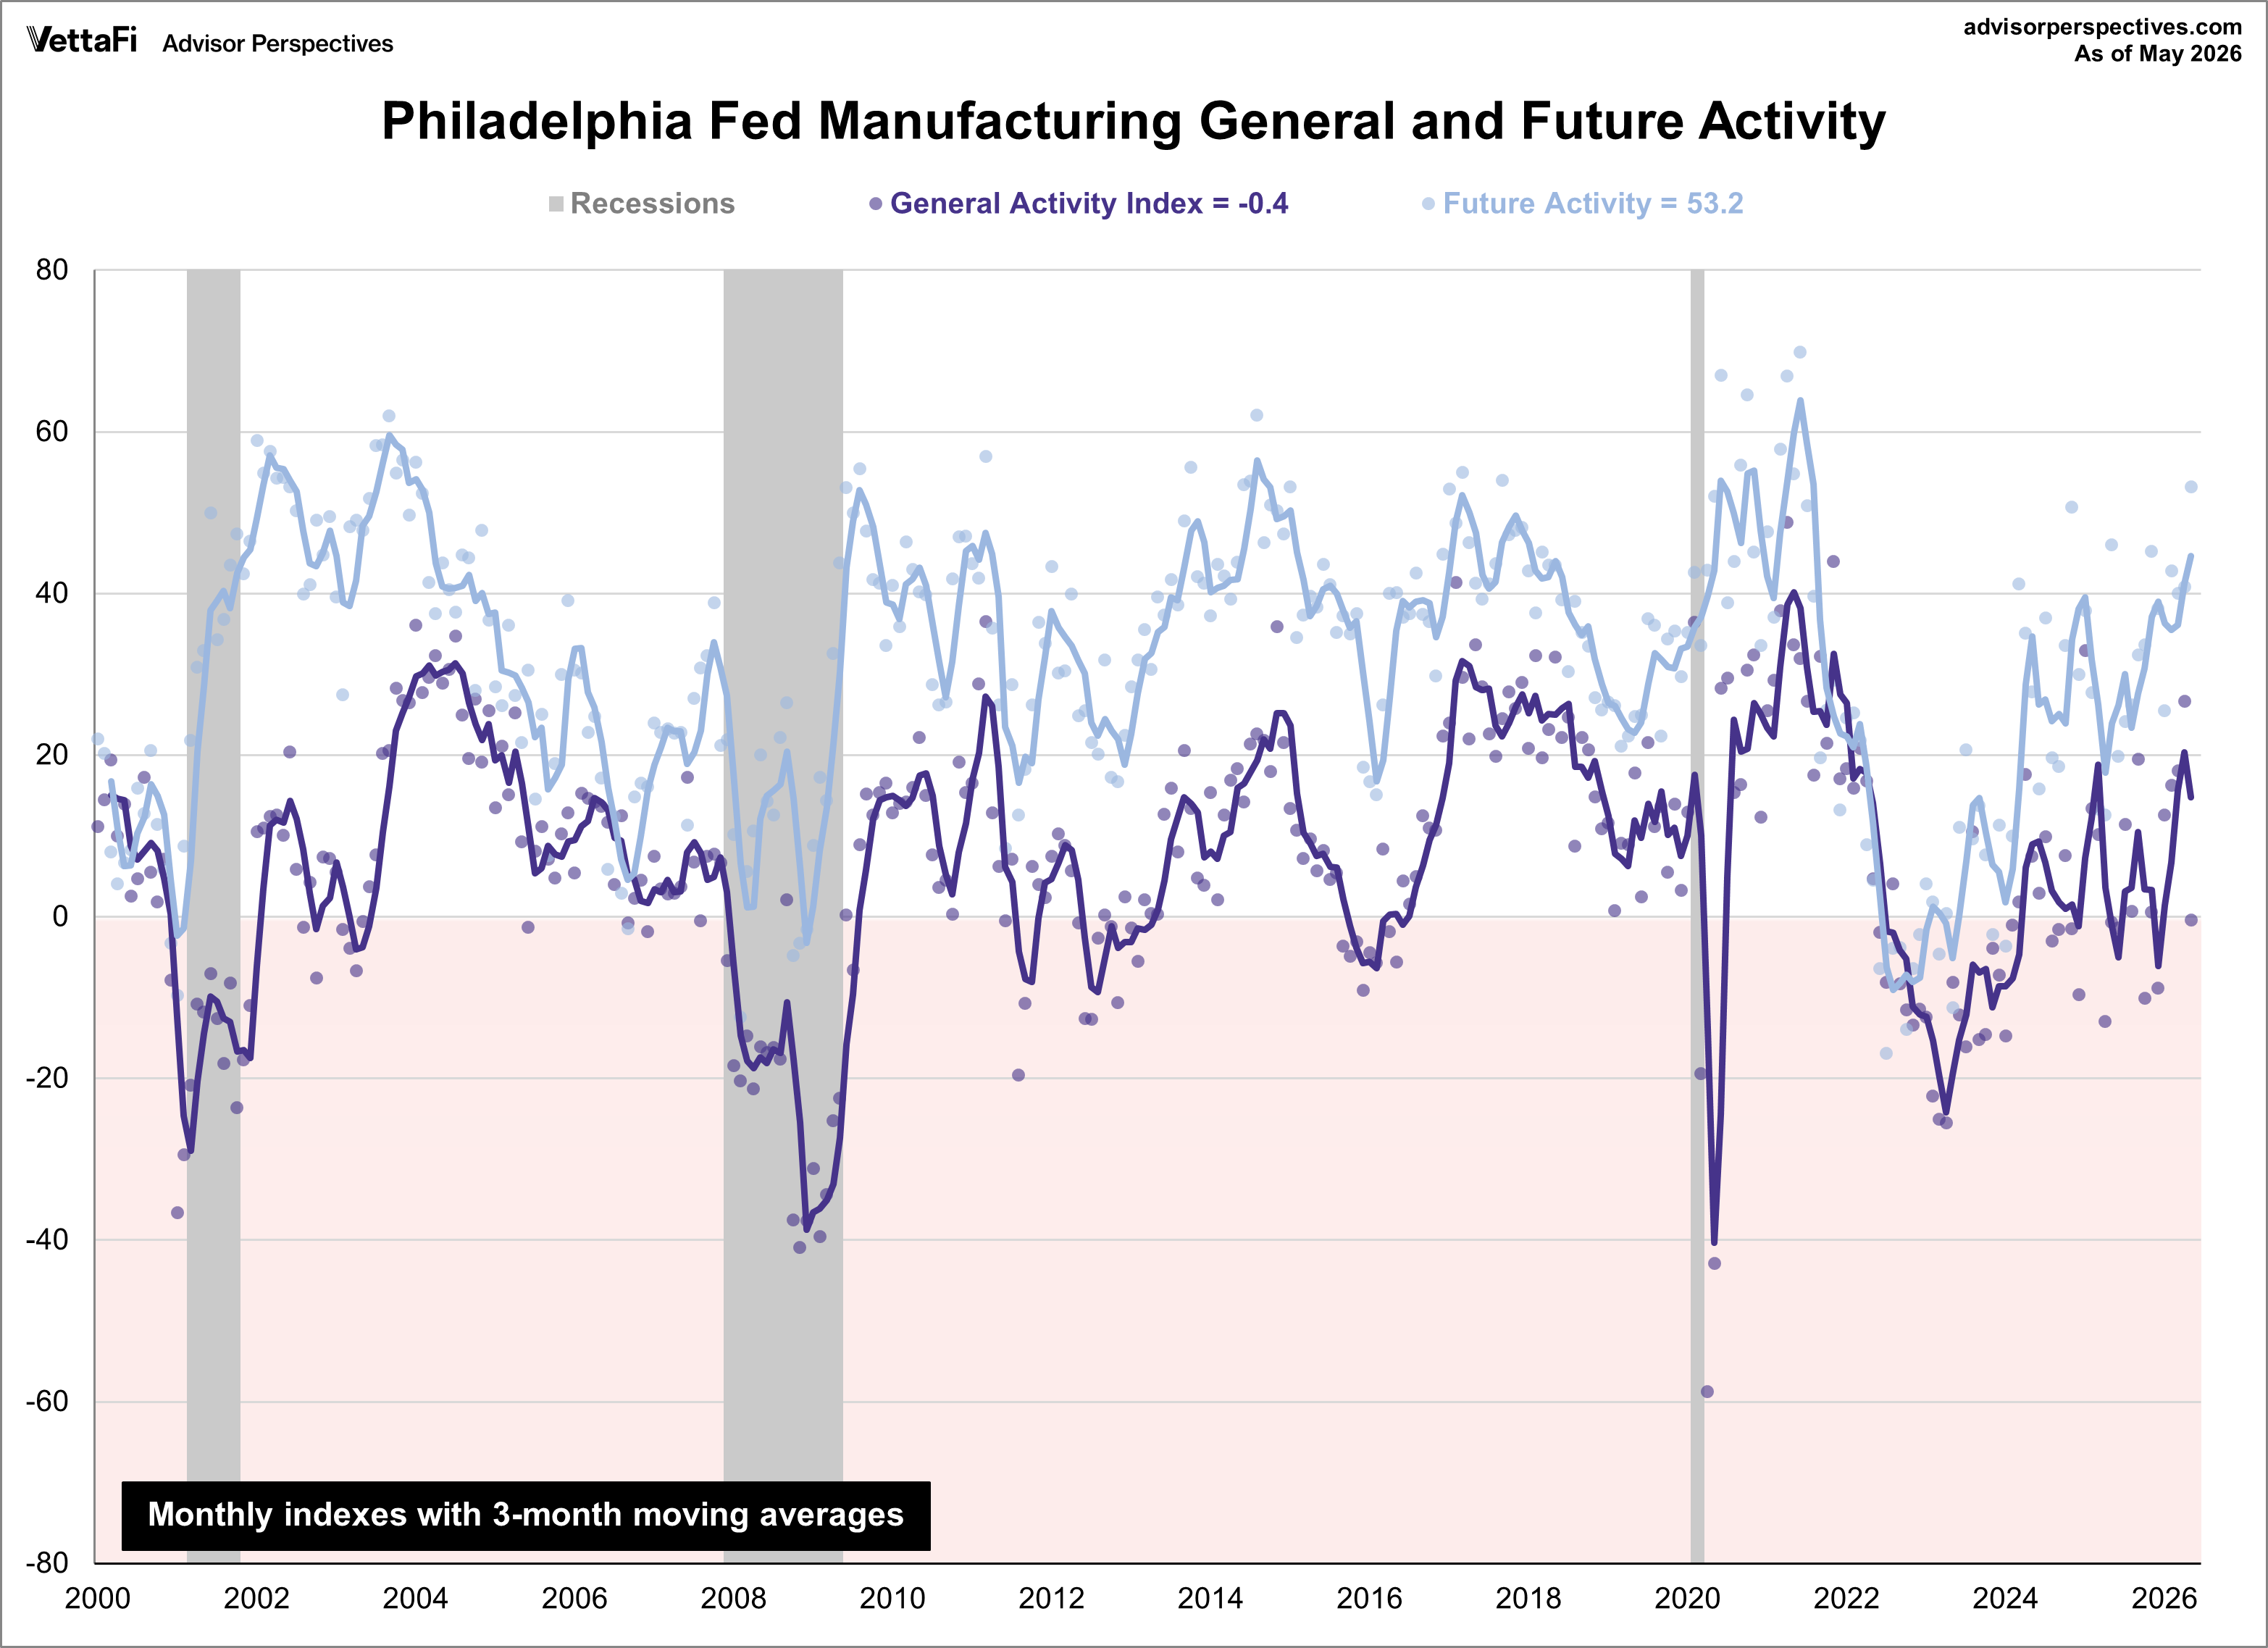
The next chart is an overlay of the General Activity Index and the Future General Activity Index — the outlook six months ahead.
Most Future Indicators Strengthen Further
The diffusion index for future general activity rose 12 points to 53.2 this month, its highest reading since June 2021. Almost 67 percent of the firms expect an increase in activity over the next six months (up from 57 percent last month), exceeding the 13 percent that expect a decrease (down from 16 percent); 18 percent expect no change (down from 25 percent). The future new orders index increased 8 points to 53.5, and the future shipments index rose 5 points to 45.7. The firms continue to expect increases in employment over the next six months, but the future employment index moved down 4 points to 31.7. Both future price indexes moved higher above their long-run averages. The future prices paid index jumped 20 points from 50.2 to 70.0, its highest reading since November. The future prices received index moved up from 50.2 to 60.5. The index for future capital expenditures declined 4 points to 30.9.
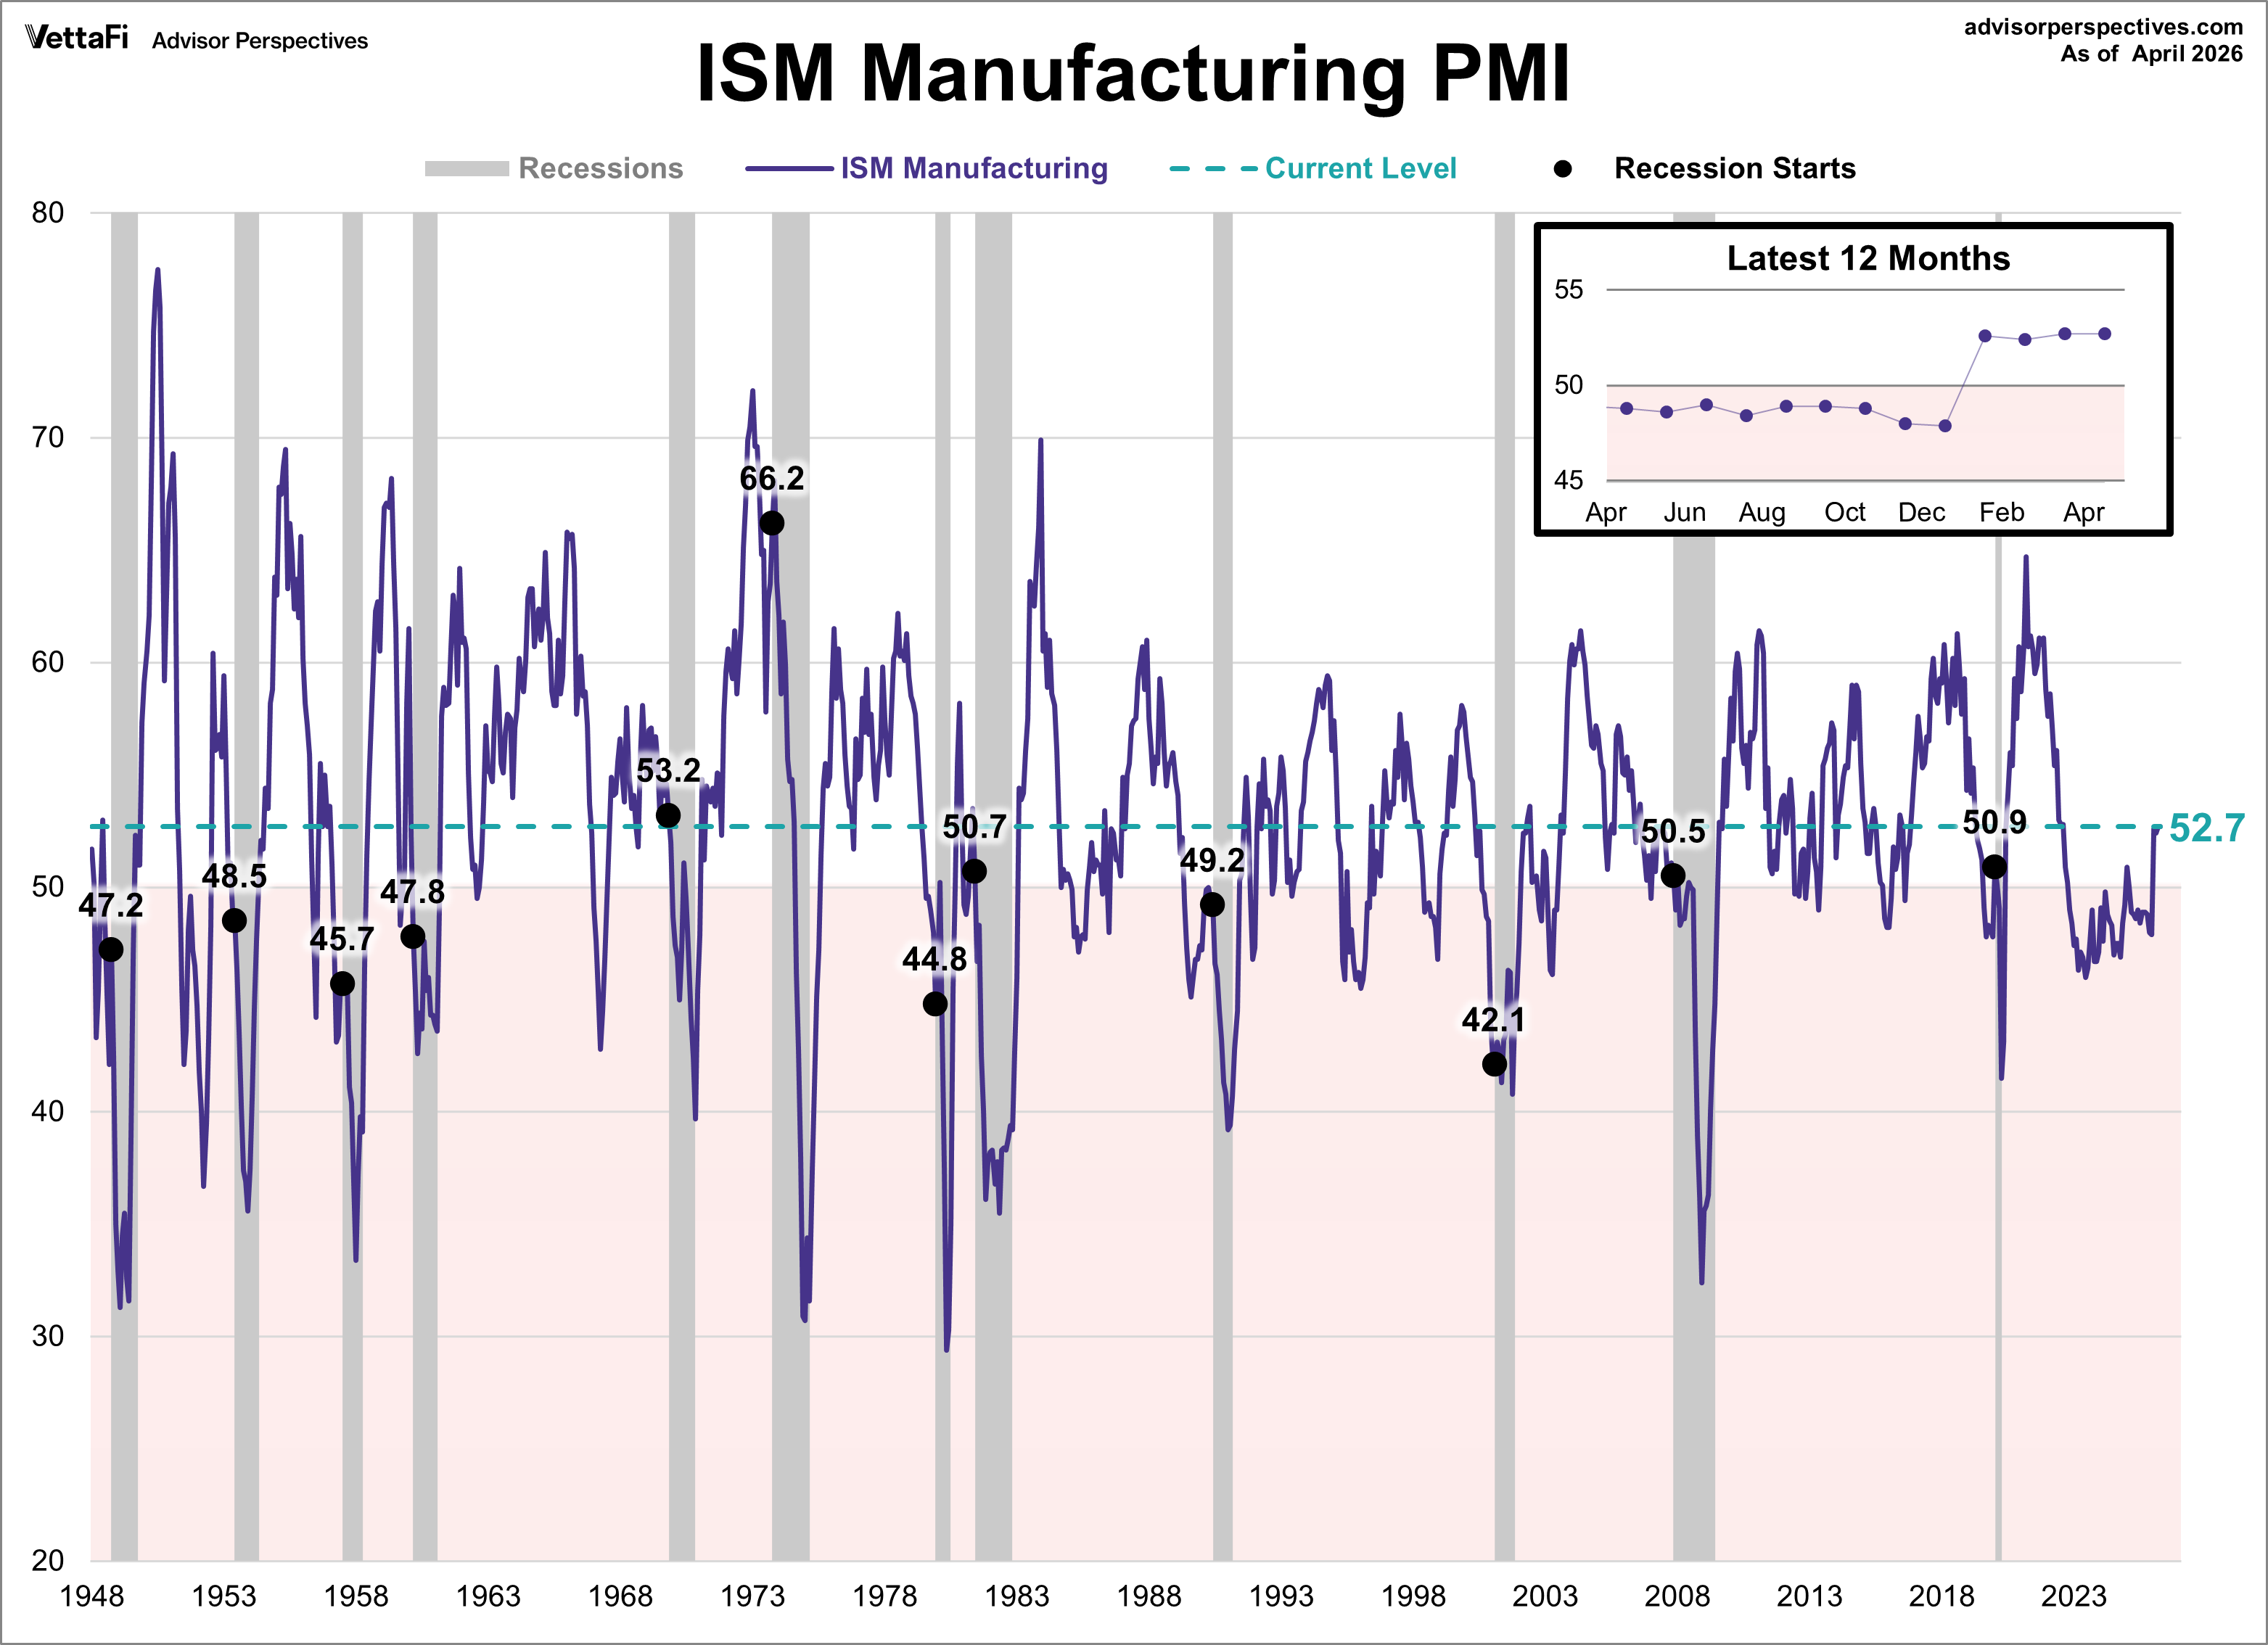
For comparison, here is the latest ISM Manufacturing survey.
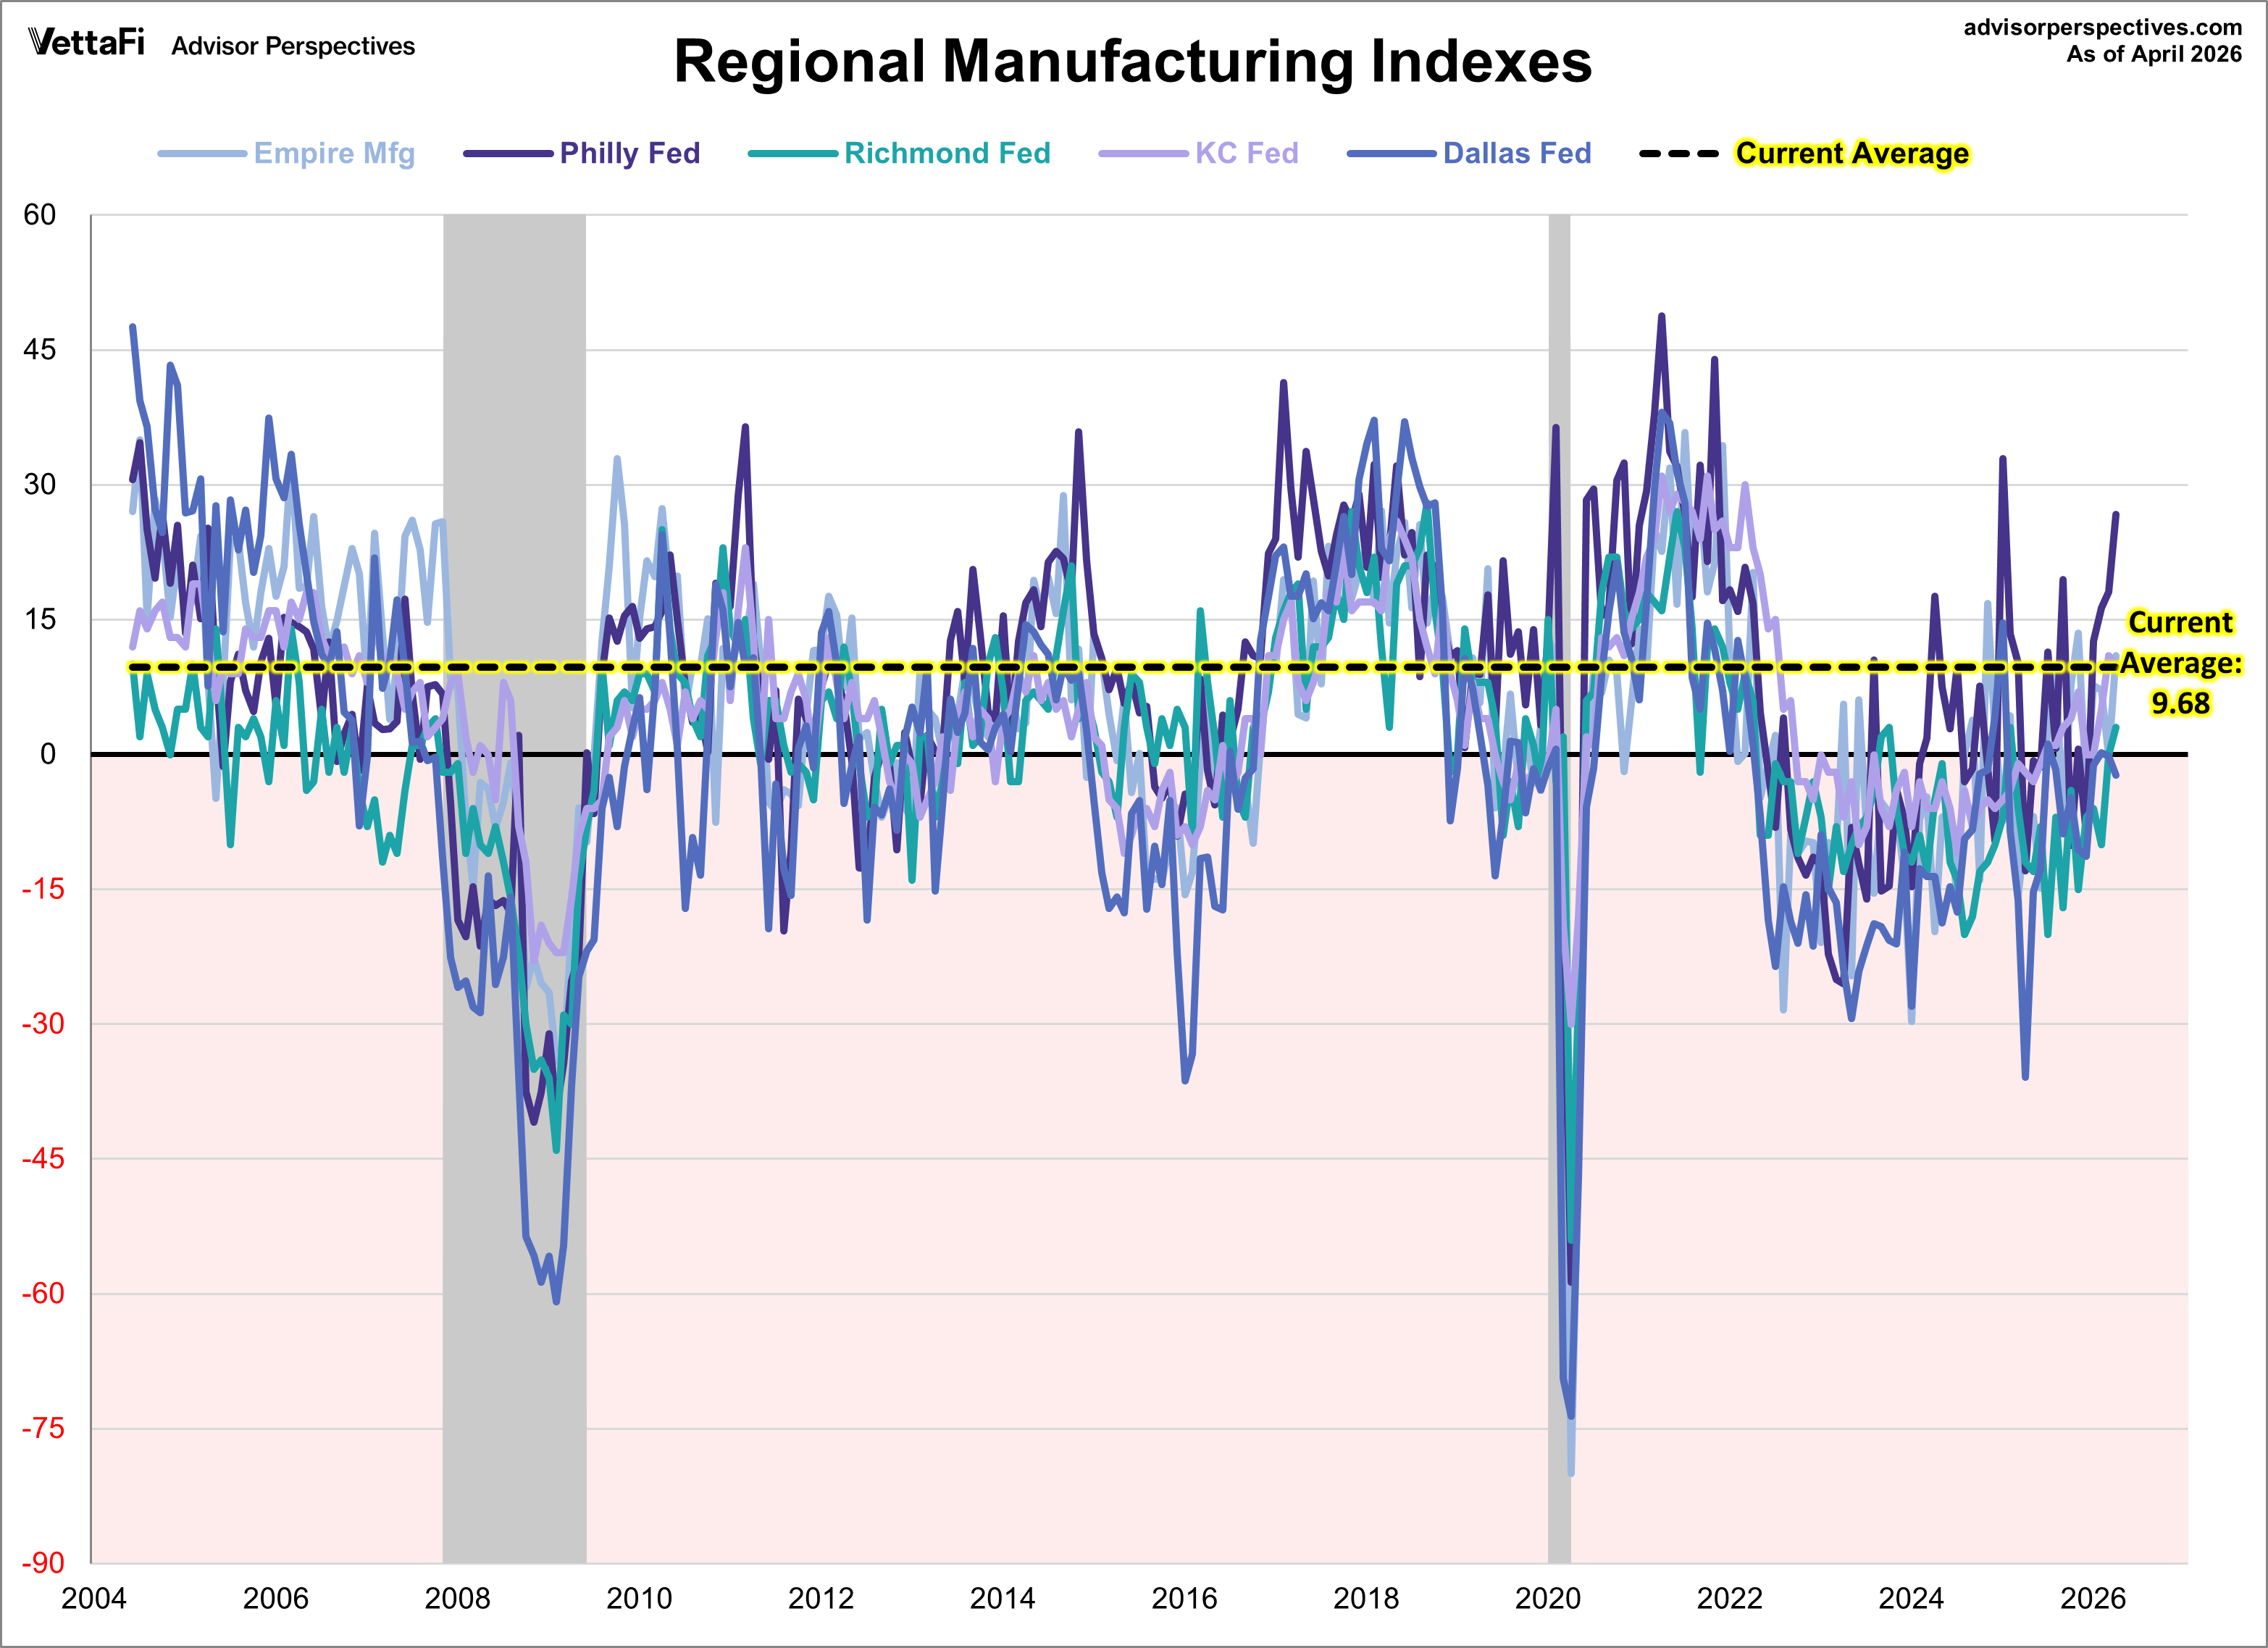
Let's compare all five Regional Manufacturing indicators. Here is a three-month moving average overlay of each since 2004 (for those with data).
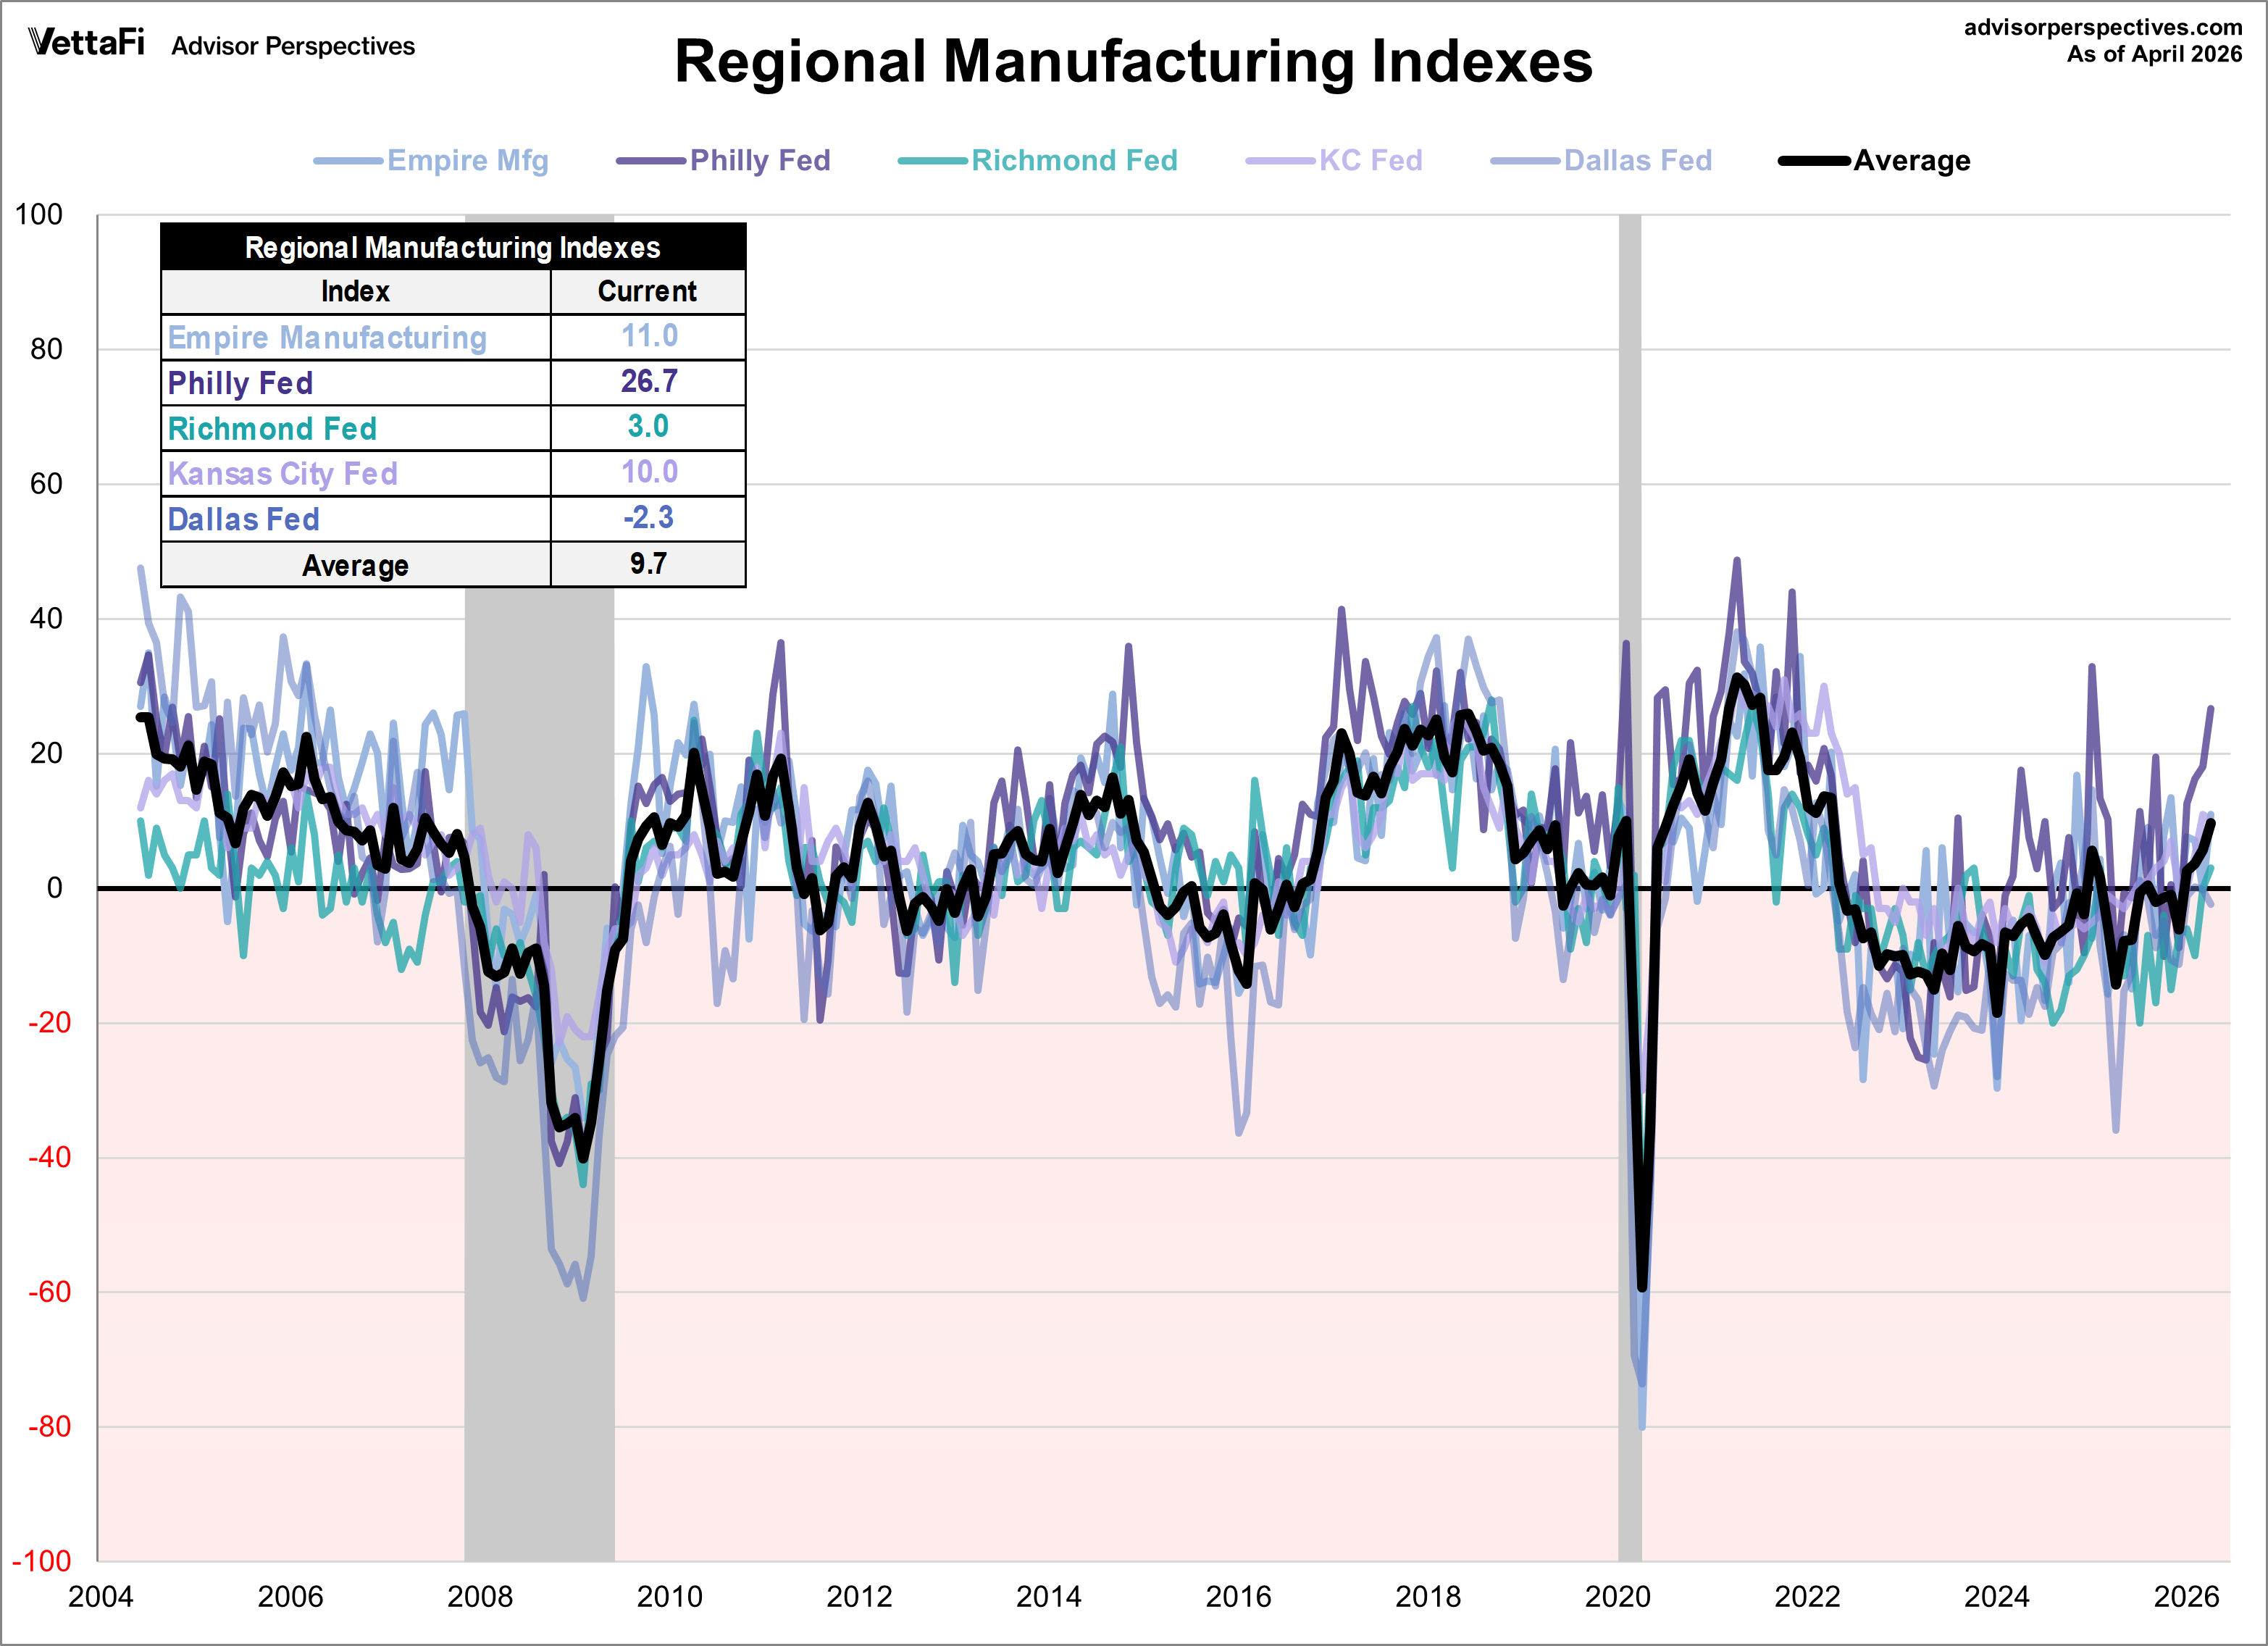
Here is the same chart including the average of the five. Readers will notice the range in expansion and contraction between all regions.
ETFs associated with industrials and manufacturing include: First Trust Industrials/Producer Durables AlphaDEX Fund (FXR), Industrial Select Sector SPDR Fund (XLI), Vanguard Industrials ETF (VIS), and iShares U.S. Industrials ETF (IYJ).
Here are the remaining four monthly manufacturing indicators that we track:
Kansas City Manufacturing Survey
Membership required
Membership is now required to use this feature. To learn more:
View Membership BenefitsSponsored Content
Editorial Calendar
View Full Calendar Eastern Time Zone
+ Add the editorial calendar to your Google Calendar.
Upcoming Virtual Events View All


