What are the long-term trends for multiple jobholders in the US? The Bureau of Labor Statistics has three decades of historical data to enlighten us on that topic, courtesy of table A-16 in the monthly Current Population Survey of households.
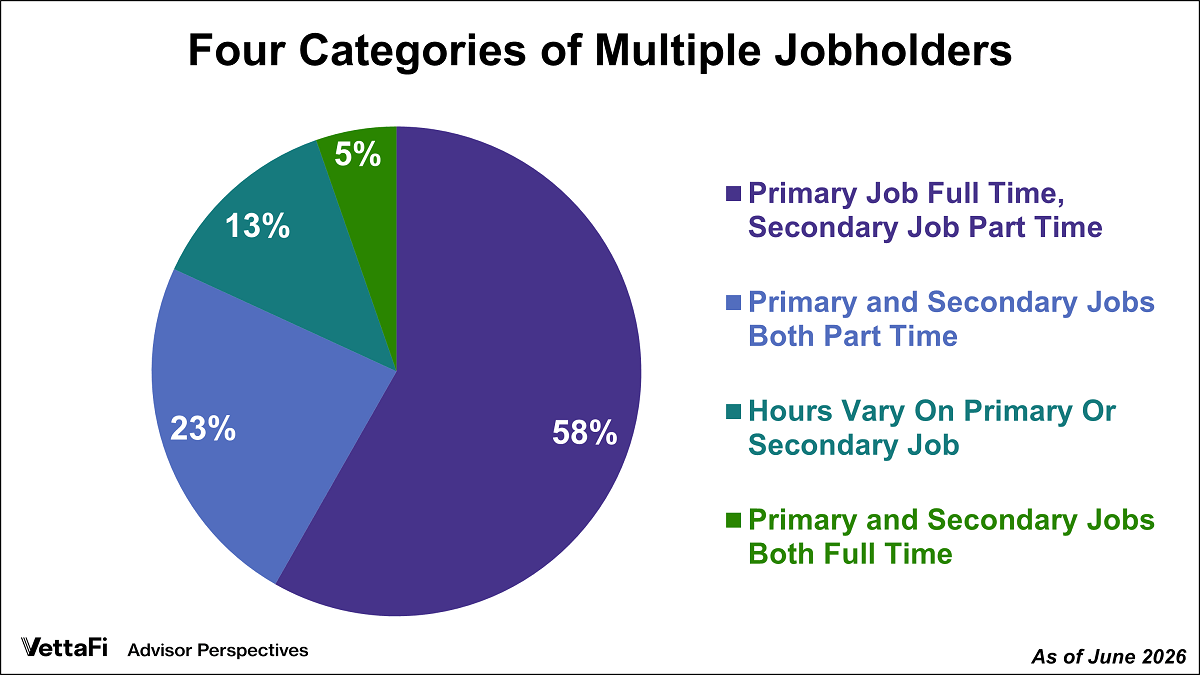
In June, the employment level was at 162.264 million and there were 8.406 million people working multiple jobs in the U.S. This means that multiple jobholders now account for 5.2% of civilian employment. The survey captures data for four subcategories (in pie chart at right) of the multi-job workforce, the relative sizes of which are illustrated in a pie chart. The distinction between "primary" and "secondary" jobs is a subjective one determined by the survey participants.

Not included in the statistics are the approximately 0.04% of the employed who work part-time on what they consider their primary job and full time on their secondary job(s).
Shift in Multiple Jobholders Trends
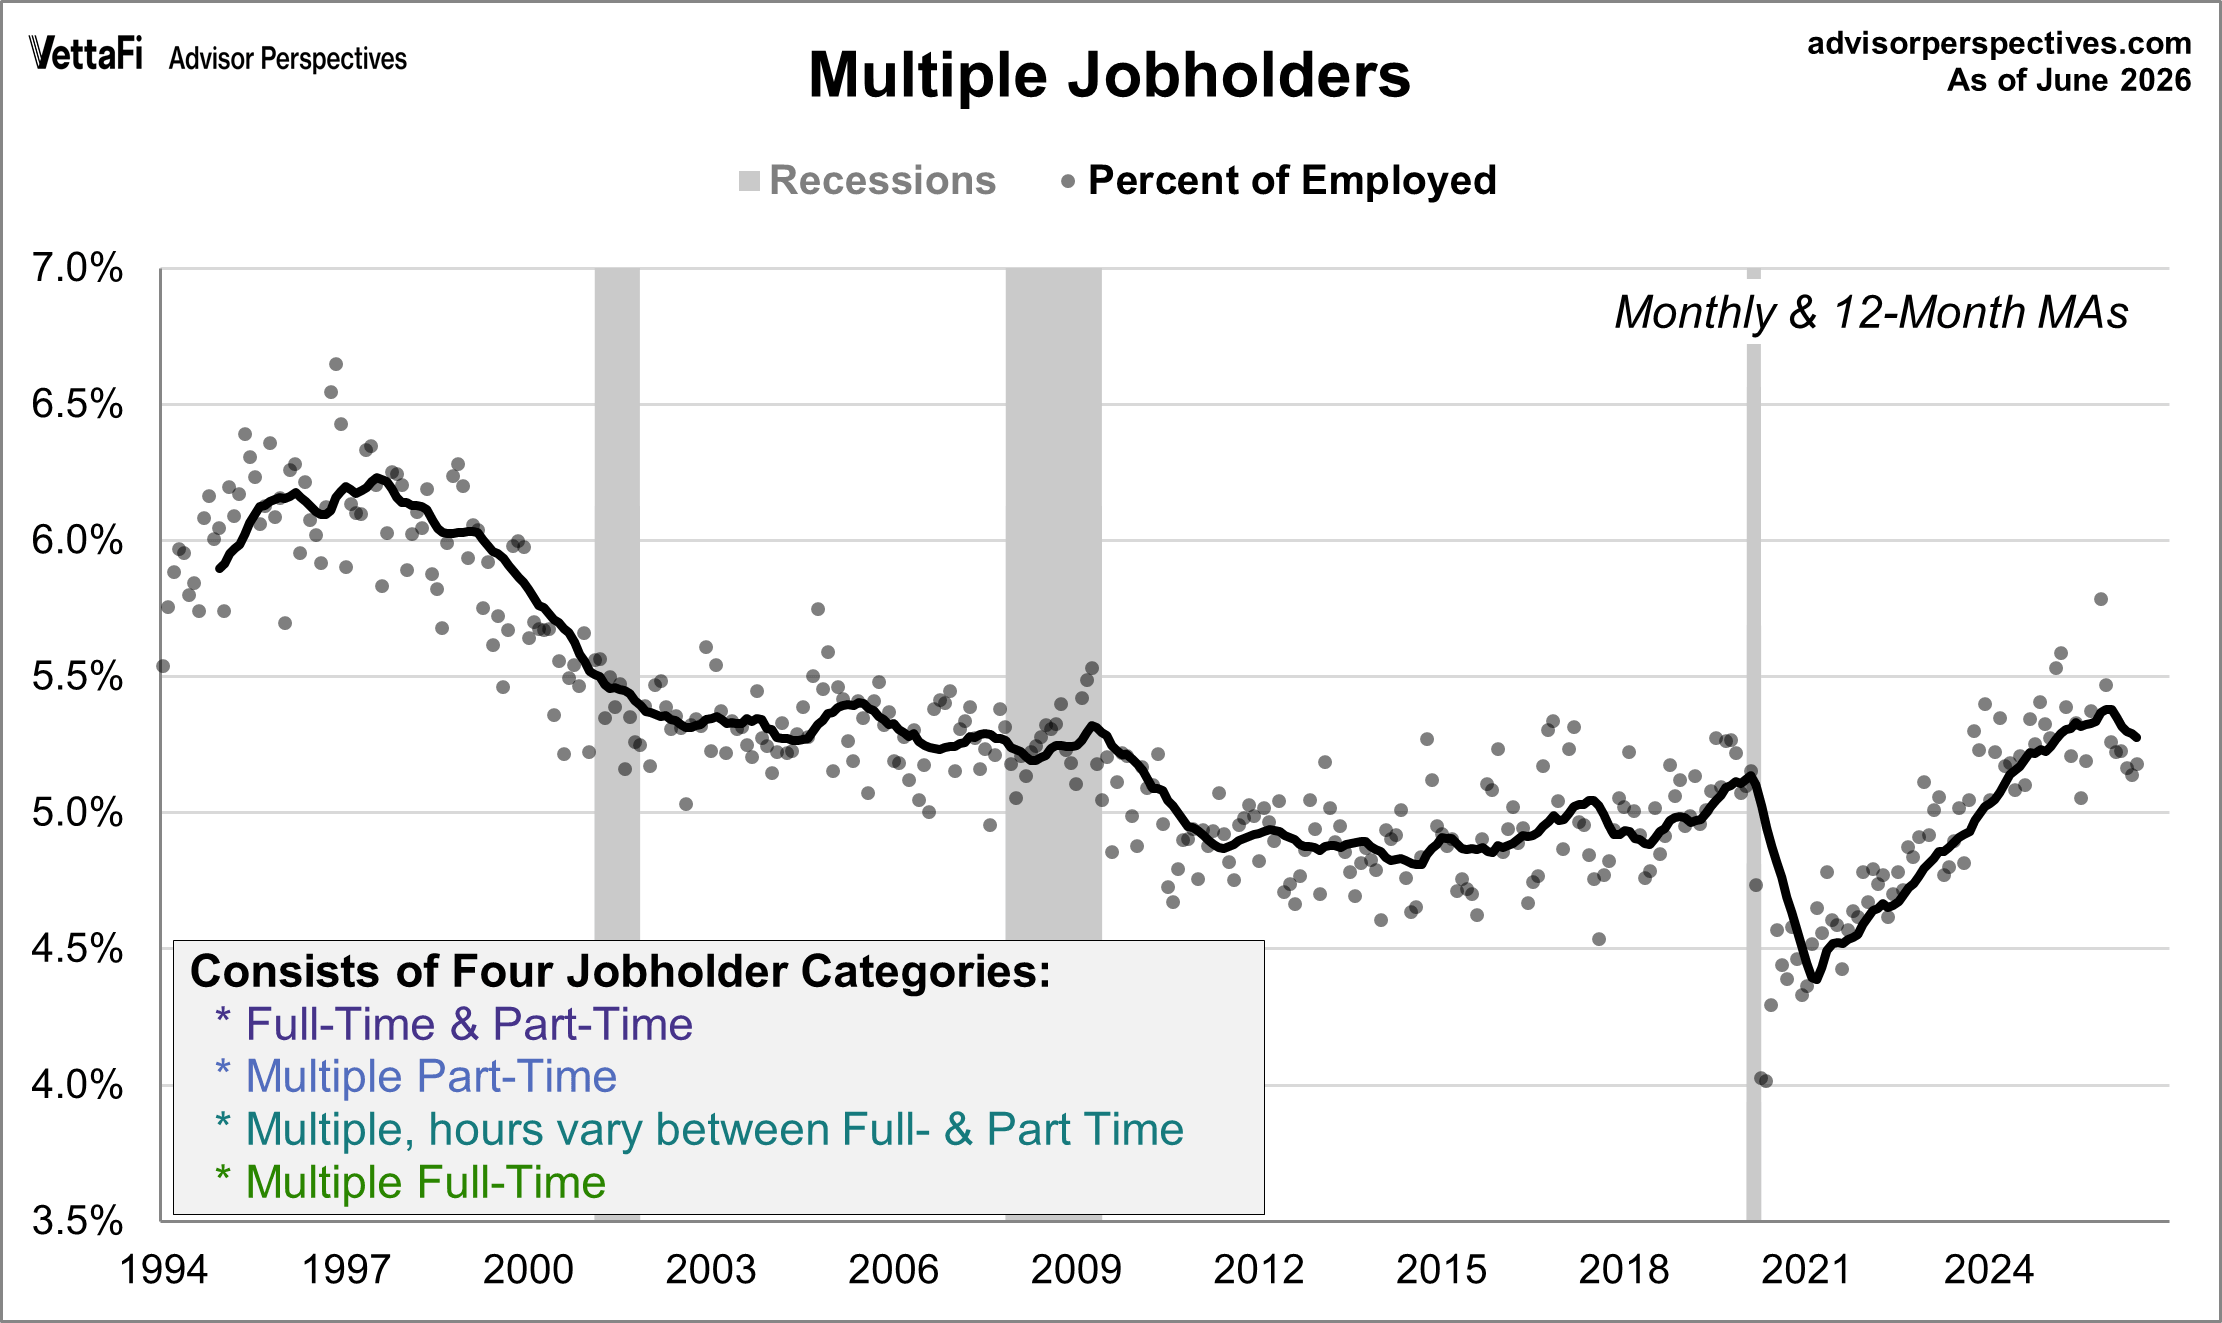
Let's review the complete series to help us get a sense of the long-term trends. Here is a look at all the multiple jobholders as a percent of the civilian employed. The dots are the non-seasonally adjusted monthly data points. Multiple jobholders have accounted for 5.0% or more of total employed persons for 34 straight months, the longest streak since 2009.
However, the monthly data points can be quite volatile so we've added a 12-month moving average to highlight the trend. The moving average peaked in the summer of 1997 and then began trending downward. The moving average hovered slightly below 5% between the last two recessions before dropping to as low as 4.4% in 2021. Since then, it has been trending upwards and is now above pre-pandemic levels.
The moving average currently sits at 5.28%, the lowest level since February 2025 but still one of the highest in the last twenty years.
Analyzing the Four Subcategories of Multiple Jobholders
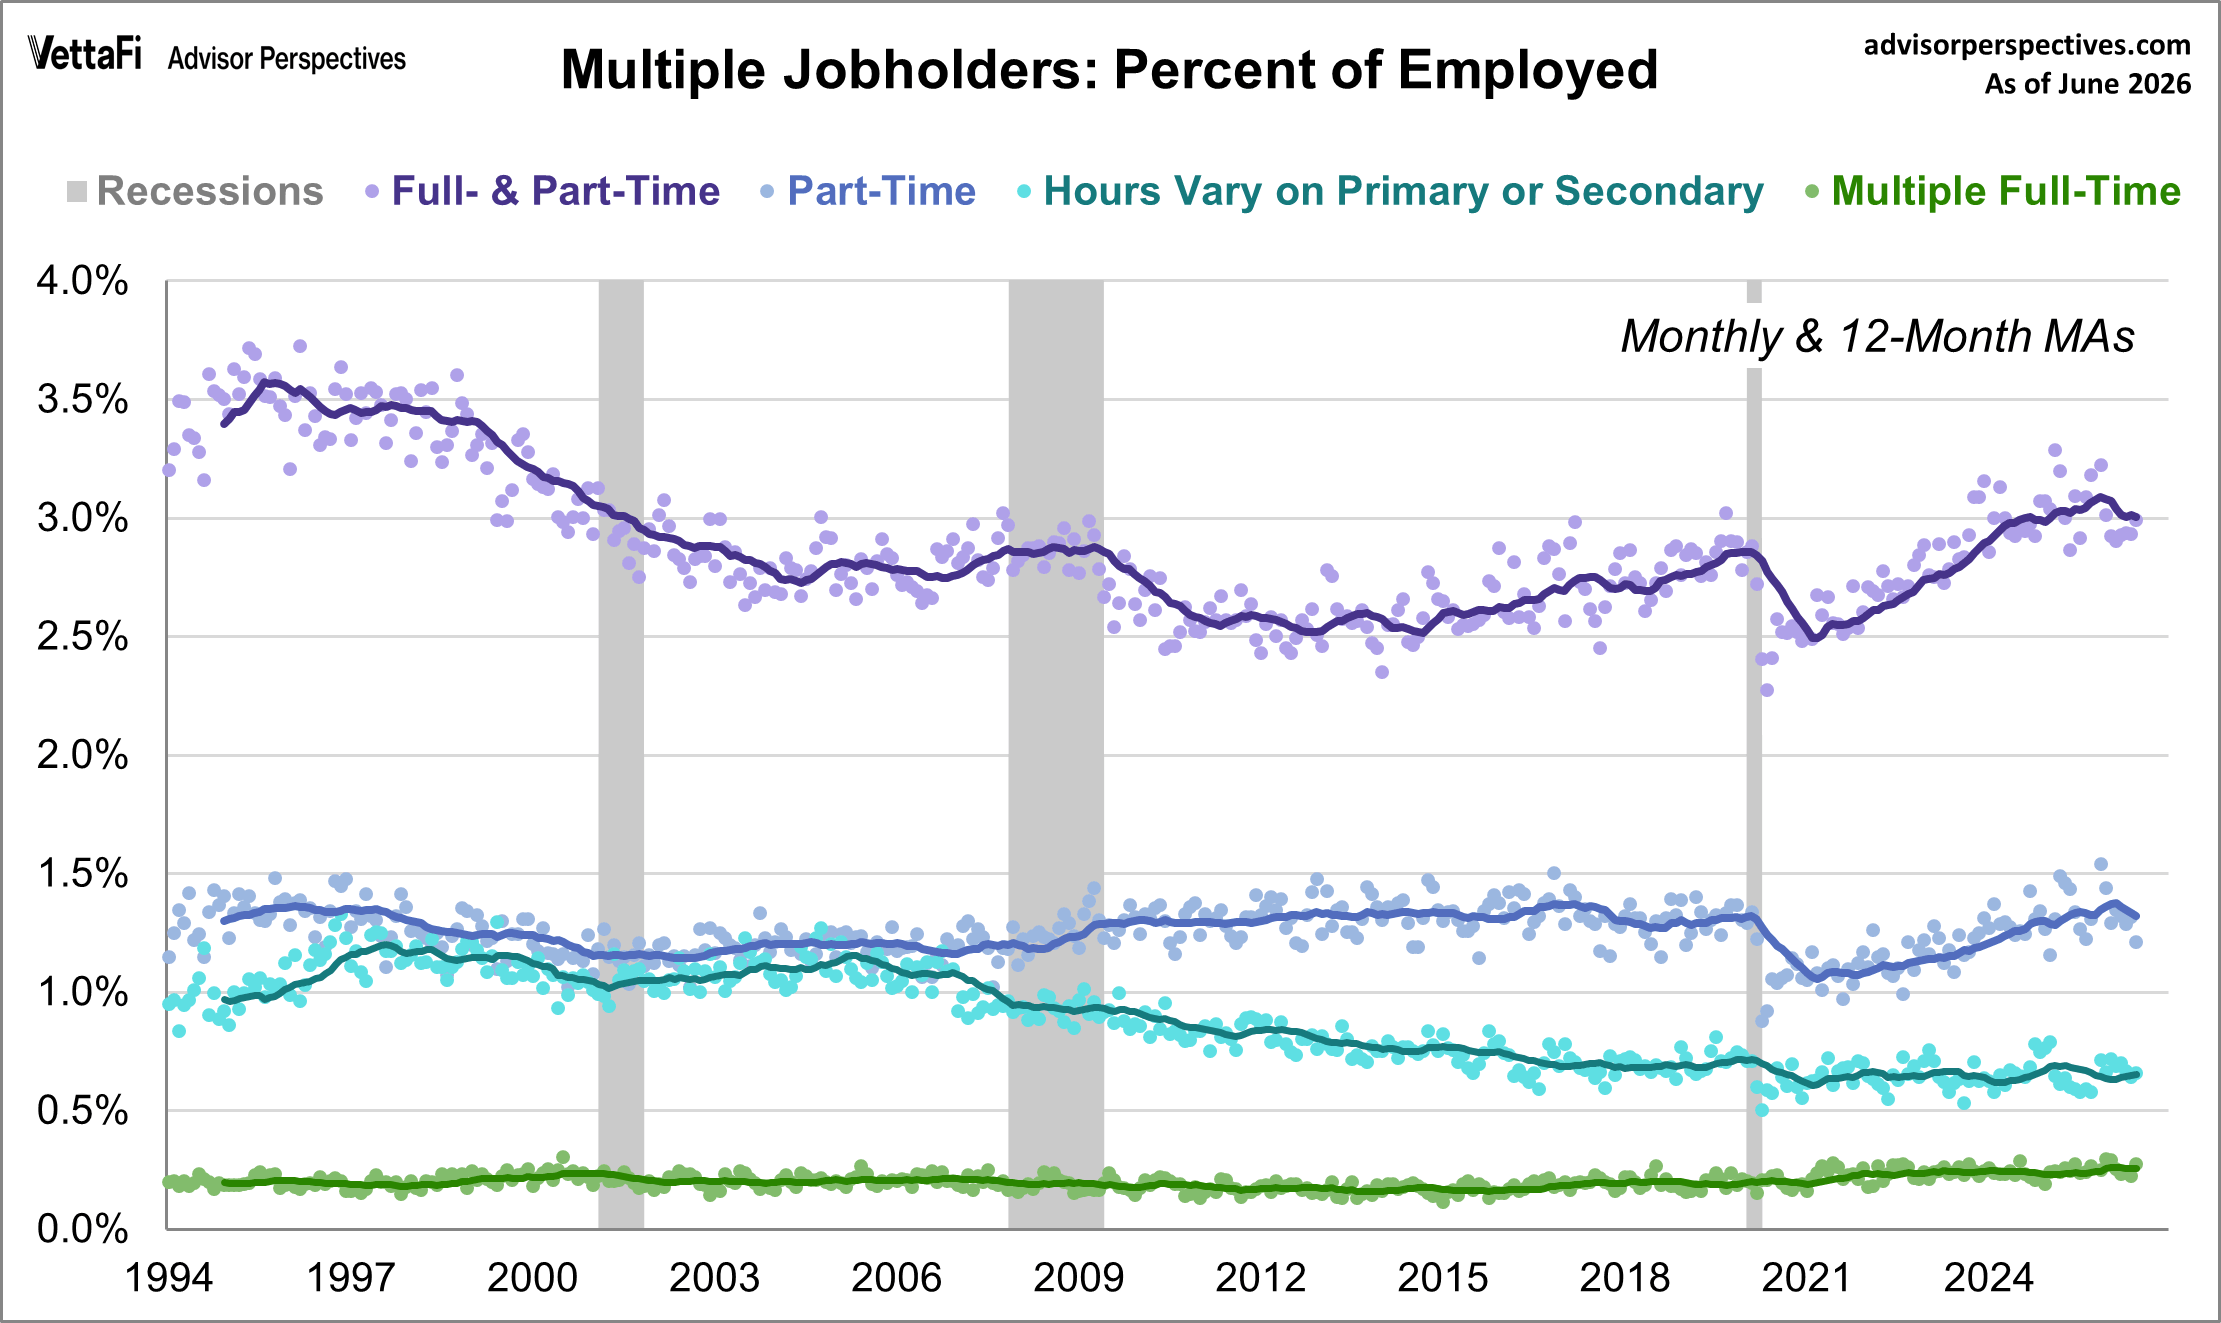
The next chart focuses on all four subcategories referenced in the pie chart. The trend outlier is the series illustrated with the blue line: multiple part-time jobholders. Its trough was in 2002 and trended higher in early 2007, long before Obamacare.
At about the same time we also see a steepening decline in the trend for the employed whose hours vary between full-time and part-time for either their primary or secondary job.
Immediately following the COVID-pandemic, we saw a sharp decline in those who work full and part time as well as those who work multiple part-time jobs. But starting in 2021, both groups have been steadily increasing, albeit not at the same rate. As you can see in the chart below, those working full and part time now sits at its highest level since the turn of the century.
Meanwhile, those working multiple full-time jobs has remained steady over time.
Economic Cohorts Impacted by the Great Recession
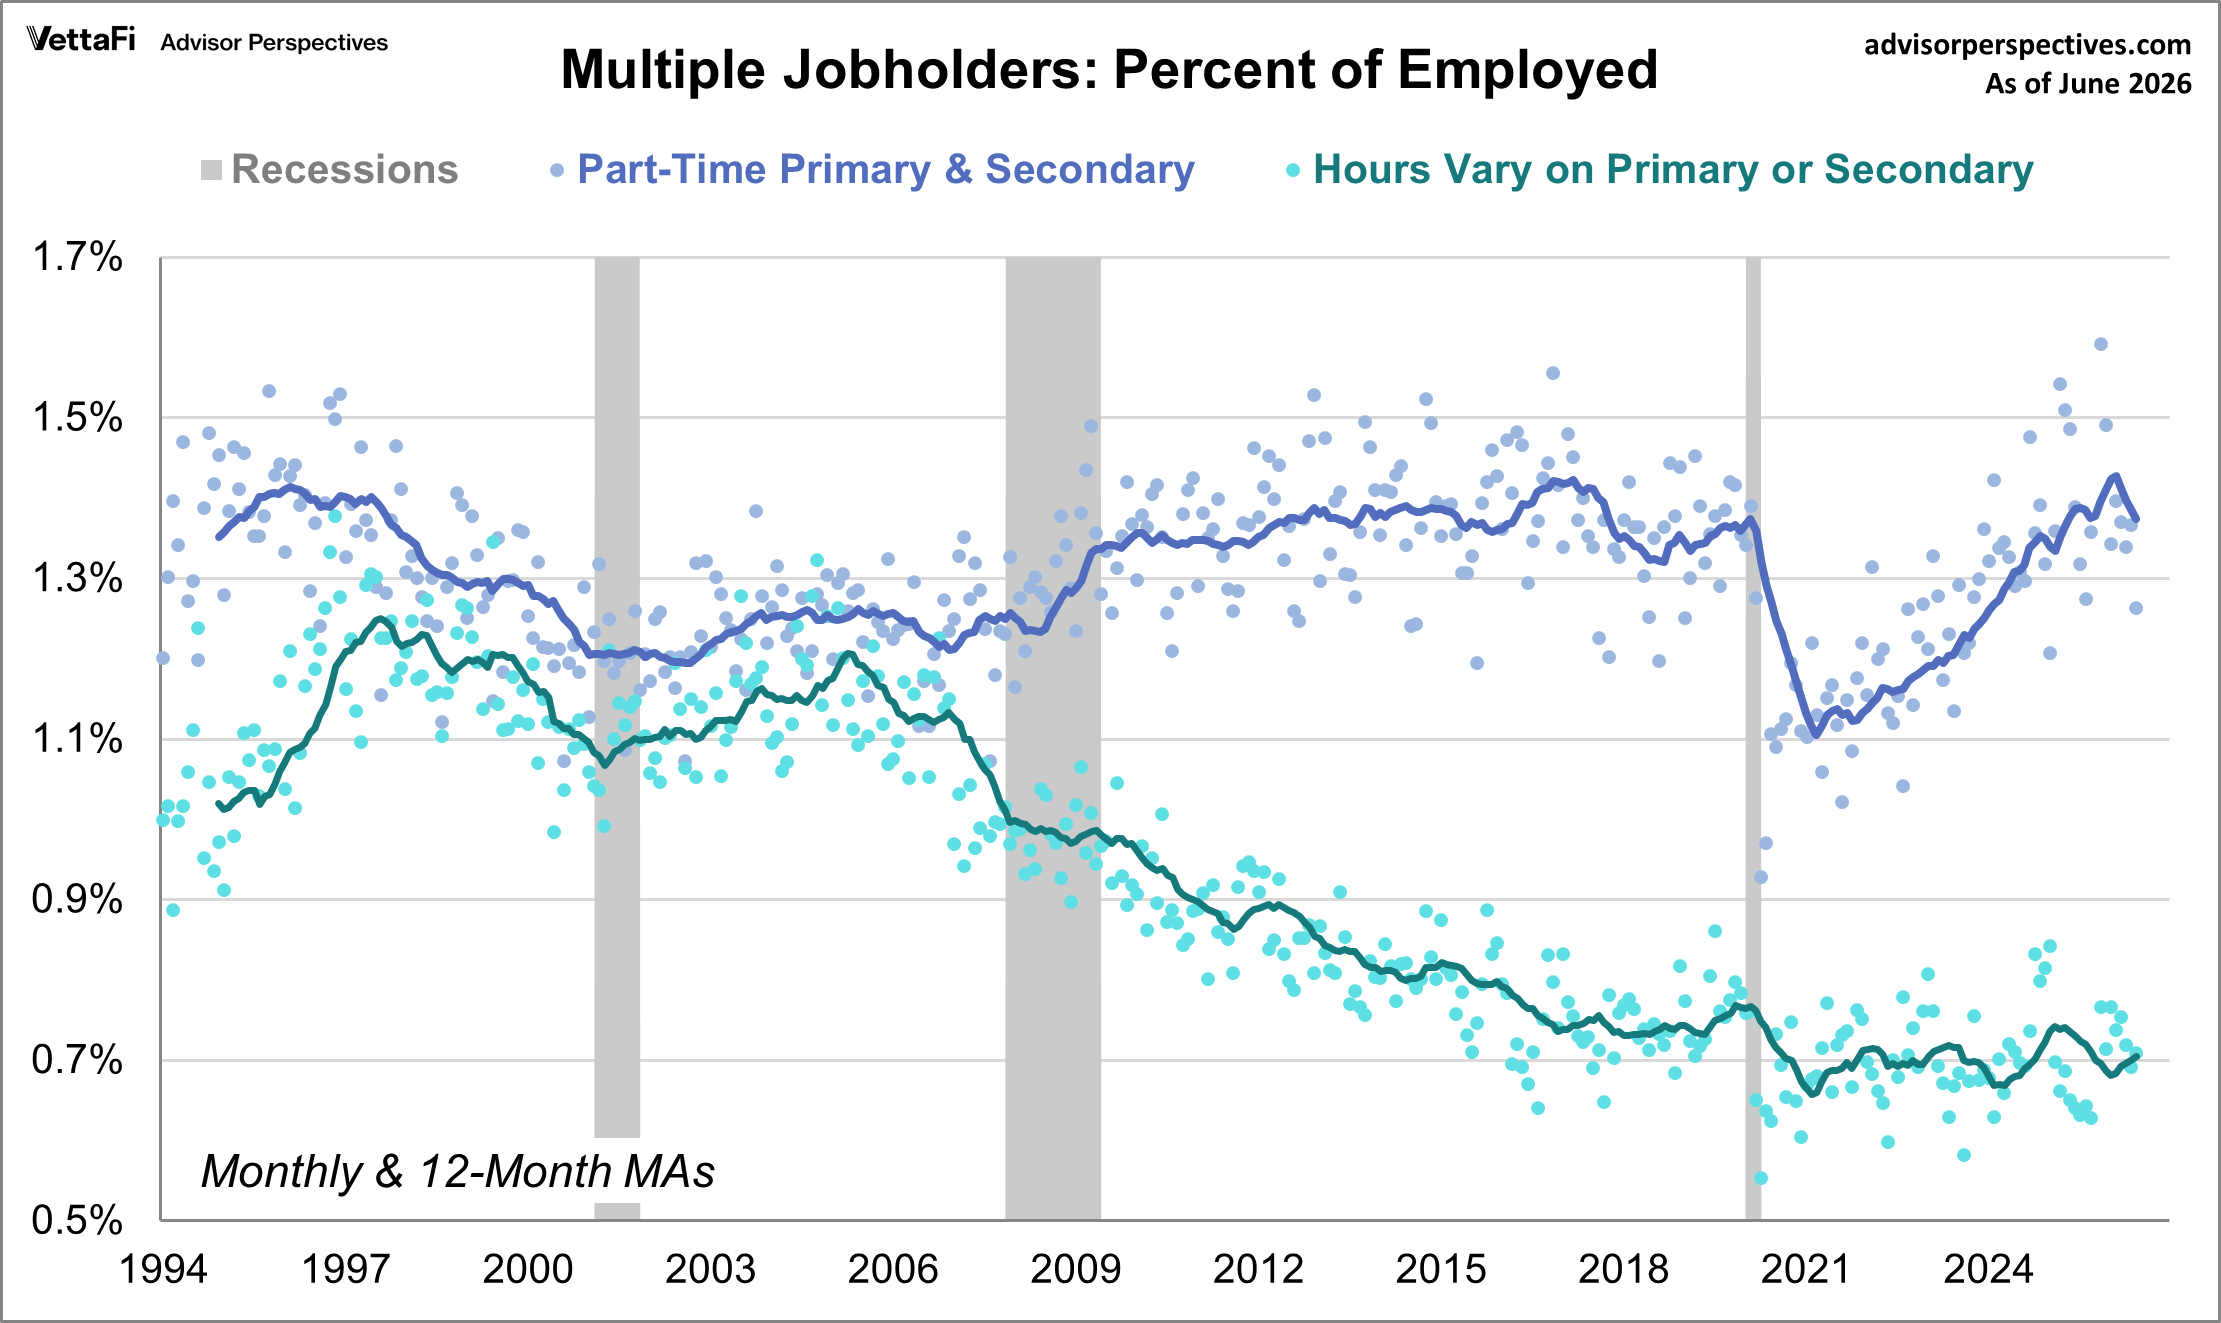
This next chart gives a closer look at the two cohorts that have changed the most since the mid-2000s. I've rescaled the vertical axis to give us a clearer view of the trends.
The Great Recession noticeably increased the percentage of multiple part-time jobholders. This metric leveled out in 2010 and 2011, but it subsequently resumed a slow upward trend up until the COVID-pandemic. It seems likely that the downward trend for the cohort whose hours vary for their primary or secondary job (the teal line) has contributed to the rise of exclusively part-timers (the blue line).
For a more detailed look at the broader topic of the full-time/part-time ratio see this monthly update.
Here's our list of monthly employment updates:
Monthly Employment Report
Job Openings and Labor Turnover Summary (JOLTS)
ADP Employment Report
Weekly Unemployment Claims
Full-Time and Part-Time Employment
Unemployment Claims as a Recession Indicator
Five Decades of Middle Class Wages
Workforce Analysis
Long-Term Trends by Age Group
Aging Work Force
Baby Boomers Across Time
Read more updates by Jen Nash