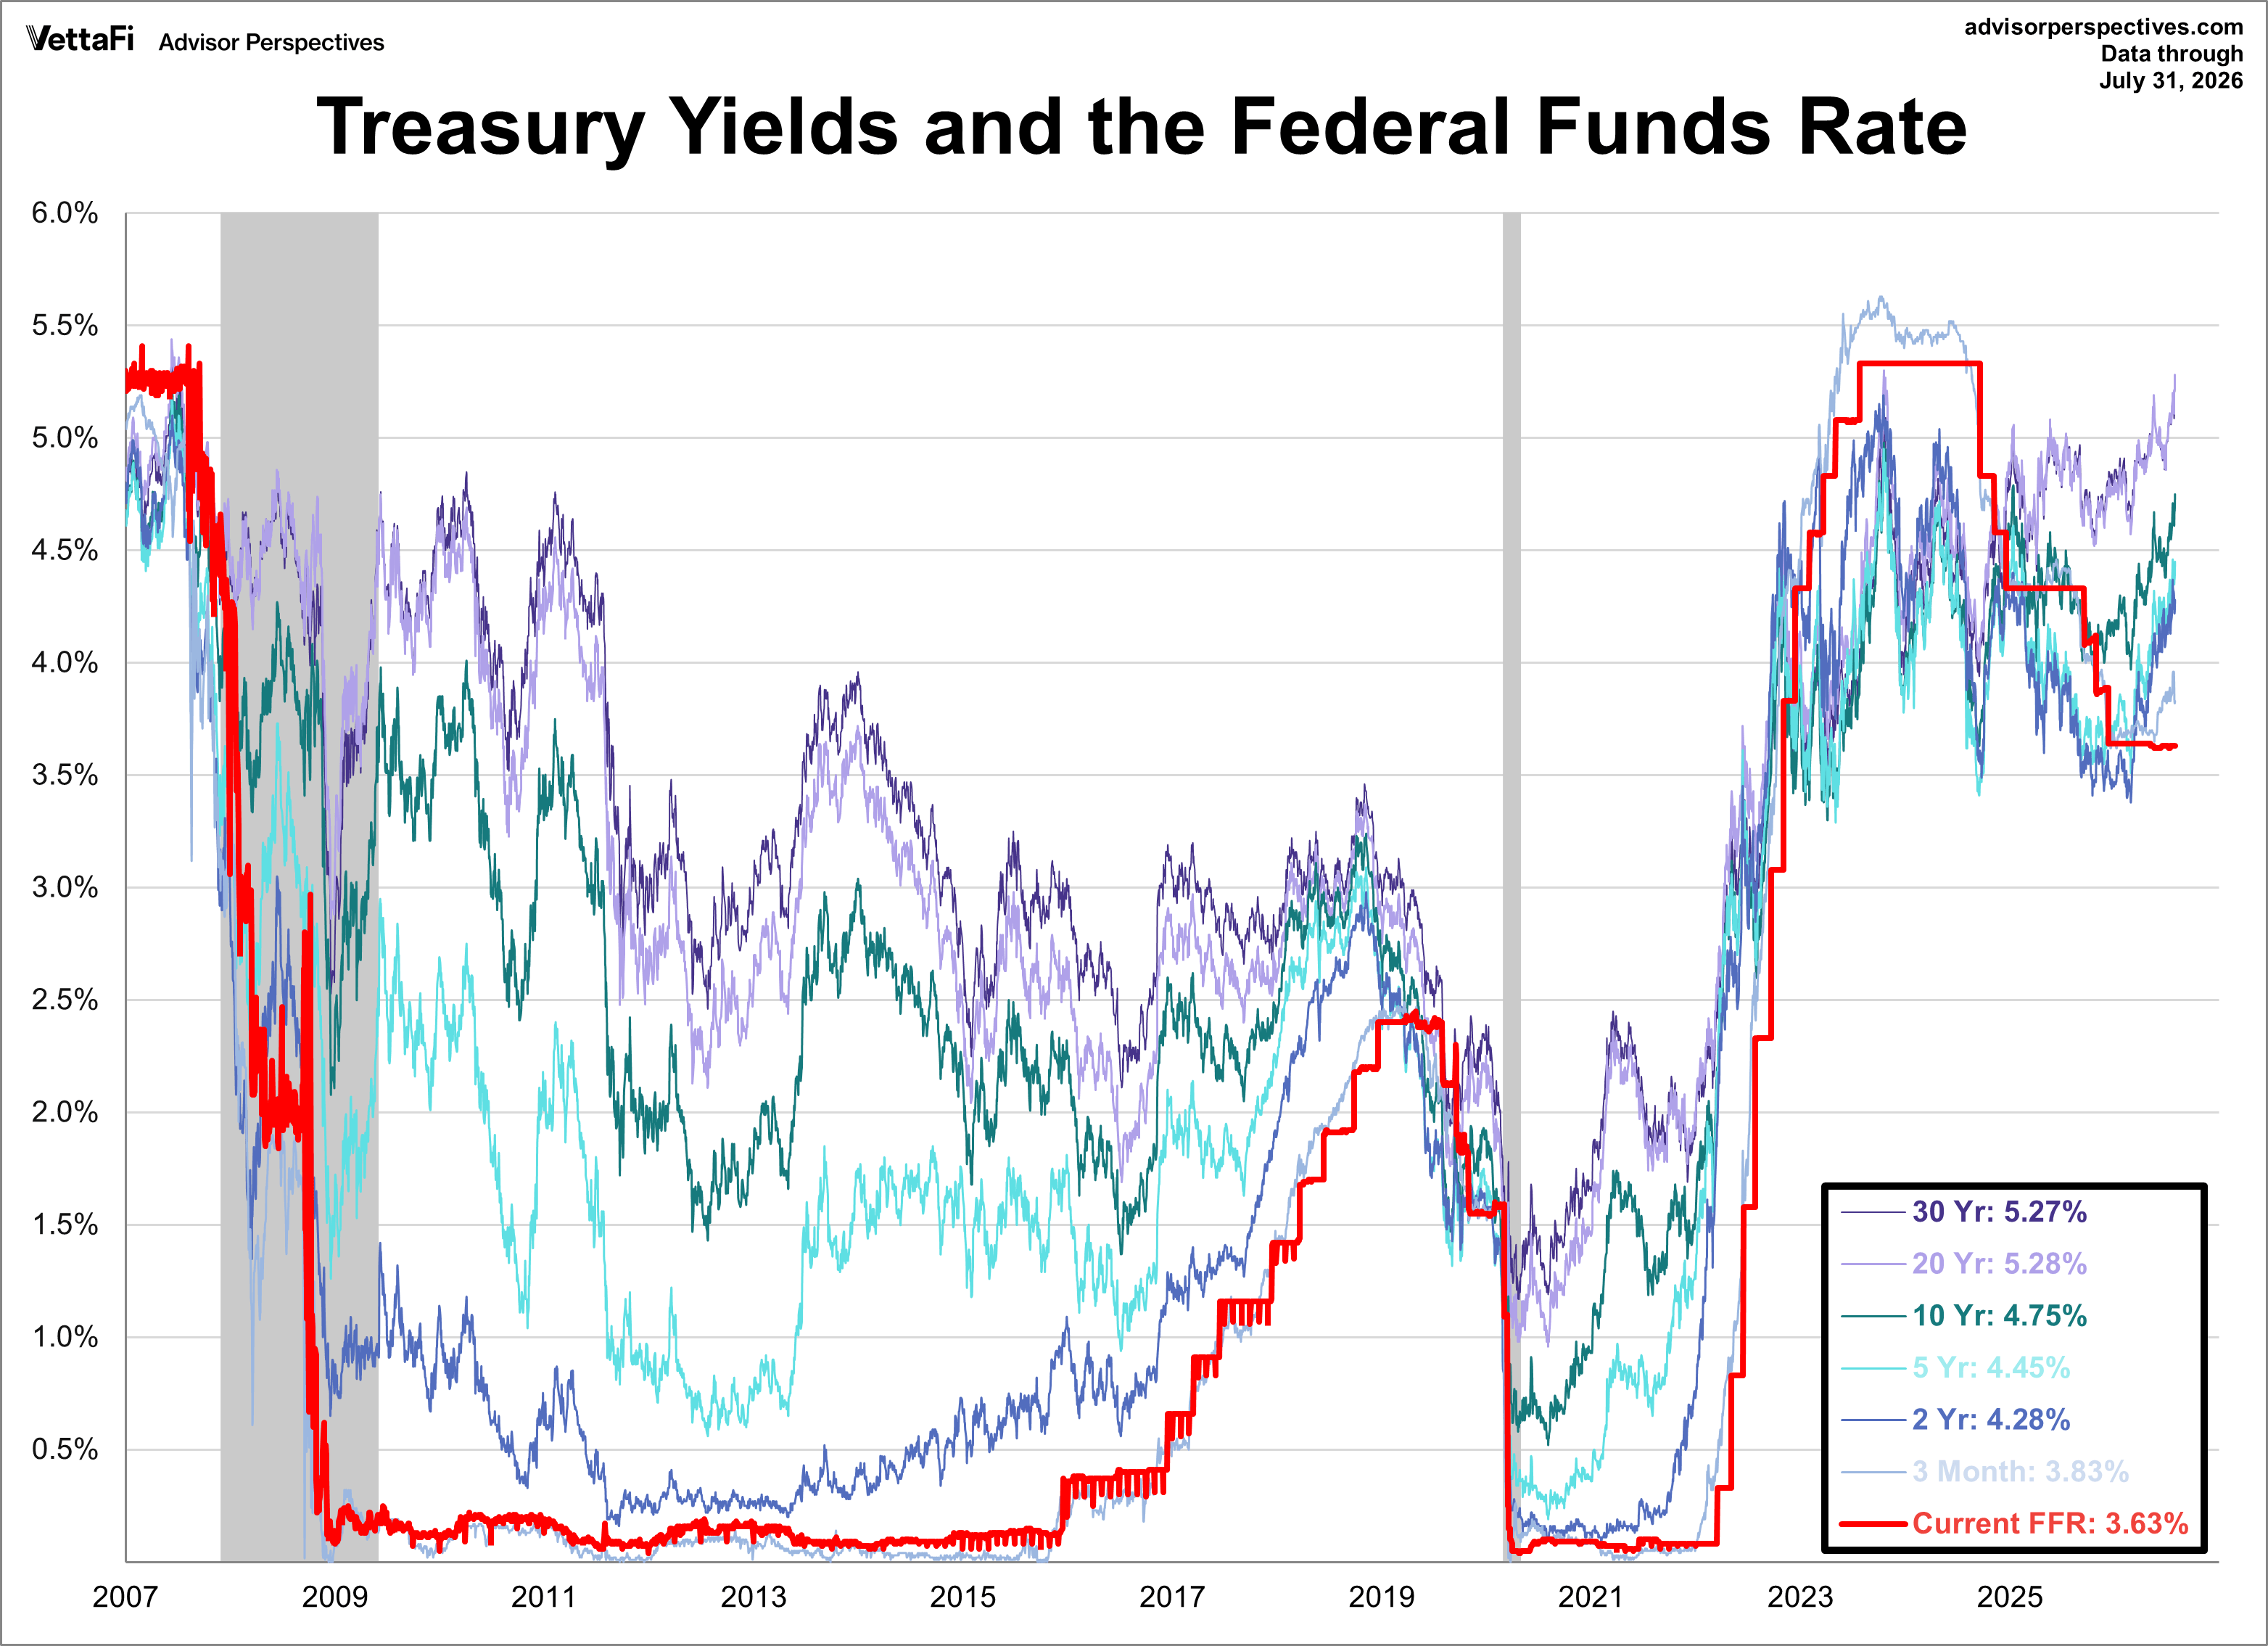
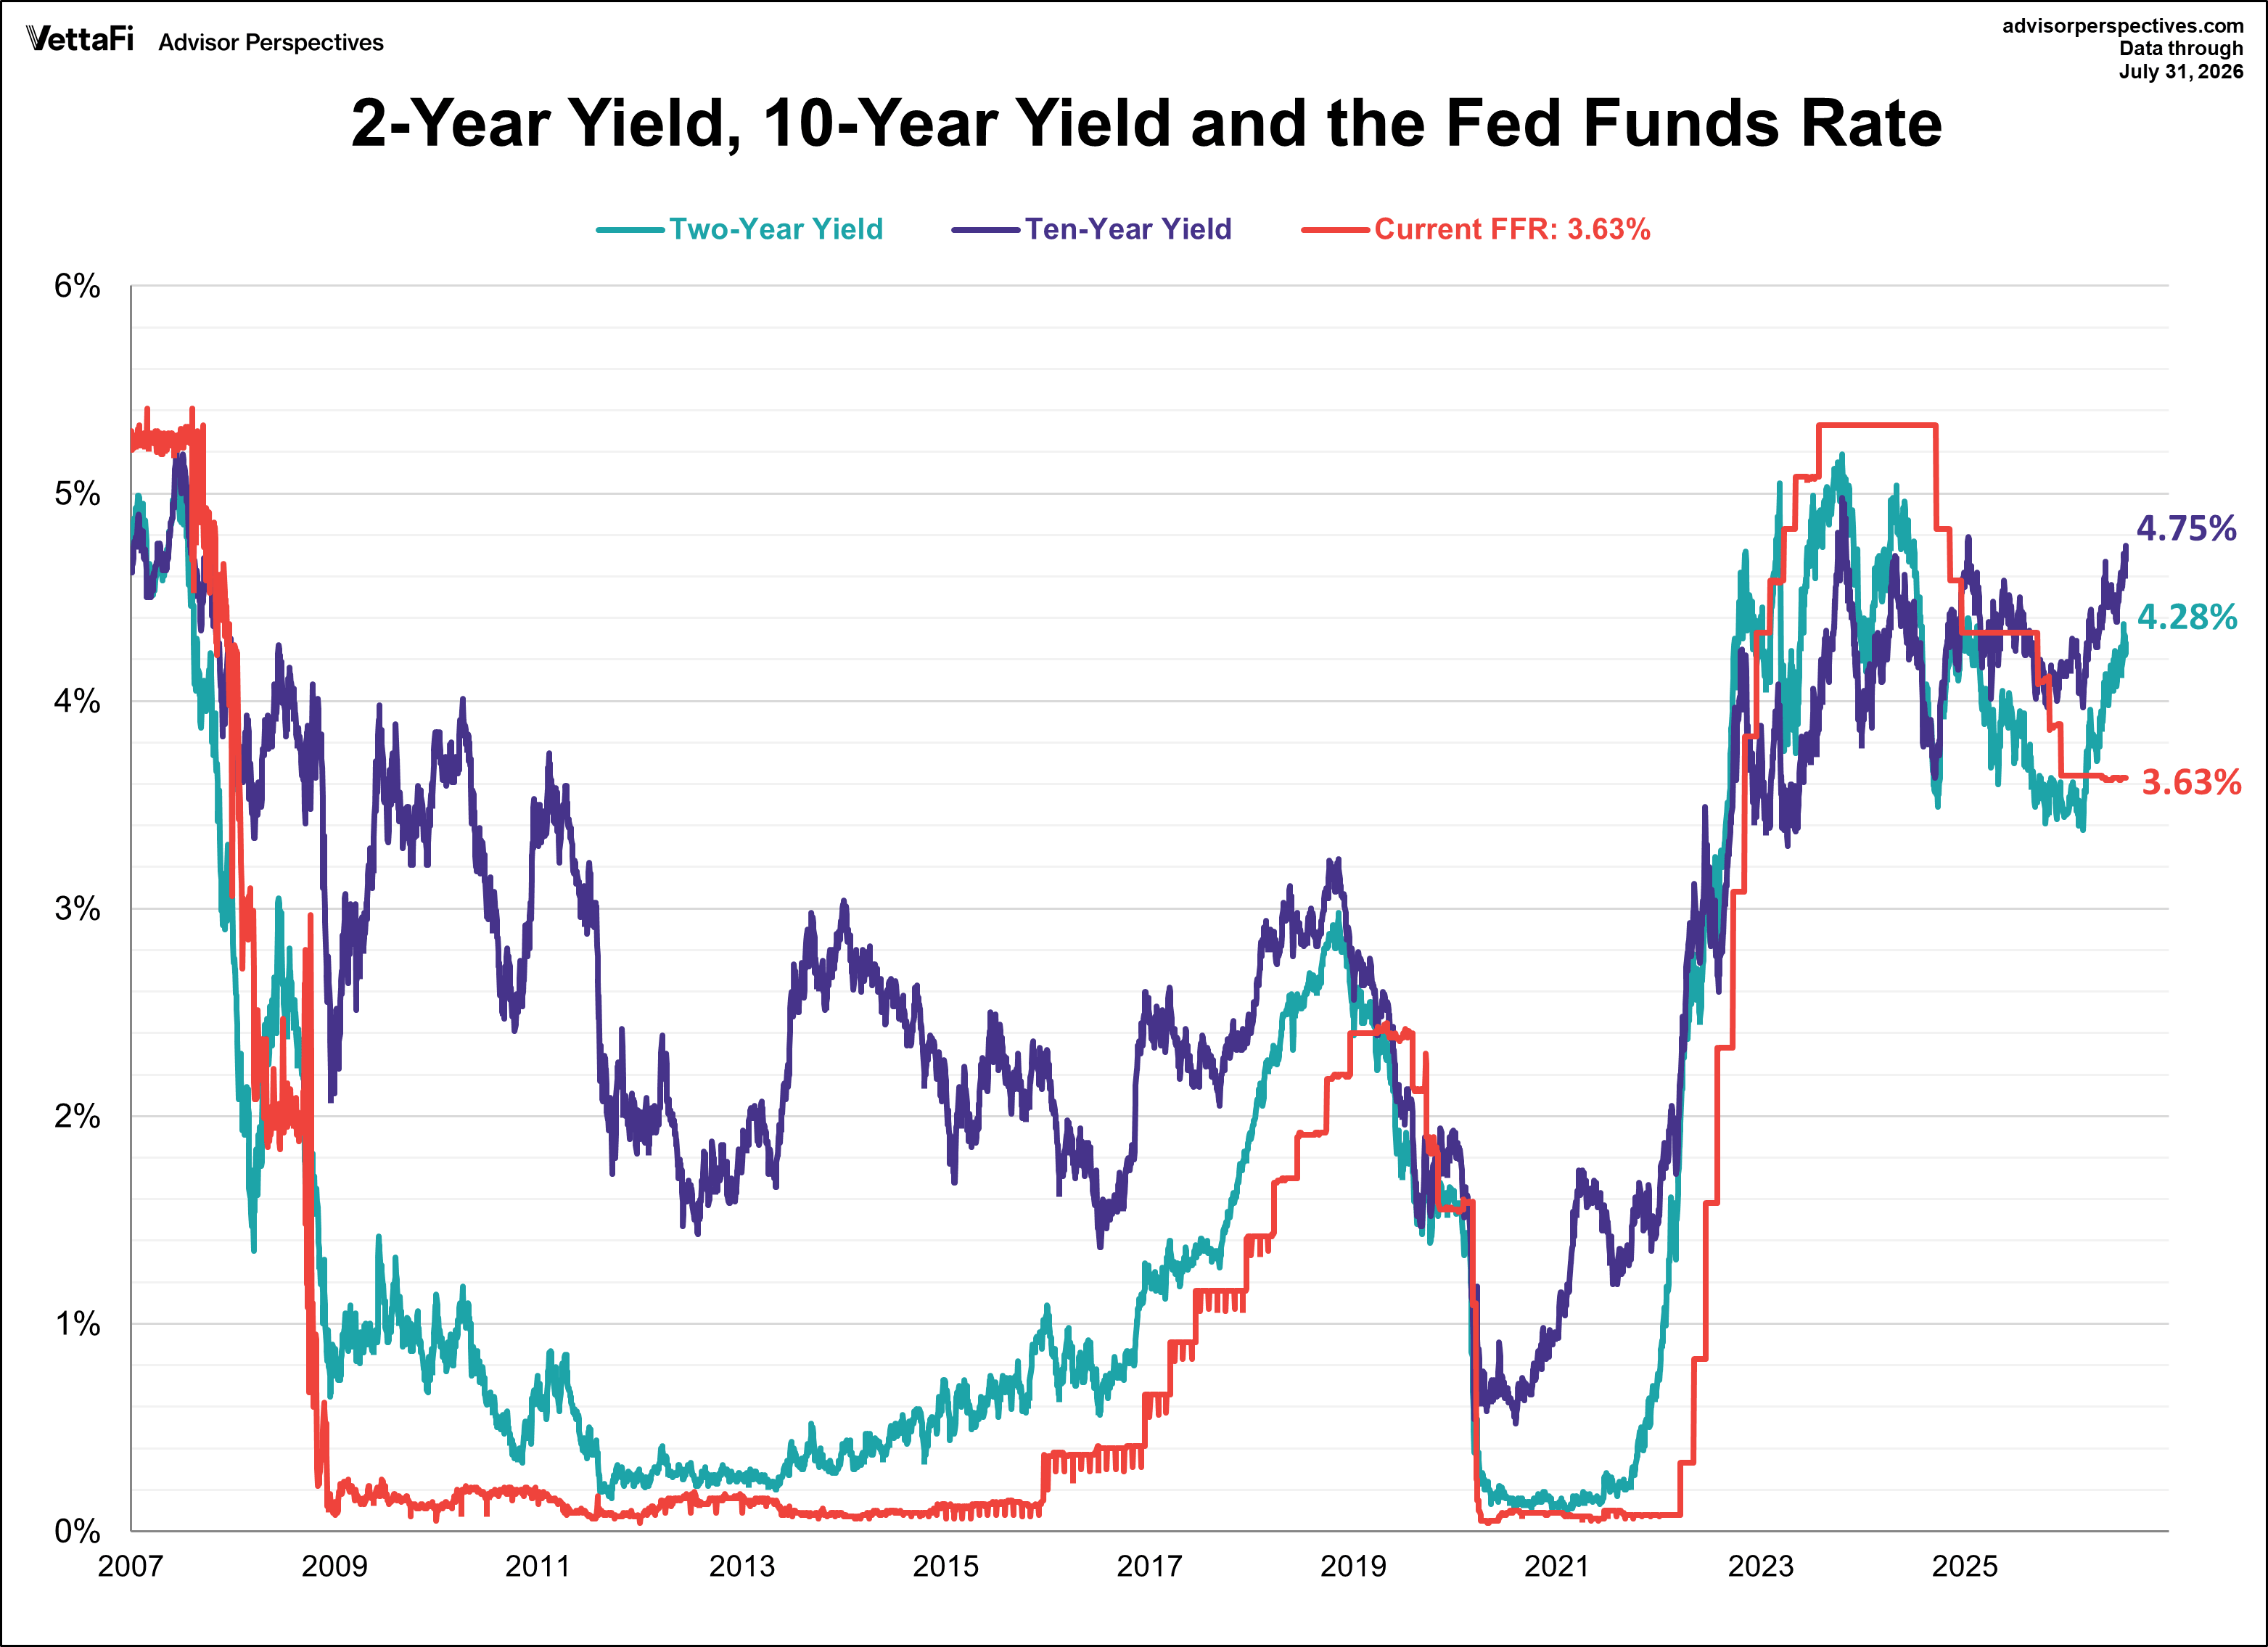
The yield on the 10-year note finished July 31, 2026 at 4.75% while the 2-year note ended at 4.28%.
The chart below overlays the daily performance of several Treasury bonds, starting from the pre-recession equity market peaks, along with the Federal Funds Rate (FFR) since 2007.
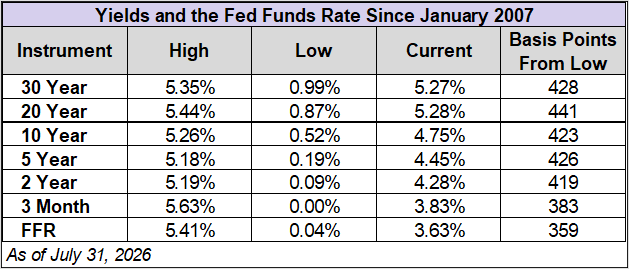
This next table shows the highs and lows of yields and the Federal Funds Rate (FFR) since 2007.
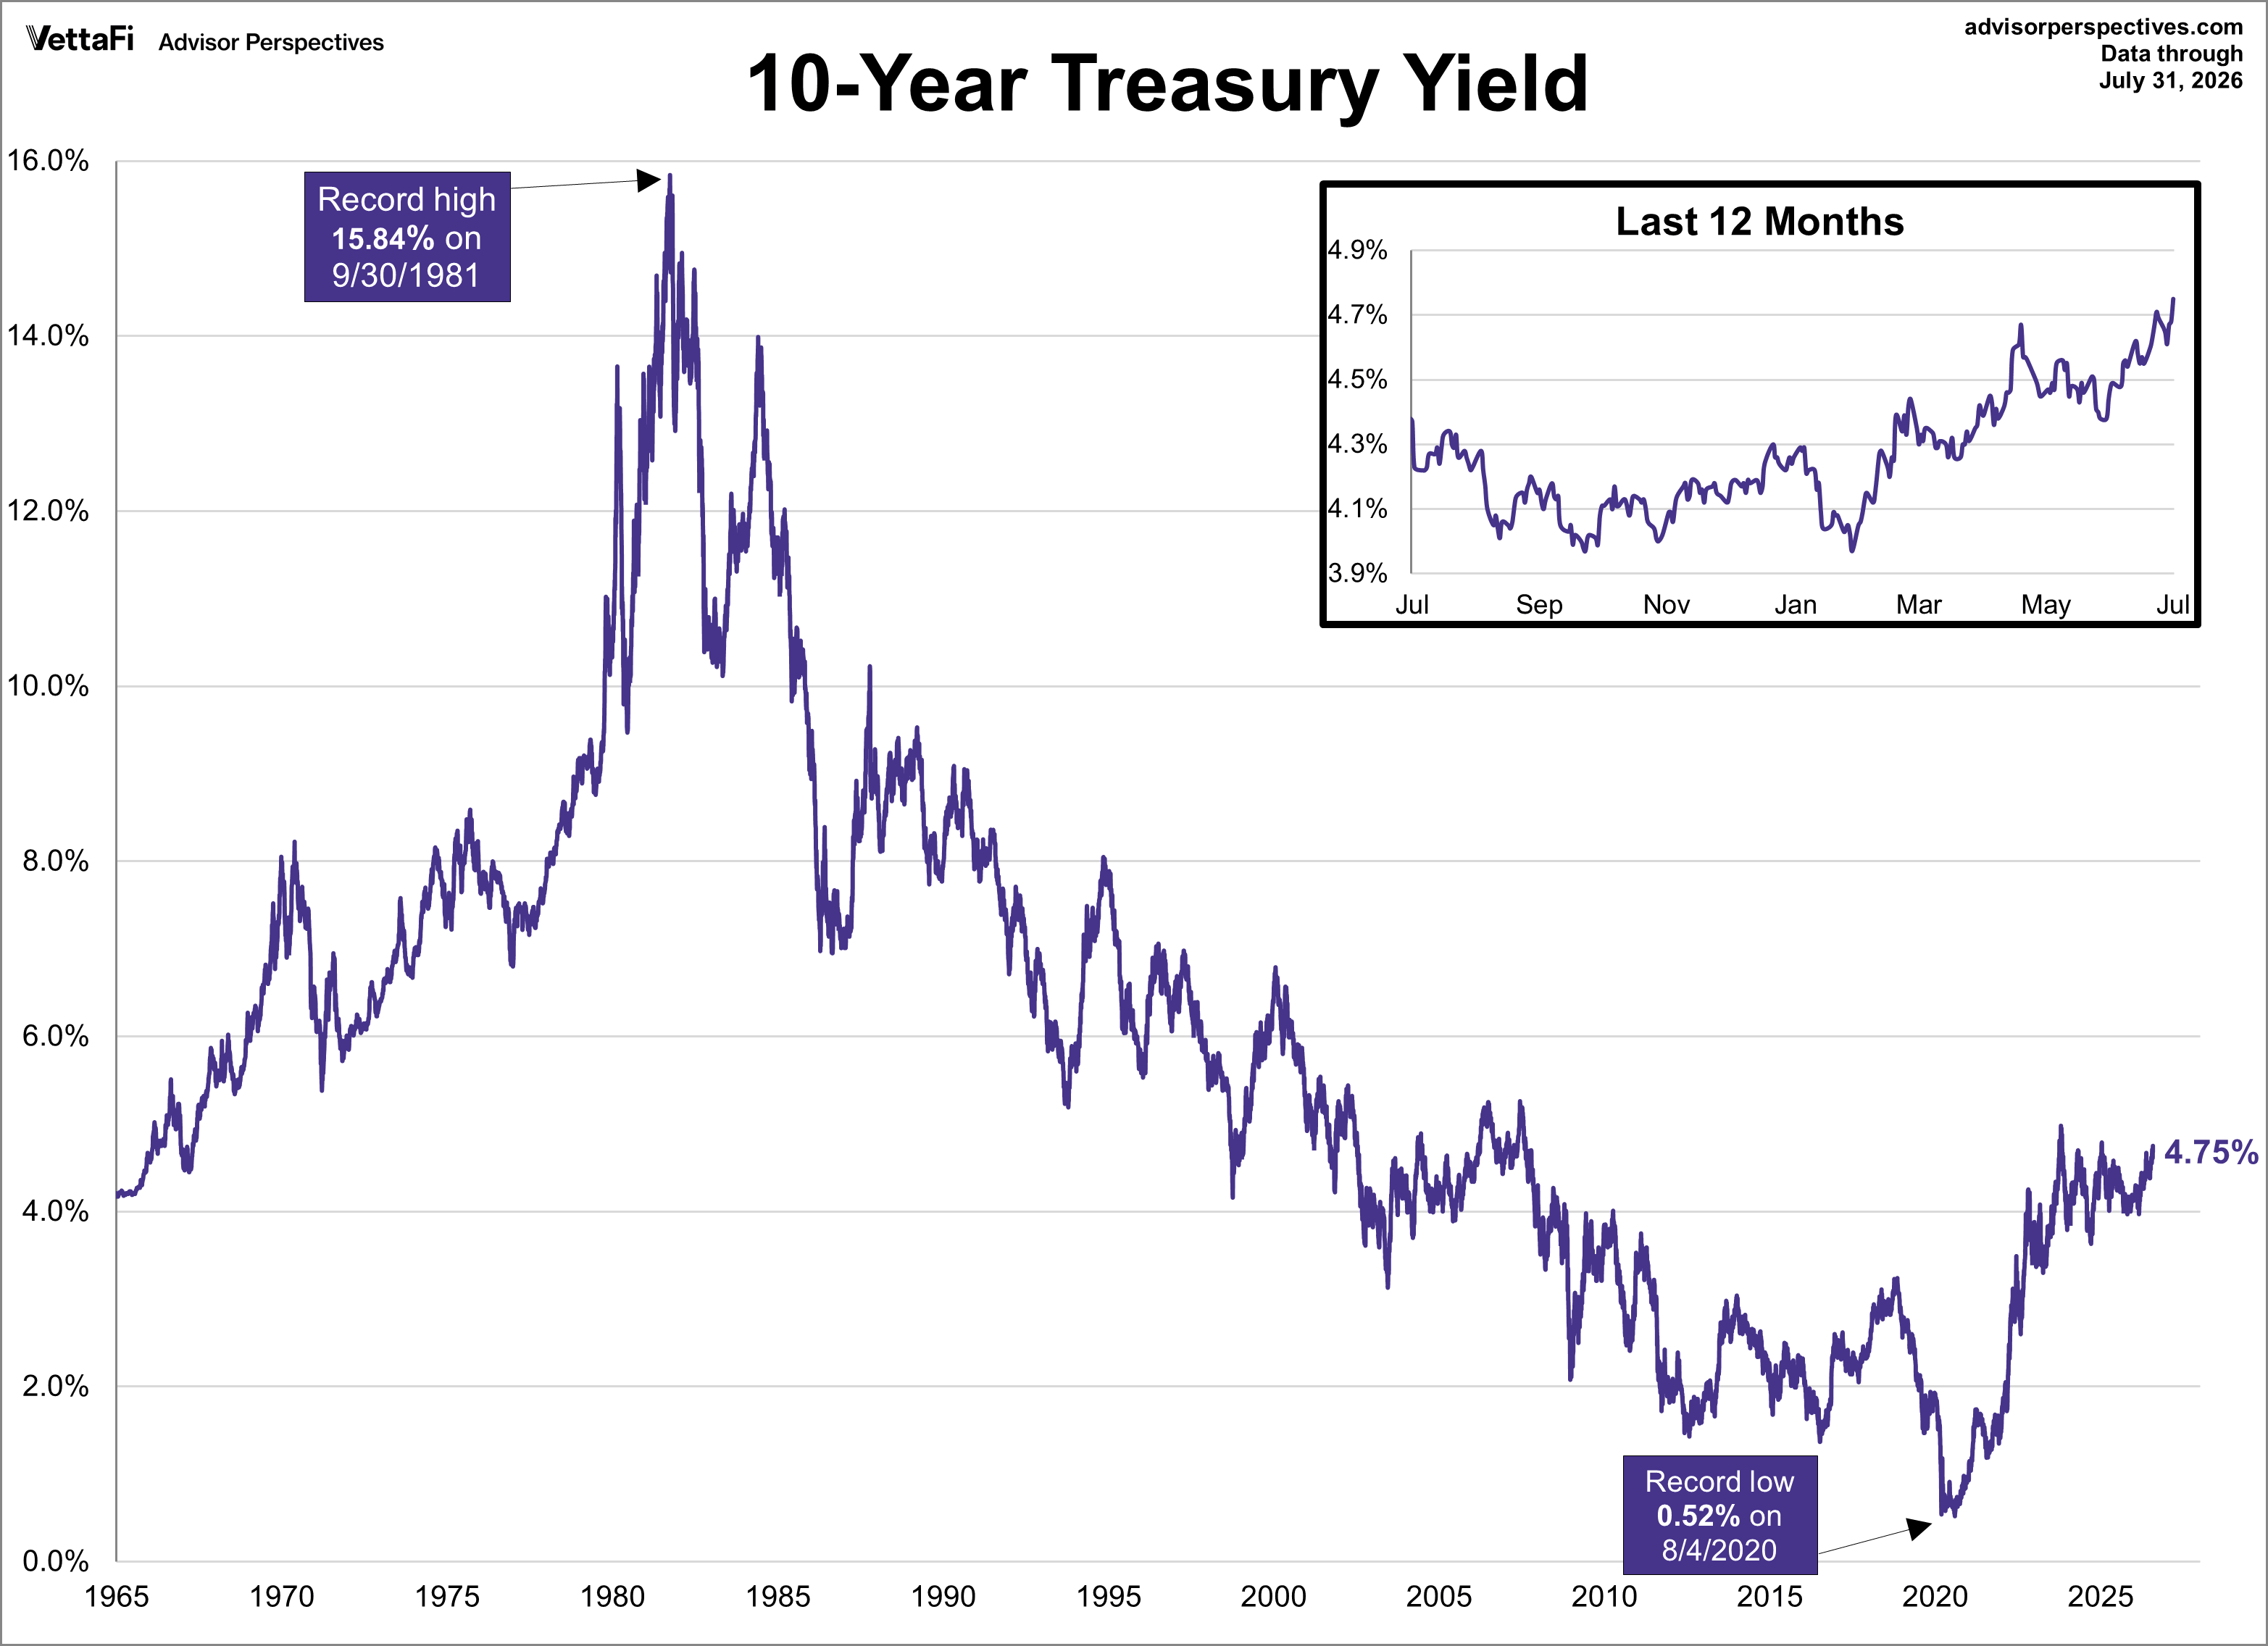
A Long-Term Look at the 10-Year Treasury Yield
Here is a long-term view of the 10-year yield starting in 1965, well before the 1973 oil embargo that triggered the era of 'stagflation' (economic stagnation coupled with inflation)
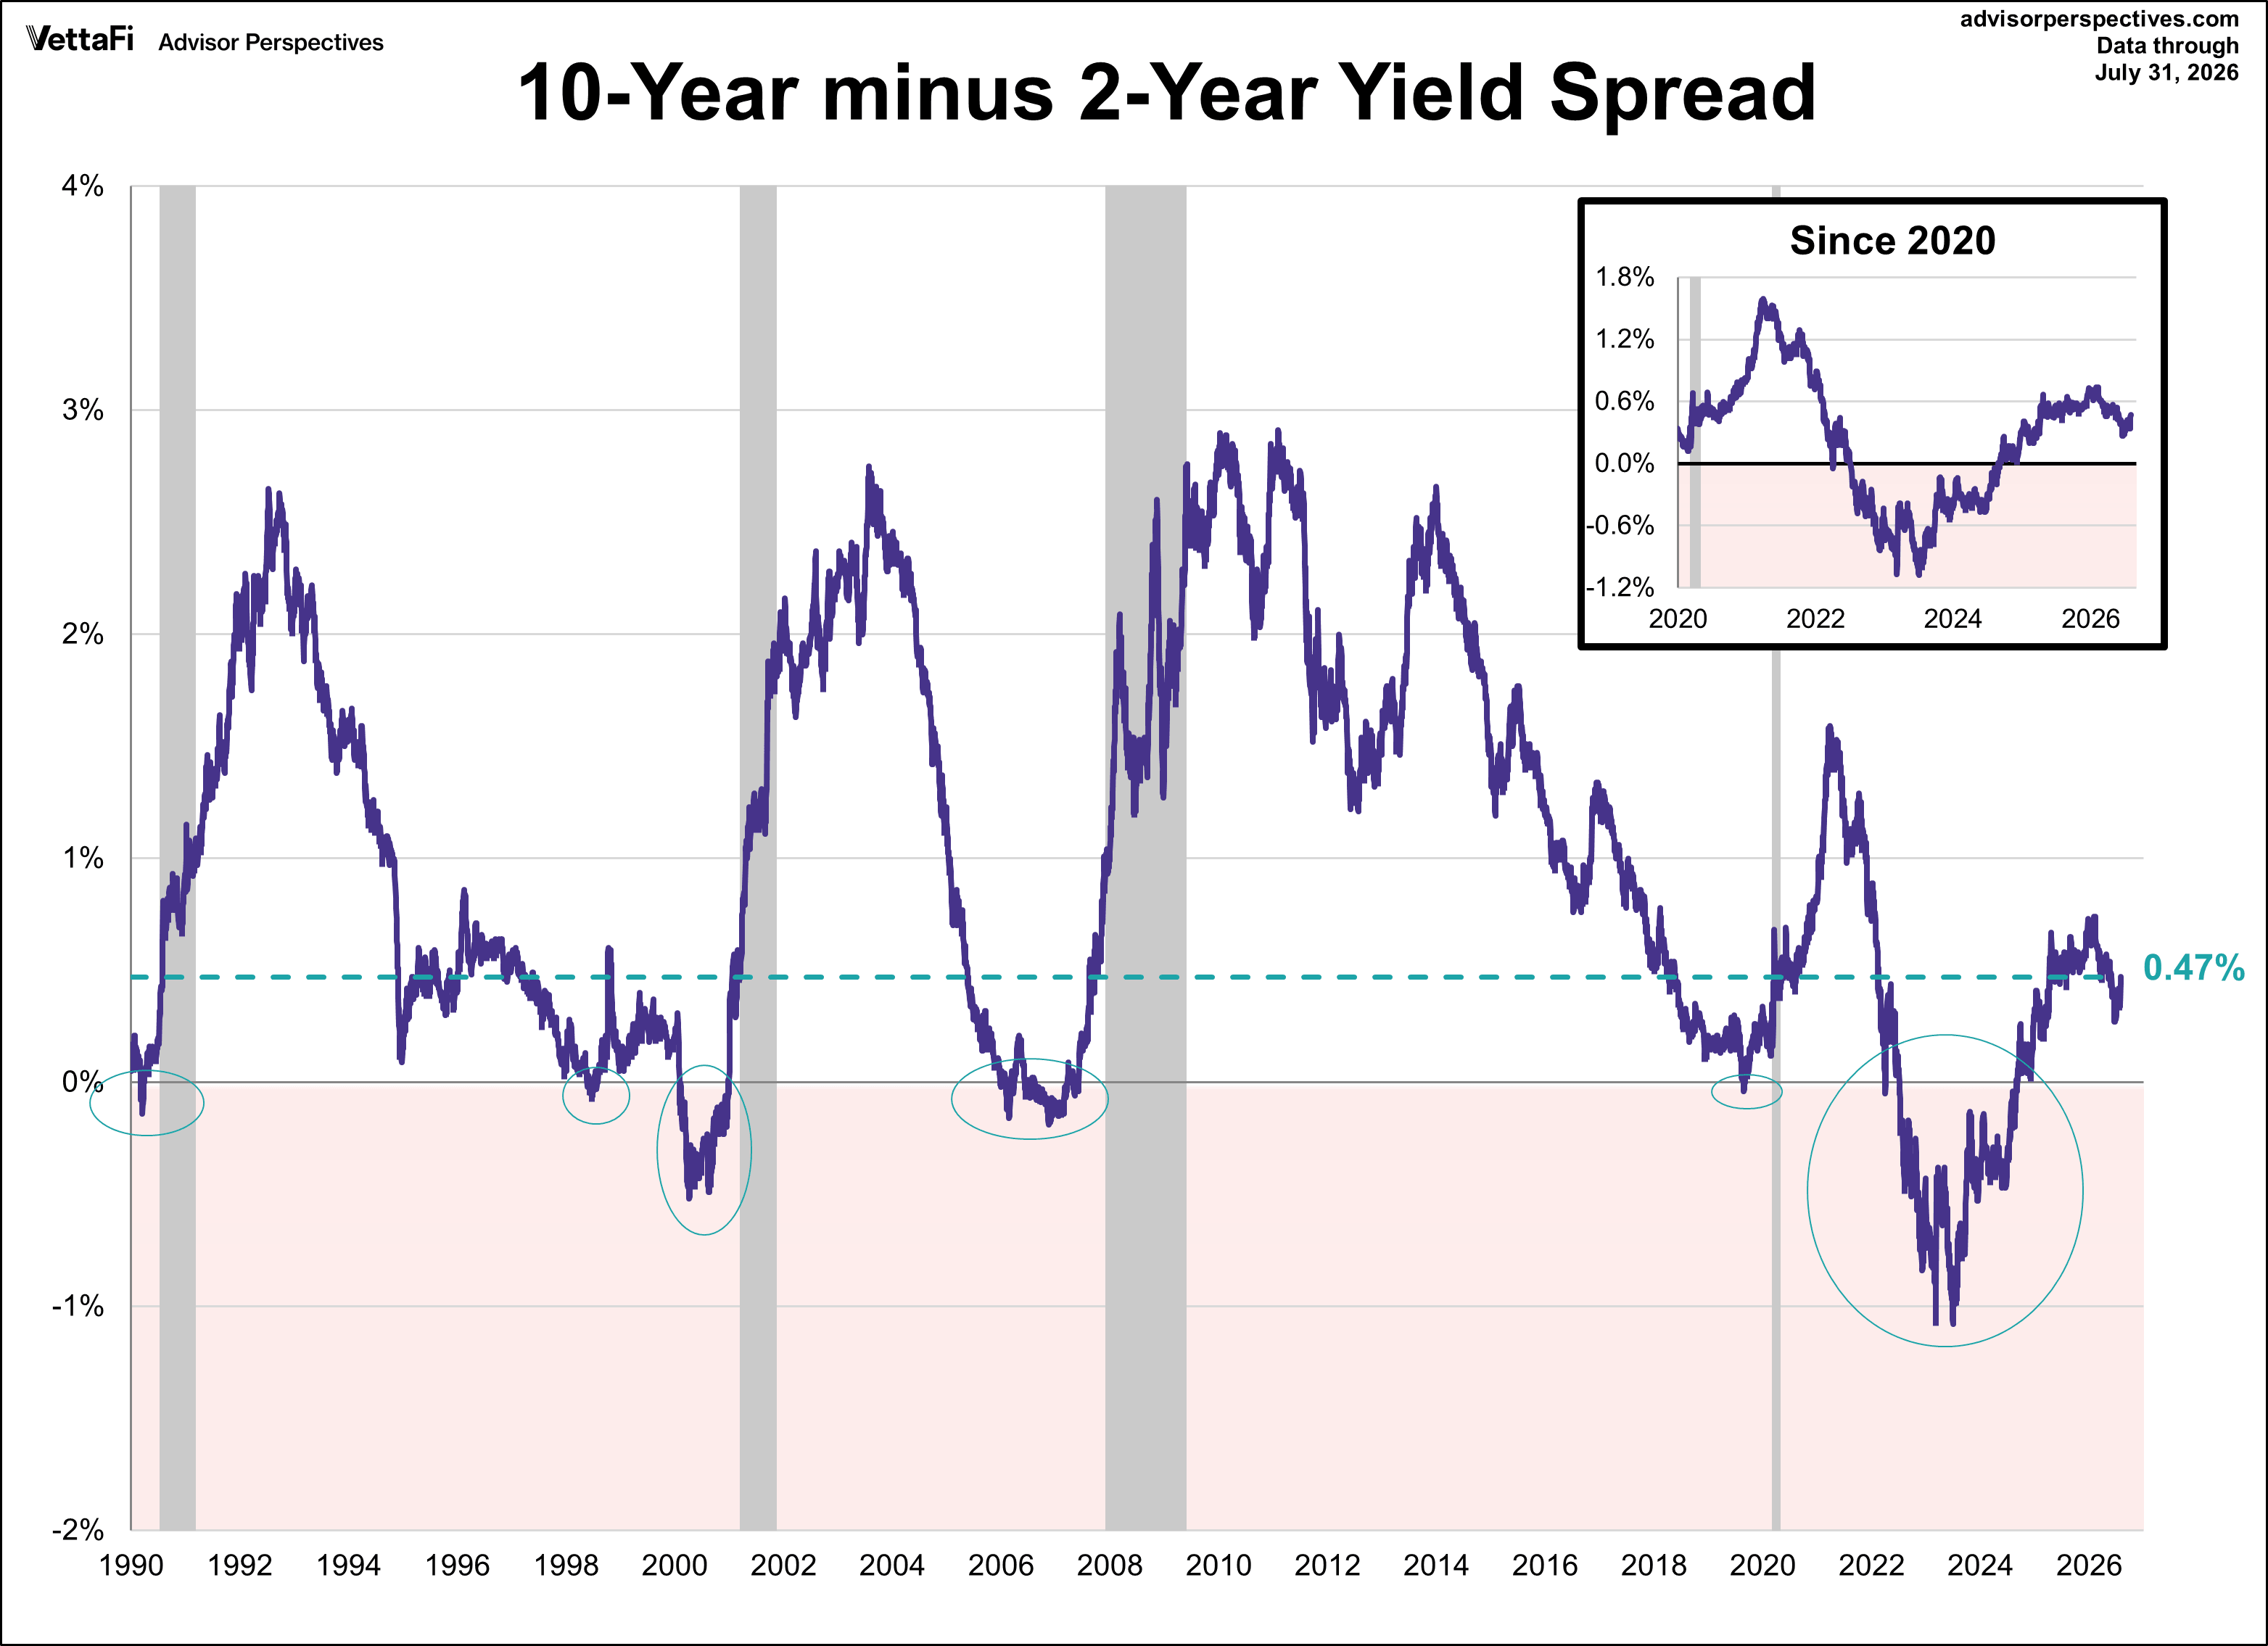
Inverted Yield Curve
An inverted yield curve is when longer-term Treasury yields are lower than their shorter term counterparts. The next chart displays the latest 10-2 spread. Typically, the spread turns negative for a period before rising again prior to recessions, as illustrated in the four recessions shown on this chart. For this reason, the 10-2 spread is widely considered a reliable leading indicator for recessions. The lead time between a negative spread and the onset of a recession varies, with recessions beginning anywhere from 18 to 92 weeks after the spread goes negative.
One false positive is seen in 1998, where the spread briefly went negative without leading to a recession. In the case of the 2009 recession, the spread went negative multiple times before rising again. Most recently, the spread was continuously negative from July 5, 2022, to August 26, 2024. The last time the spread was negative was on September 5, 2024.
If we consider the first negative spread date as the starting point, the average lead time to a recession is 48 weeks, or about eleven months. If we instead use the last positive spread date before a recession, the average lead time is 18.5 weeks, or about 4.25 months.
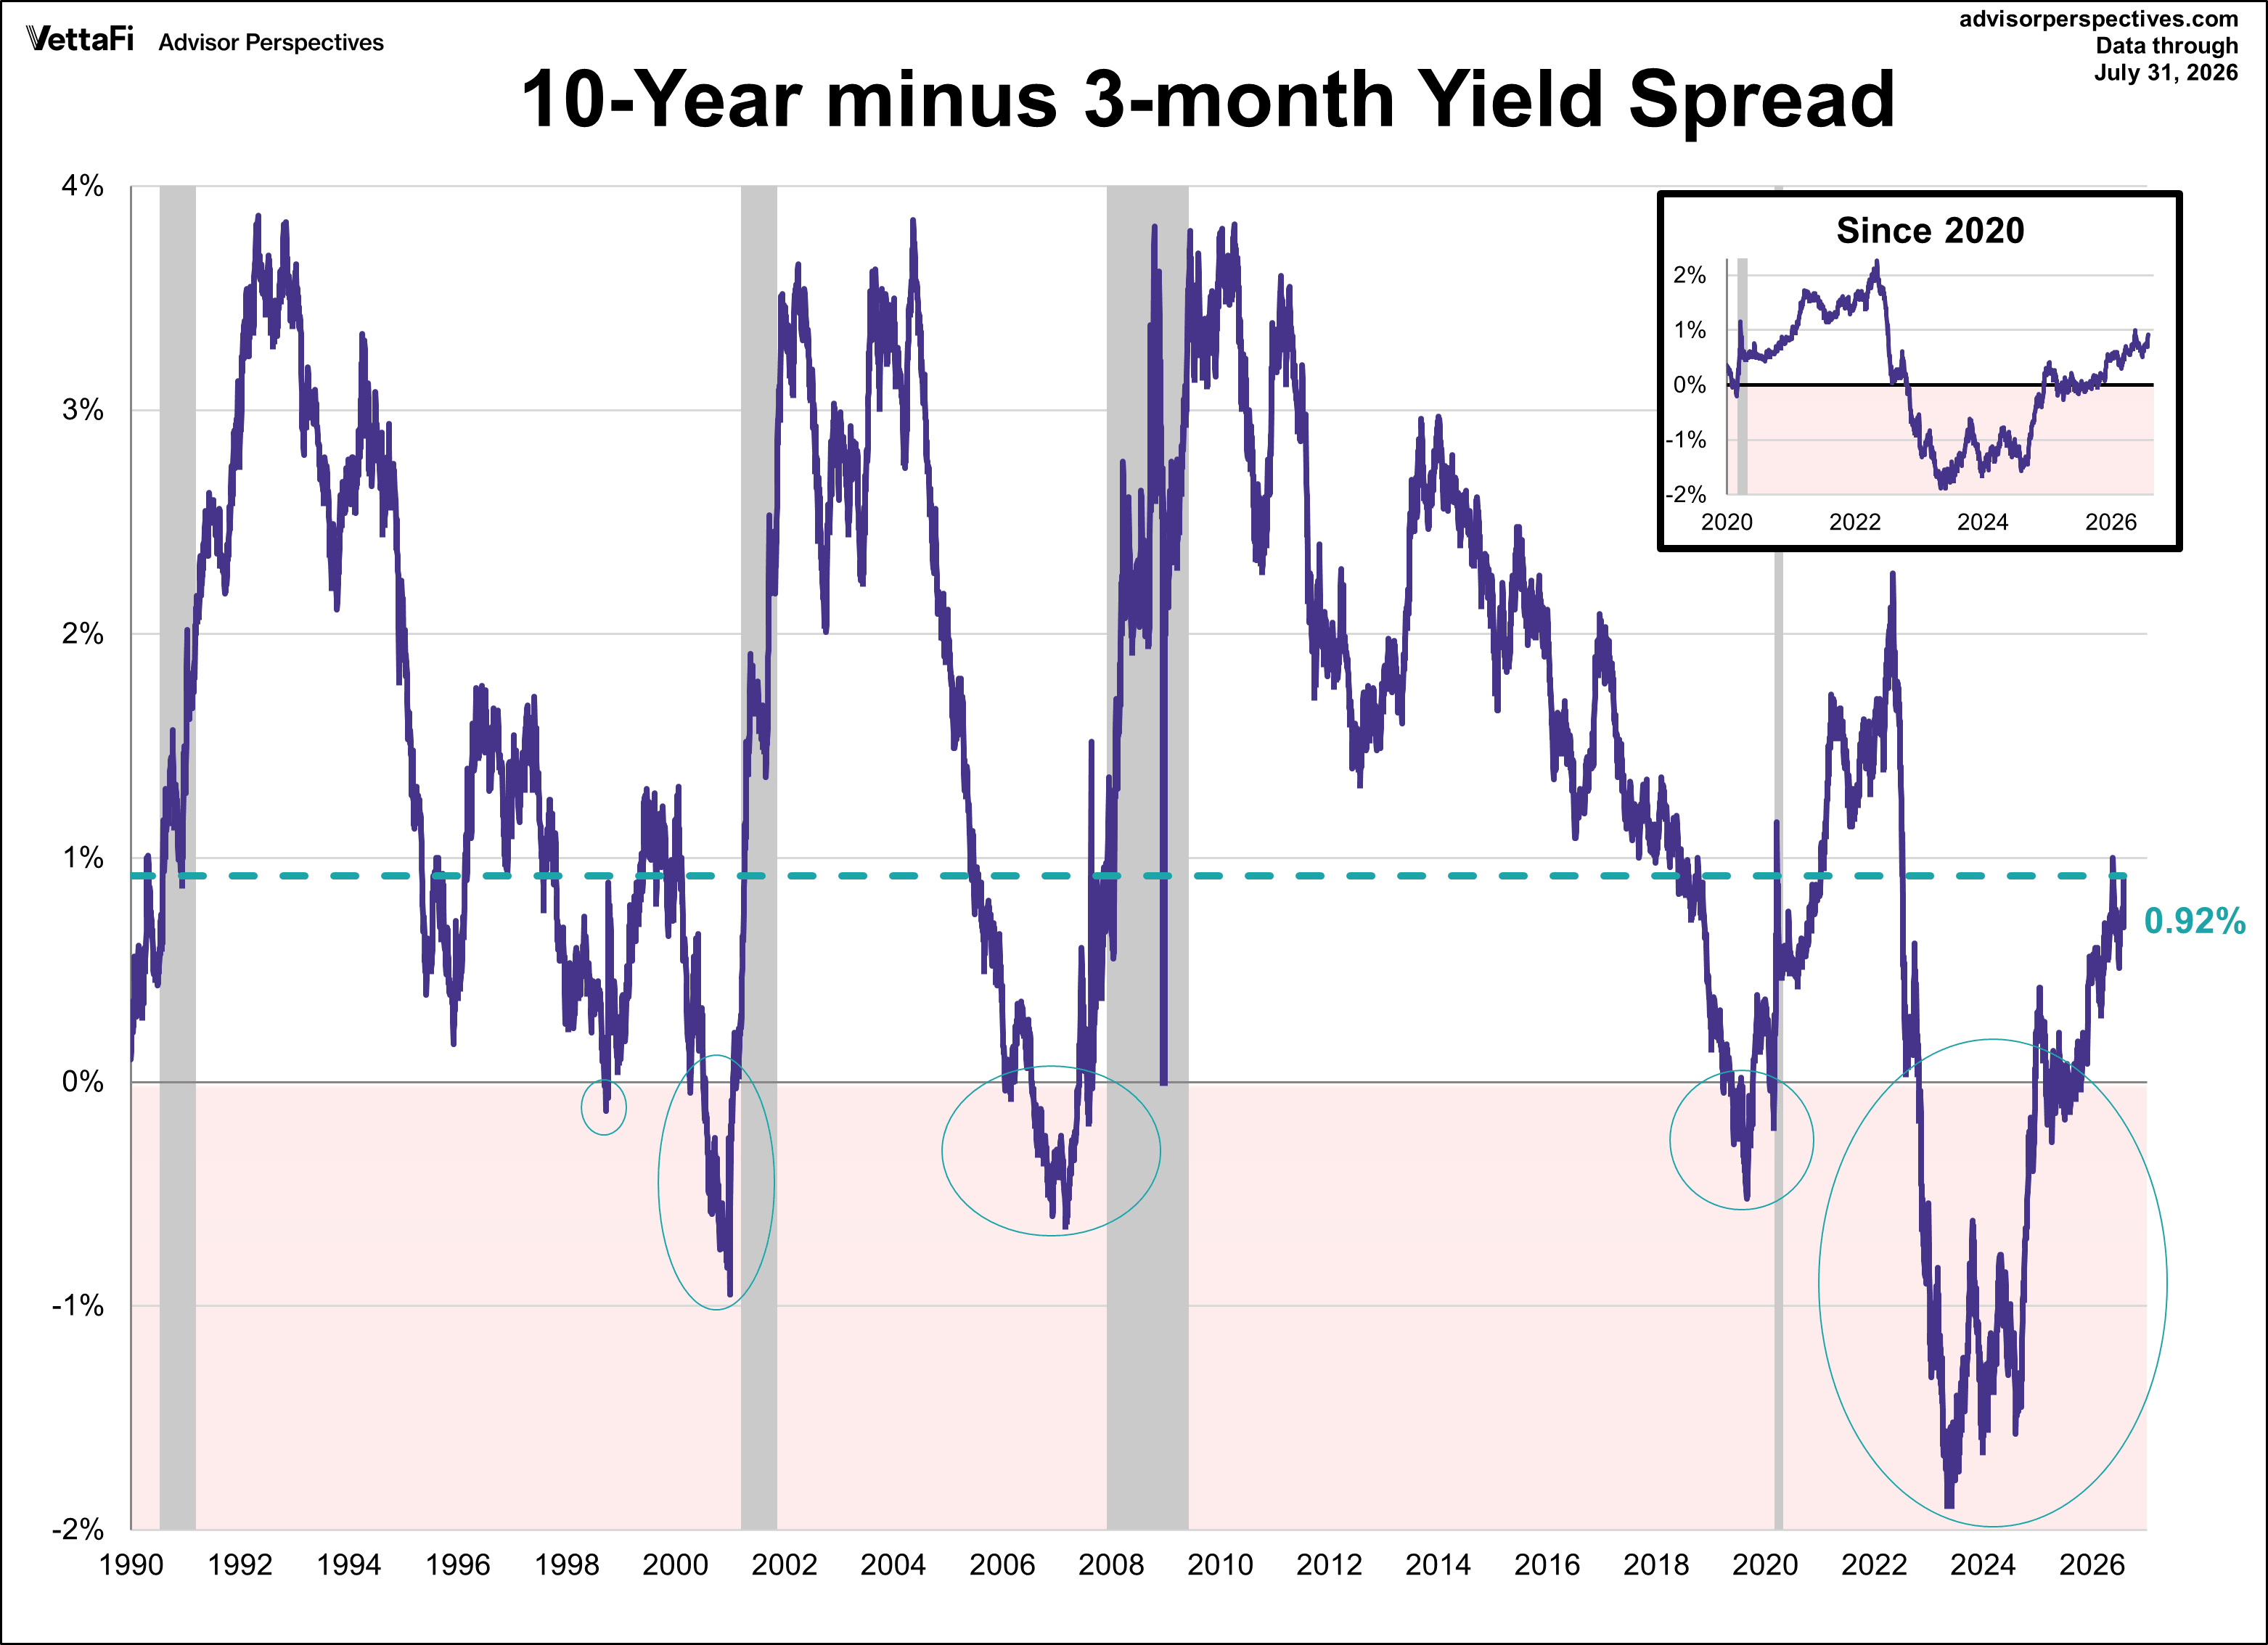
For another perspective on the yield curve, the 10-3mo spread below uses an even shorter-term maturity. The lead time to recessions based on this spread (after it turns negative) ranges from 34 to 69 weeks. Like the 10-2 spread, we see the same false positive in 1998, as well as multiple instances of the spread turning negative before rising again ahead of the 2009 recession. Recently, the spread was negative from October 25, 2022 to December 12, 2024. Since February 26th the spread has swung back and forth from positive to negative territory.
If we consider the first negative spread date as the starting point, the average lead time to a recession is 48 weeks, or about eleven months. If we instead use the last positive spread date after the spread had been negative, the average lead time is 13 weeks, or about three months.
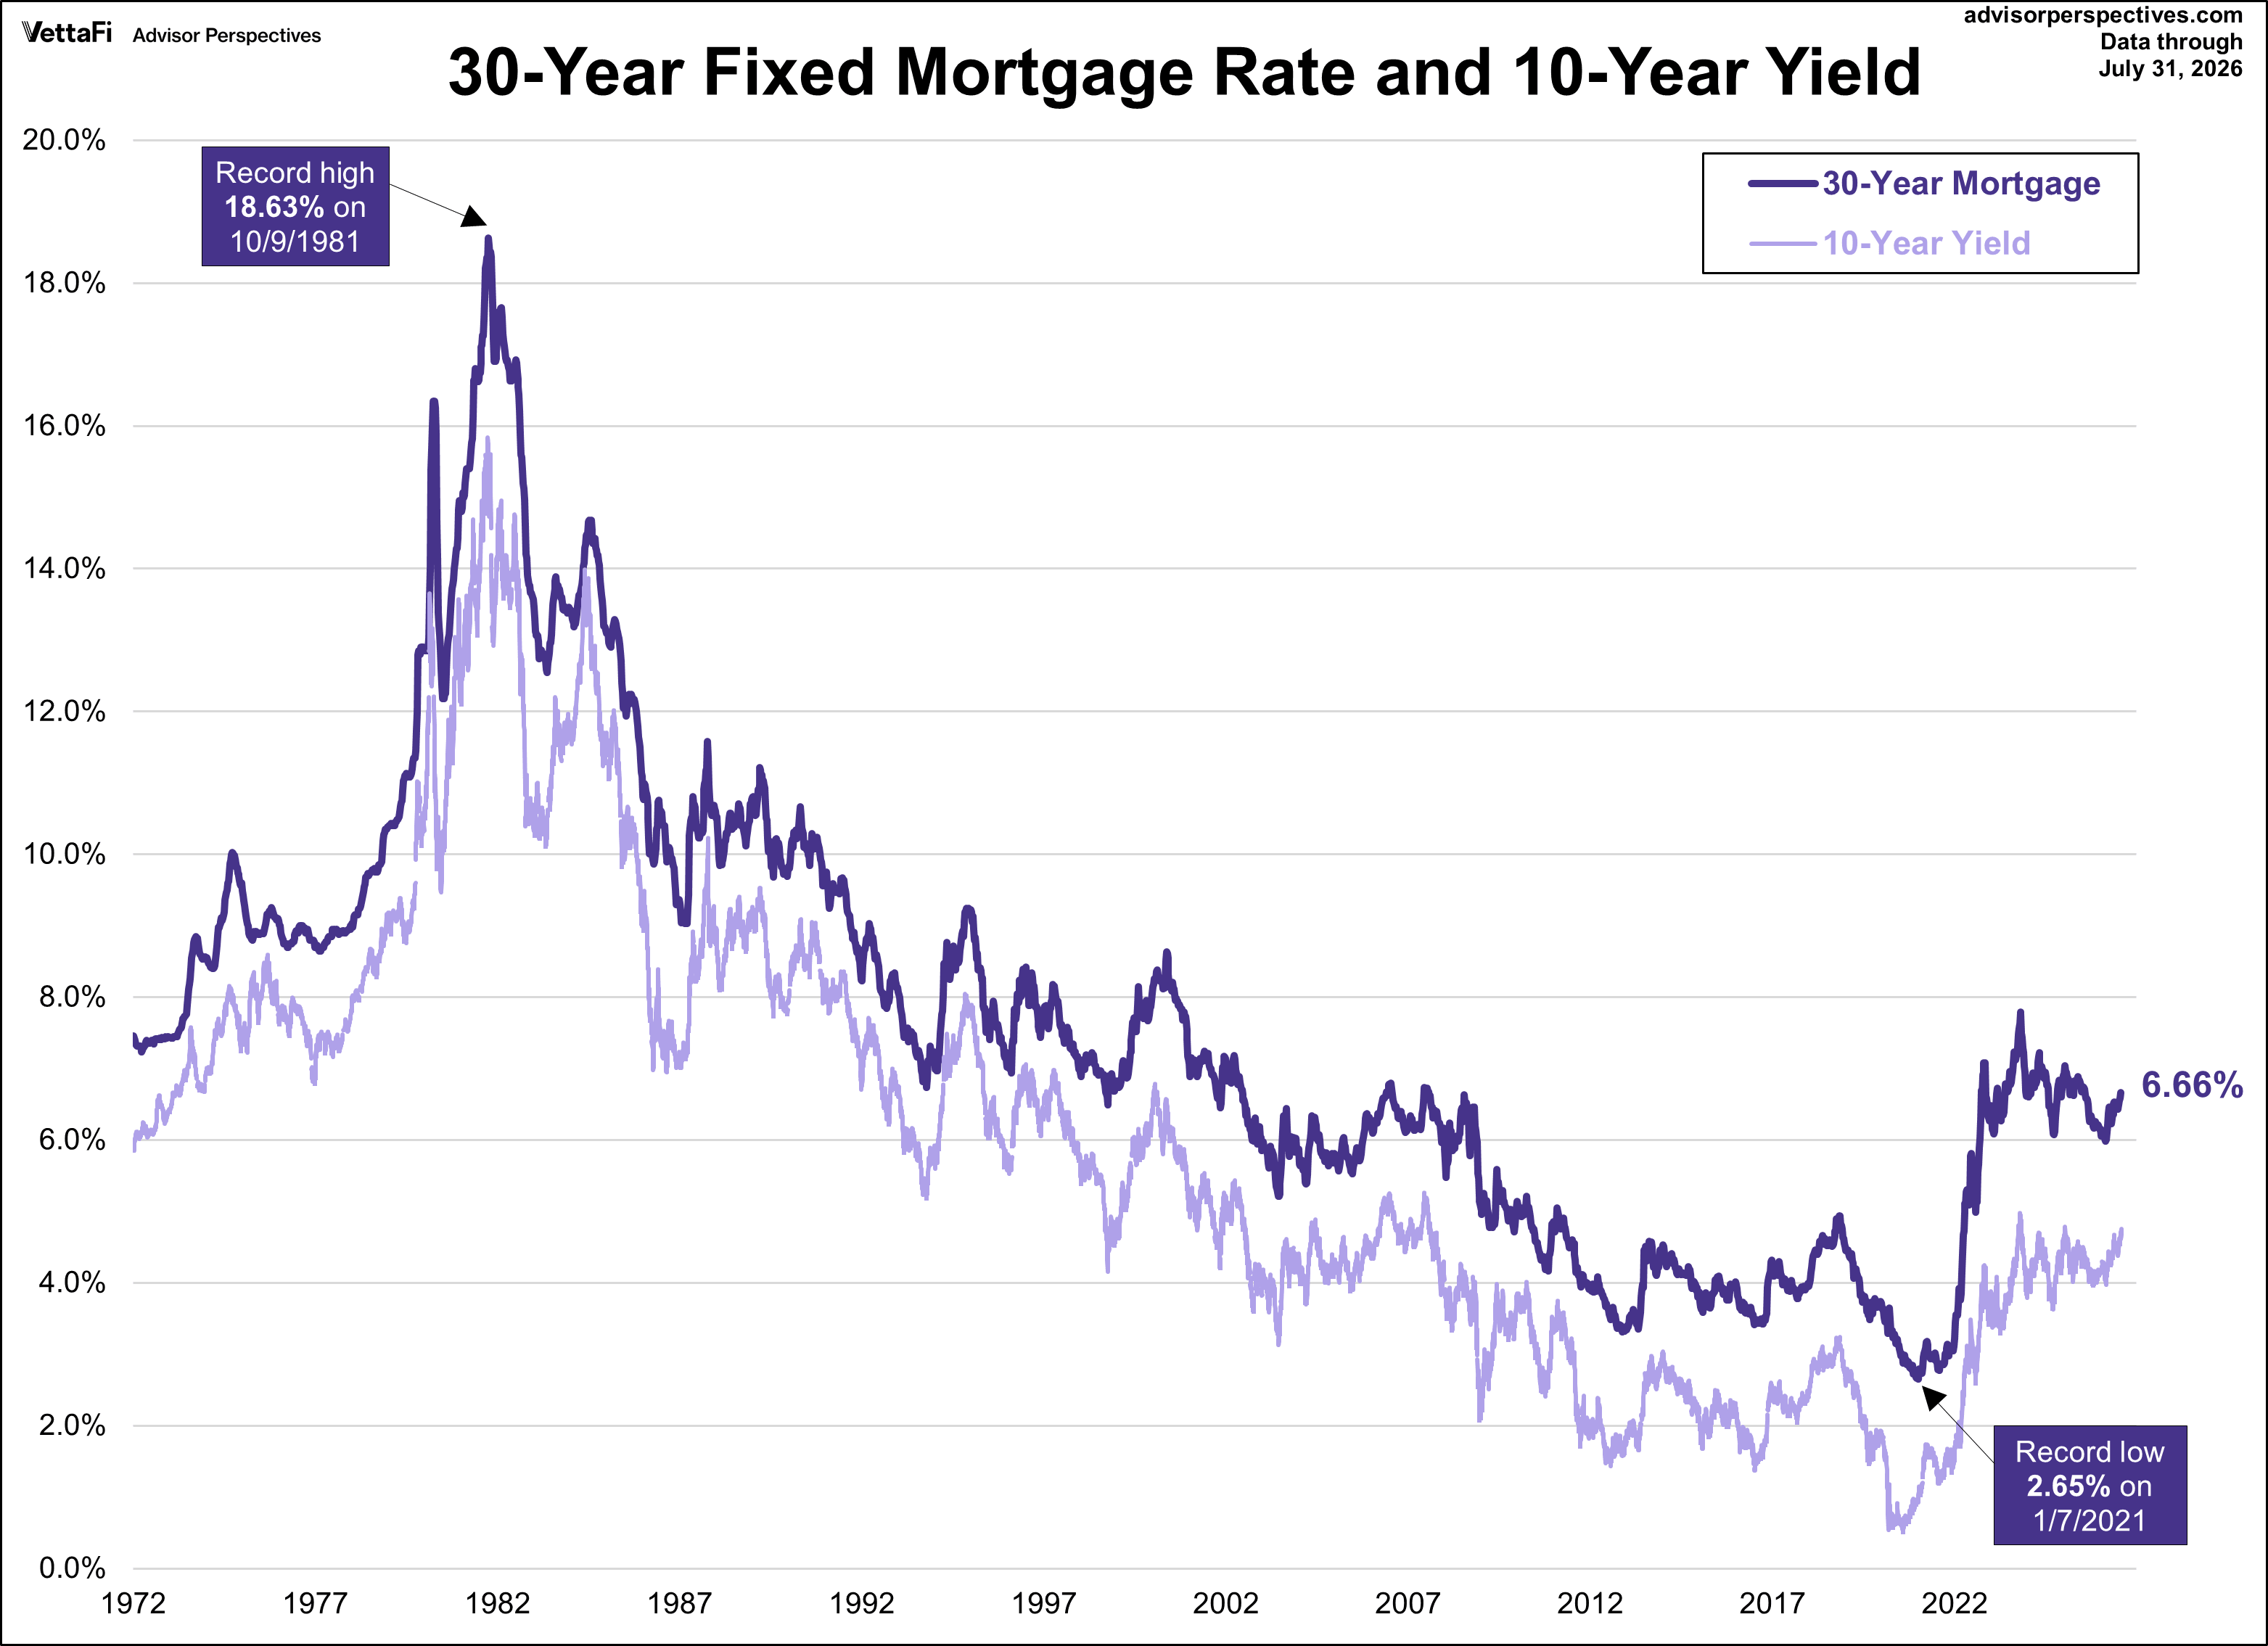
The 30-Year Fixed Rate Mortgage
The Federal Funds Rate influences the cost of borrowing for banks. When the Fed increases this rate, banks often raise their lending rates, which can impact mortgage rates, among other things. Therefore, a rising FFR generally leads to higher mortgage rates, and vice versa. However, this was not the case recently when the Fed began their rate cutting cycle in September 2024 and mortgage rates moved in the opposite direction. With that said, mortgage rates have been on the decline as of late, following a similar fashion of the FFR. The latest Freddie Mac Weekly Primary Mortgage Market Survey put the 30-year fixed rate at 6.66%, unchanged from last week and still the highest level since last August.
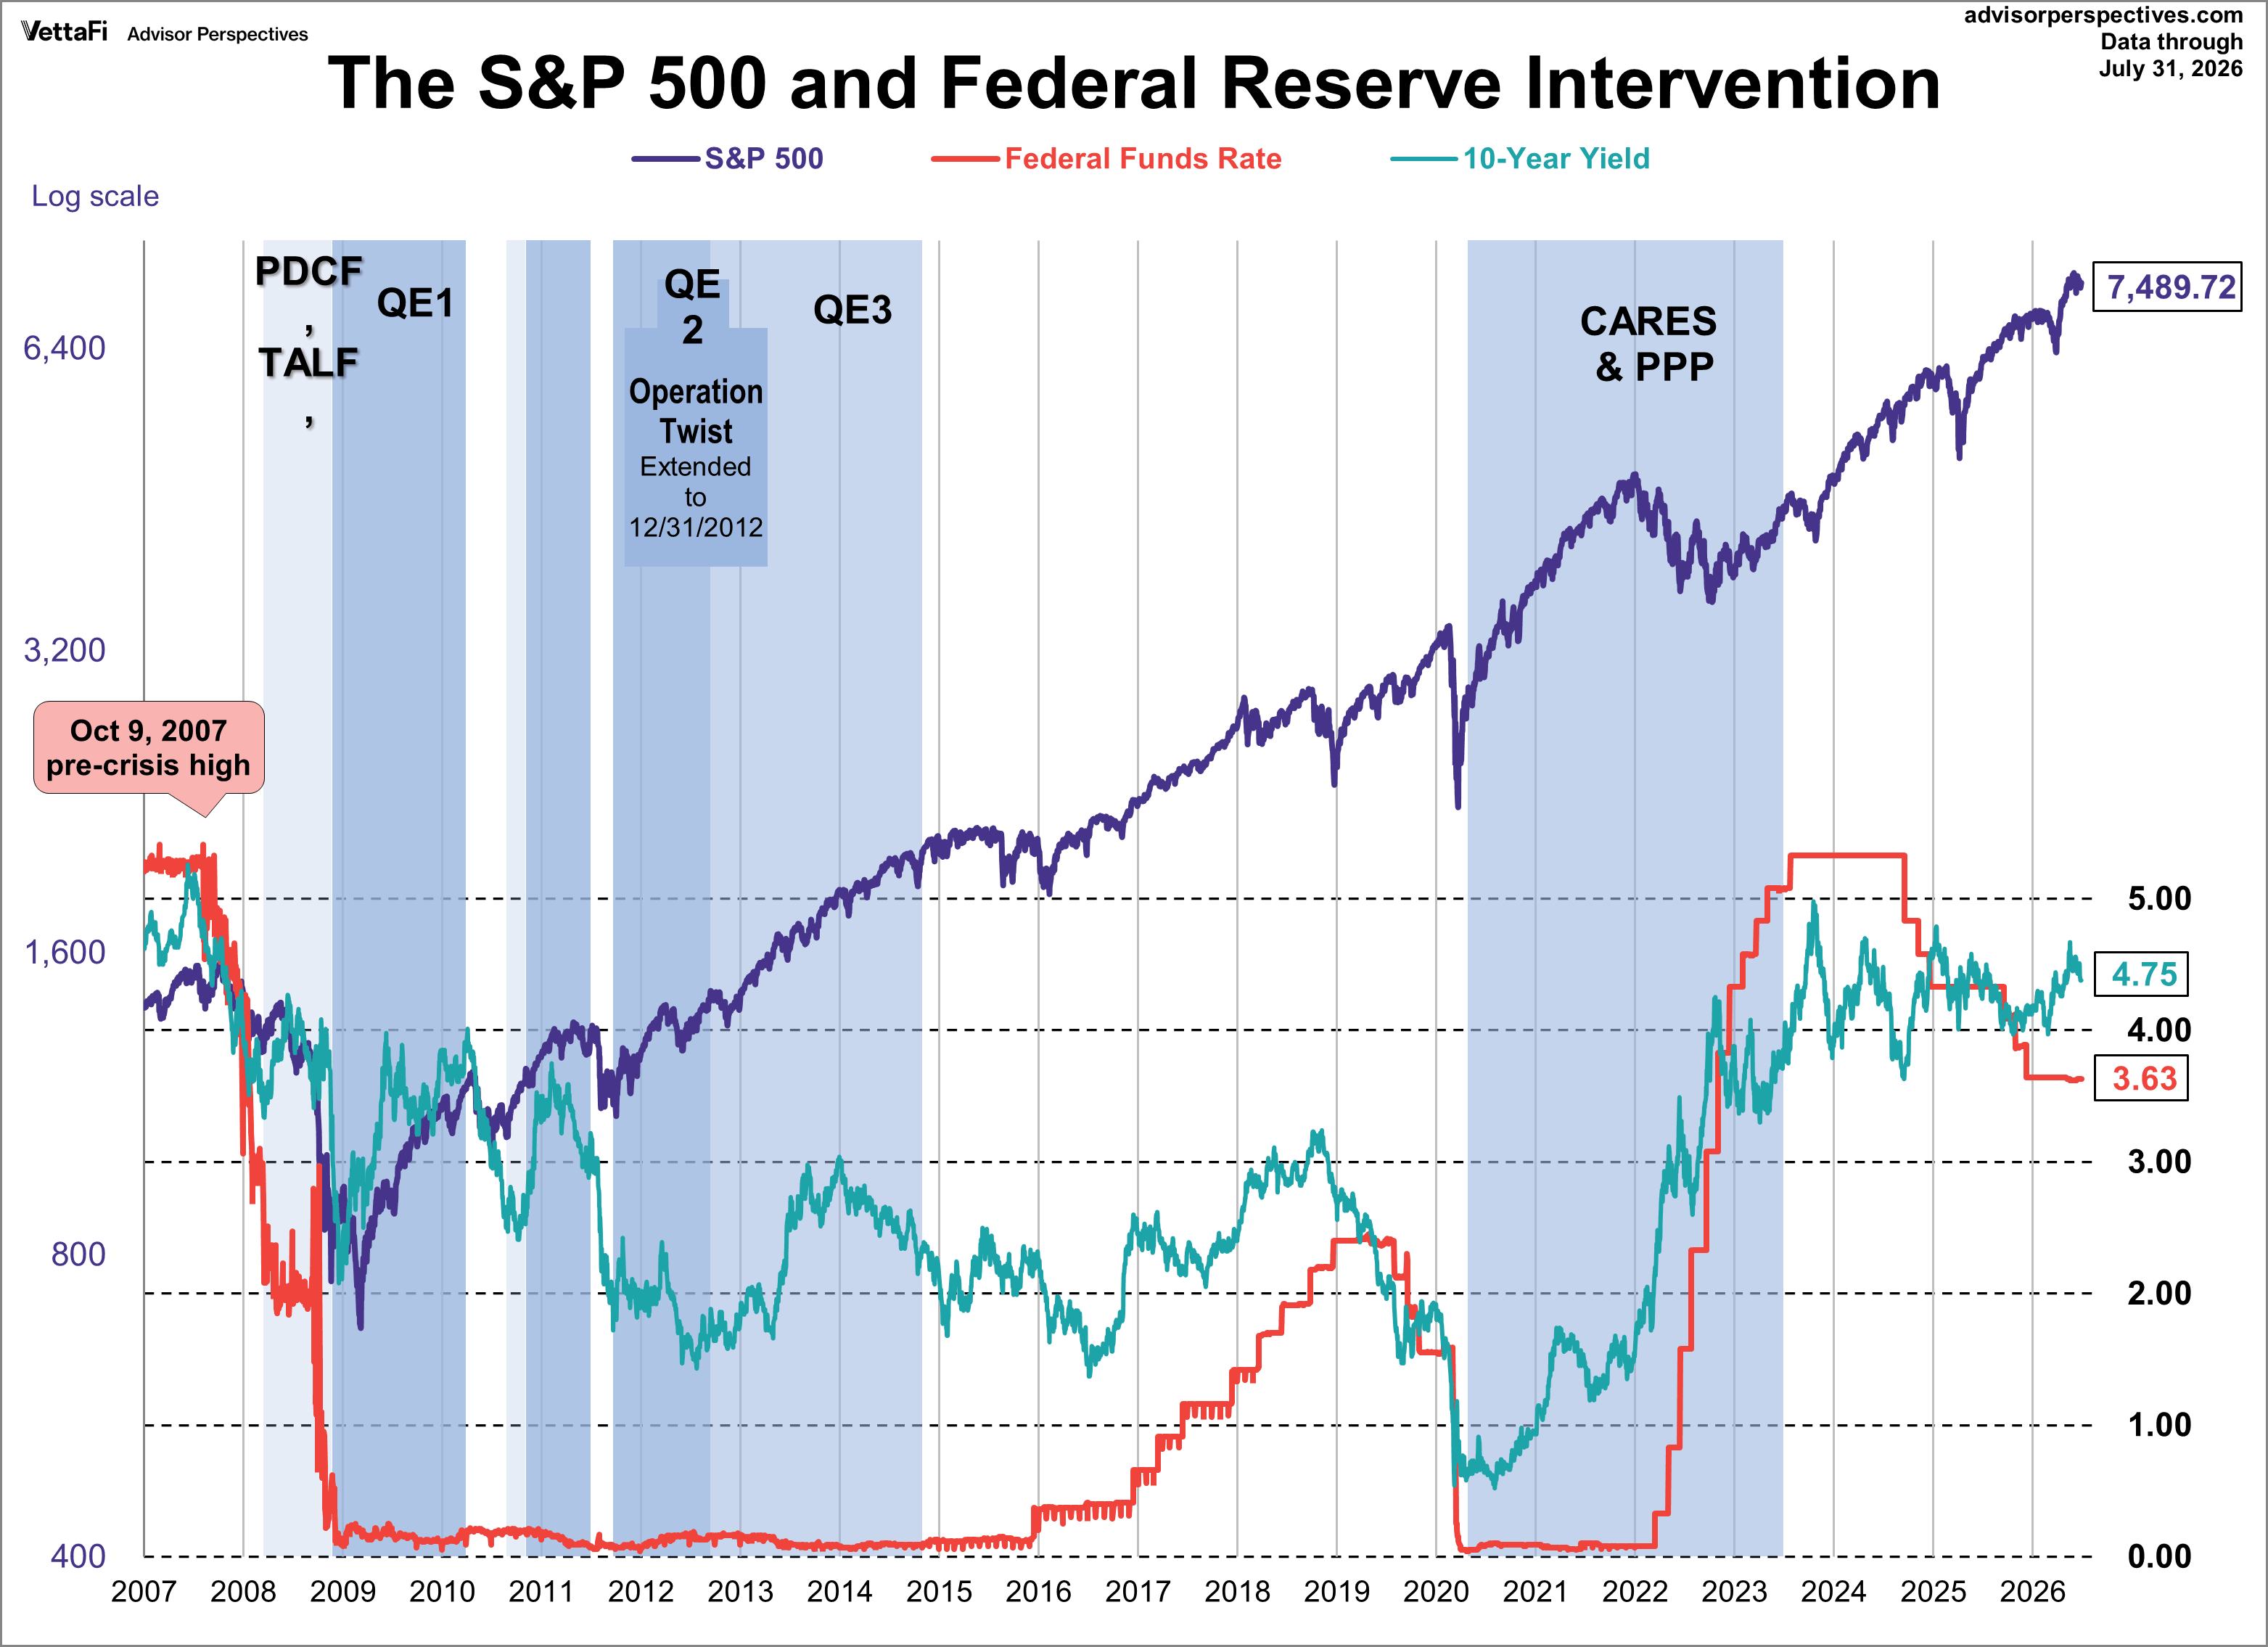
Now let's see the 10-year against the S&P 500 with some notes on Federal Reserve intervention. Fed policy has been a major influence on market behavior.
For a long-term view of weekly Treasury yields, also focusing on the 10-year, see our latest Treasury Yields in Perspective update.
ETFs associated with Treasuries include: Vanguard 0-3 Month Treasury Bill ETF (VBIL), Vanguard Intermediate-Term Treasury ETF (VGIT), and Vanguard Long-Term Treasury ETF (VGLT).


