Durable Goods Orders Sink 4.5% in May, Less Than Expected
Membership required
Membership is now required to use this feature. To learn more:
View Membership BenefitsNew orders for manufactured durable goods sank 4.5% in May to $332.05B, slightly less than the projected 5.0% monthly decline. Compared to a year ago, new orders are down 3.5%.
Key Takeaways
- Durable goods orders decreased 4.5% in May to $332.1 billion, driven by transportation equipment.
-
Core durable goods orders, which exclude transportation, rose 1.3% in May, exceeding the projected 0.5% growth.
-
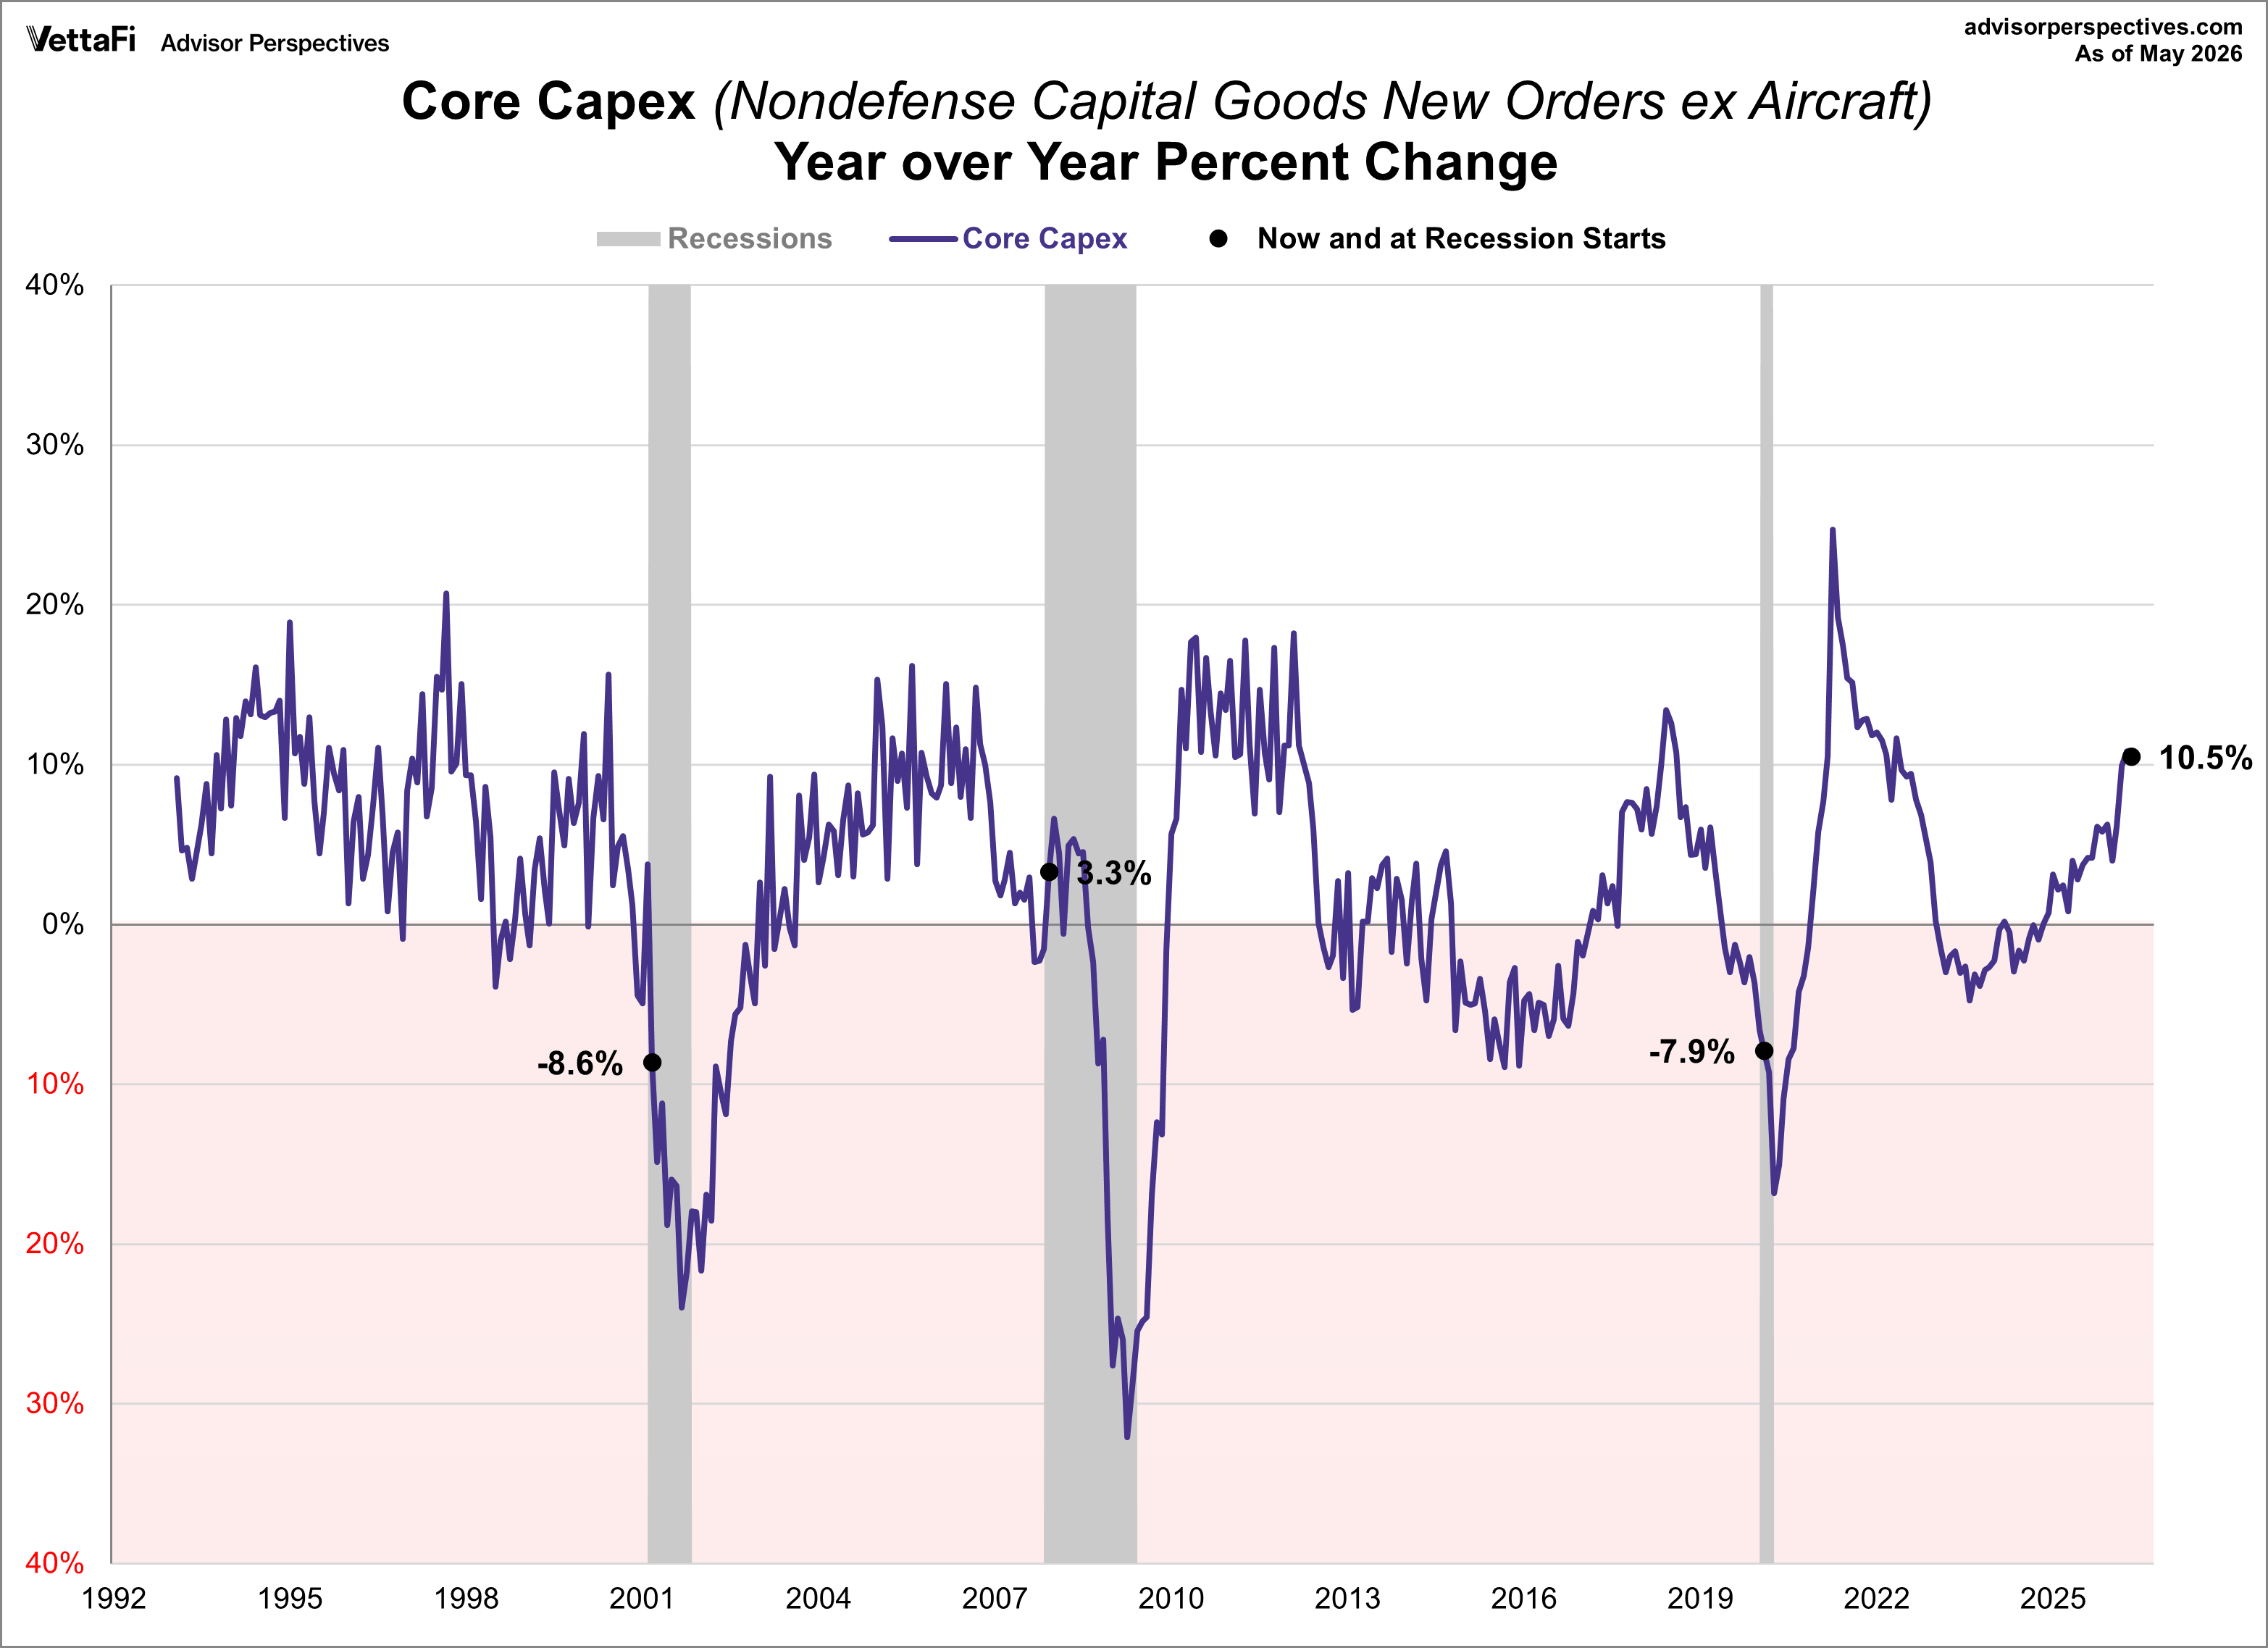
Core capex orders for non-defense capital goods excluding aircraft rose 1.6% month-over-month and 10.5% year-over-year.
Durable Goods
Durable goods refers to tangible products that can be stored or inventoried and that have an average life of at least three years. Durable goods are typically expensive and therefore tend to be purchased when there is confidence in the economy. New orders for durable goods are a leading indicator, meaning when purchases increase it typically hints at an improvement to the economy. On the flip side, when the new orders trend down it is indicating a lack of confidence in the economy.
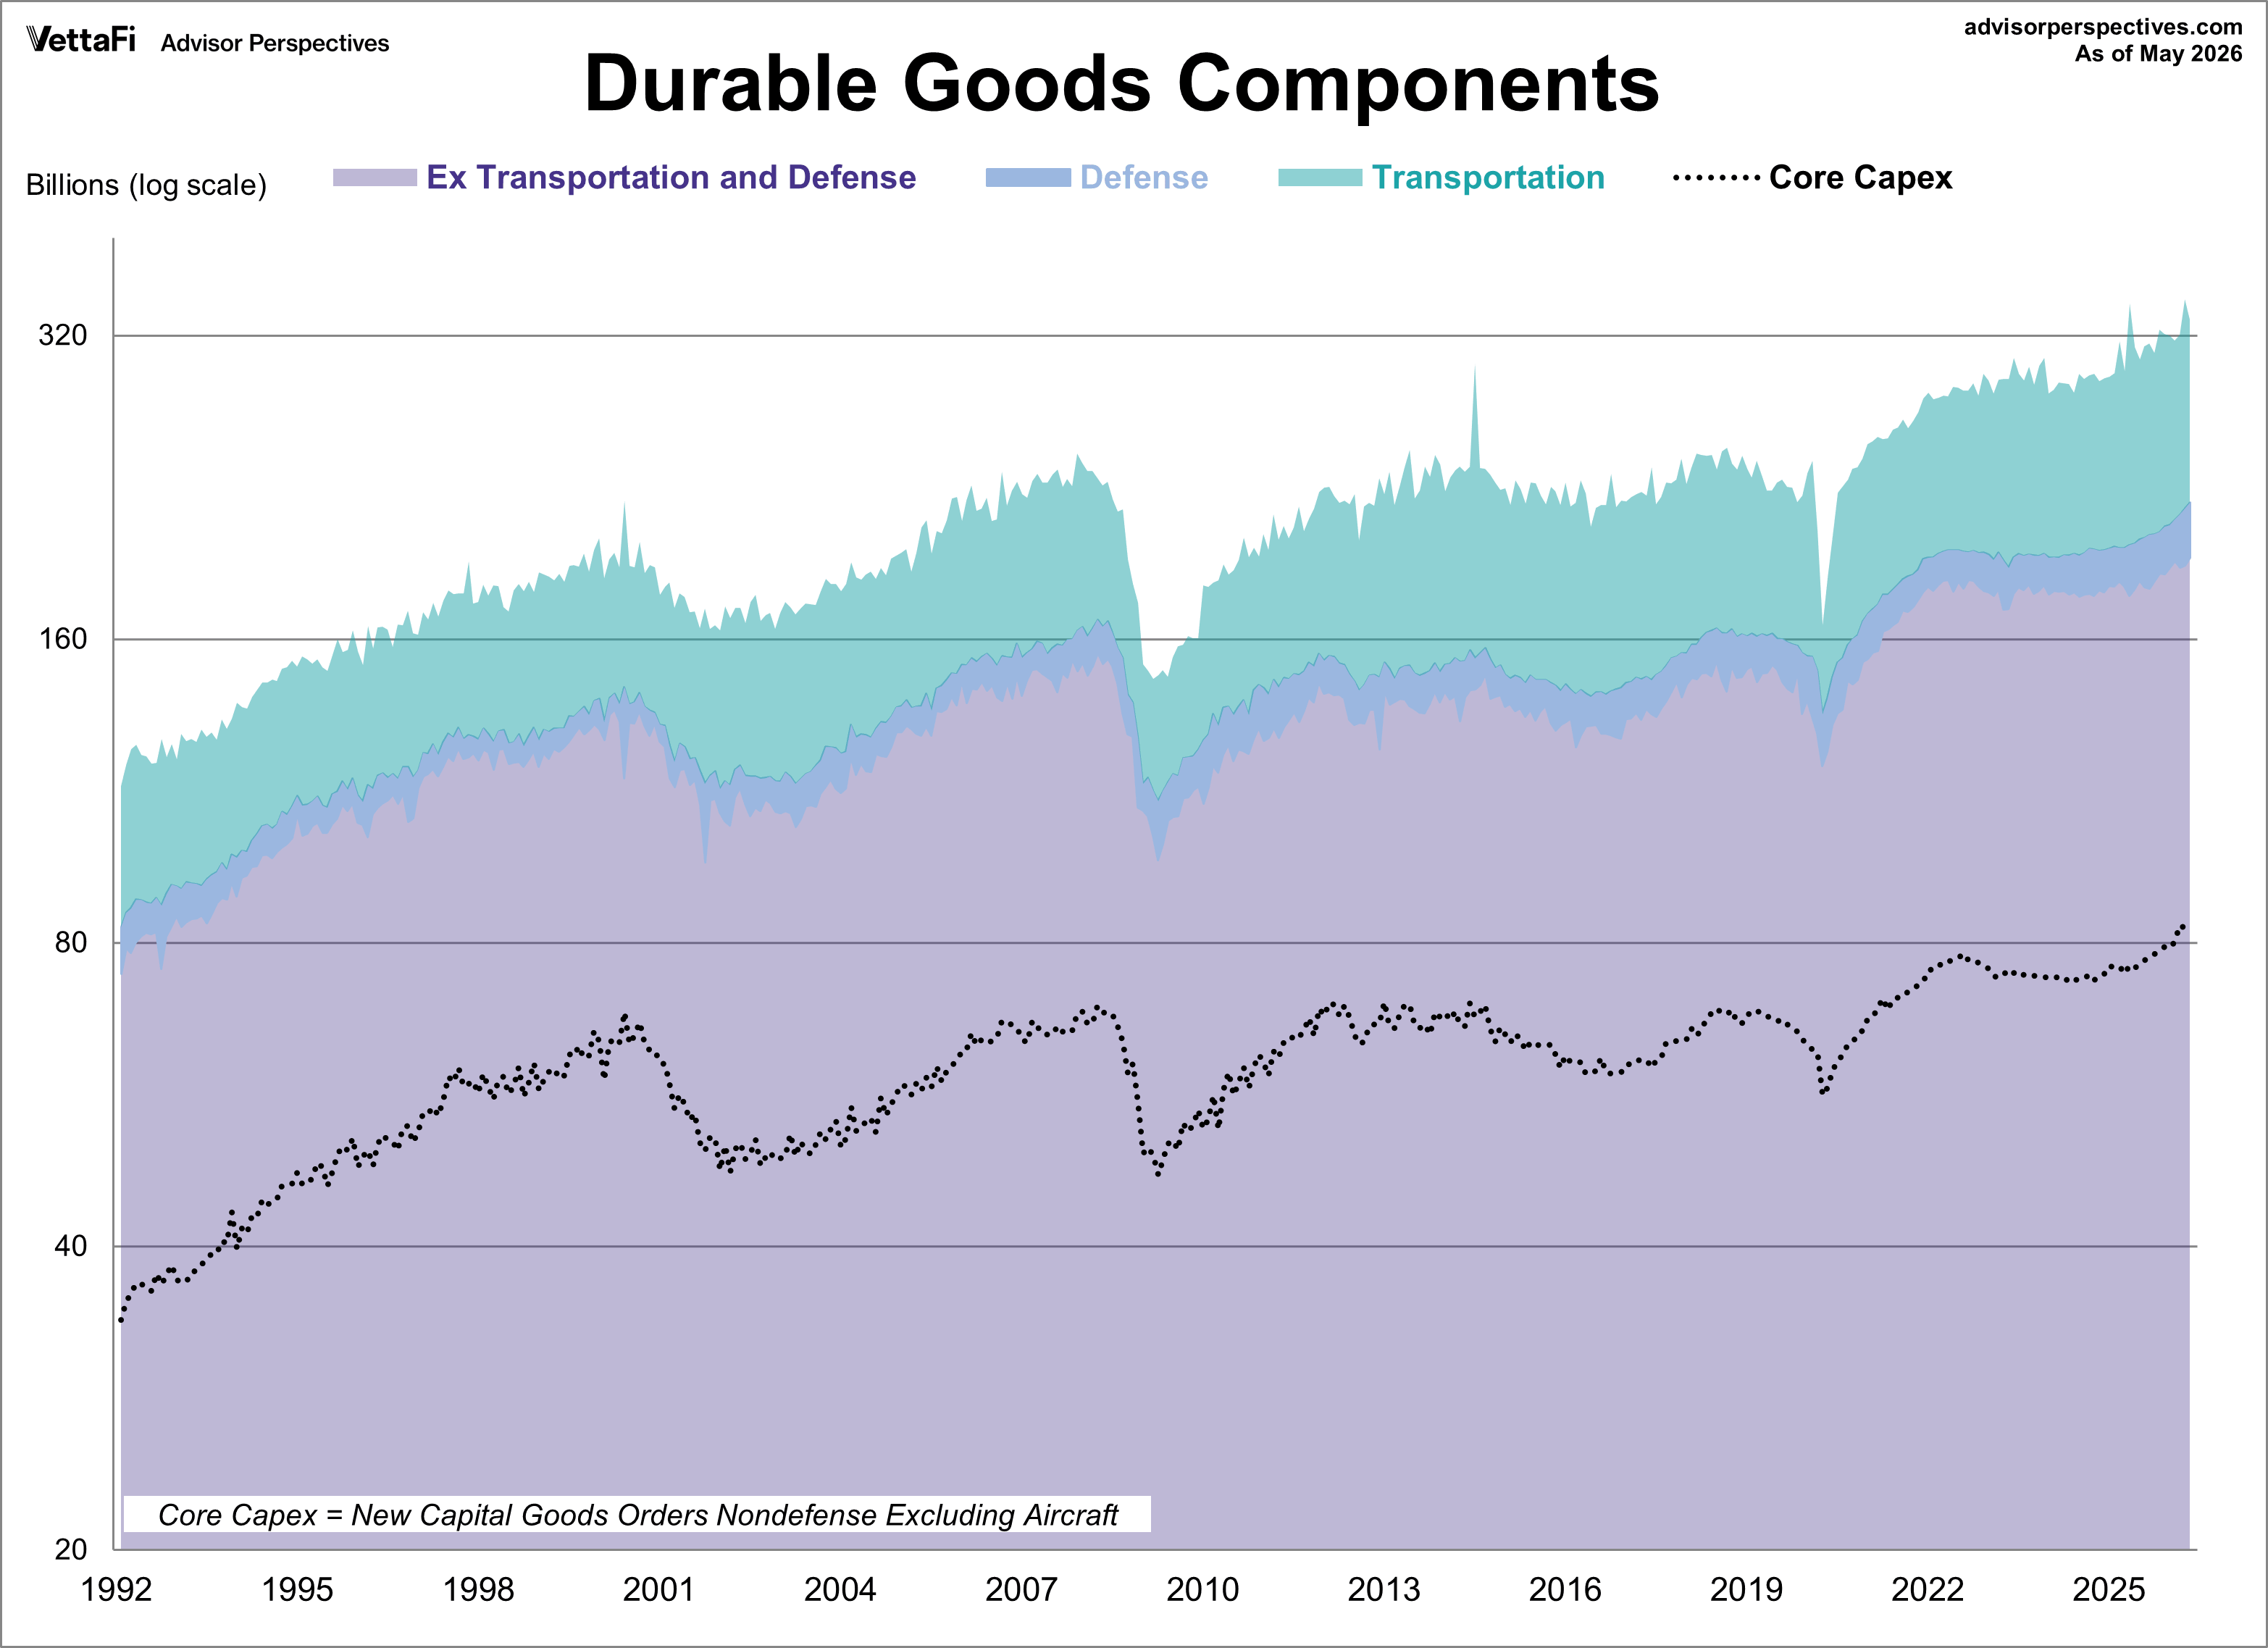
Economists frequently study this indicator excluding transportation or defense or both. Just how big are these two subcomponents? Here is a stacked area chart to illustrate the relative sizes over time based on the nominal data. We've also included a dotted line to show the relative size of the core capex subset, which we'll illustrate in more detail below.
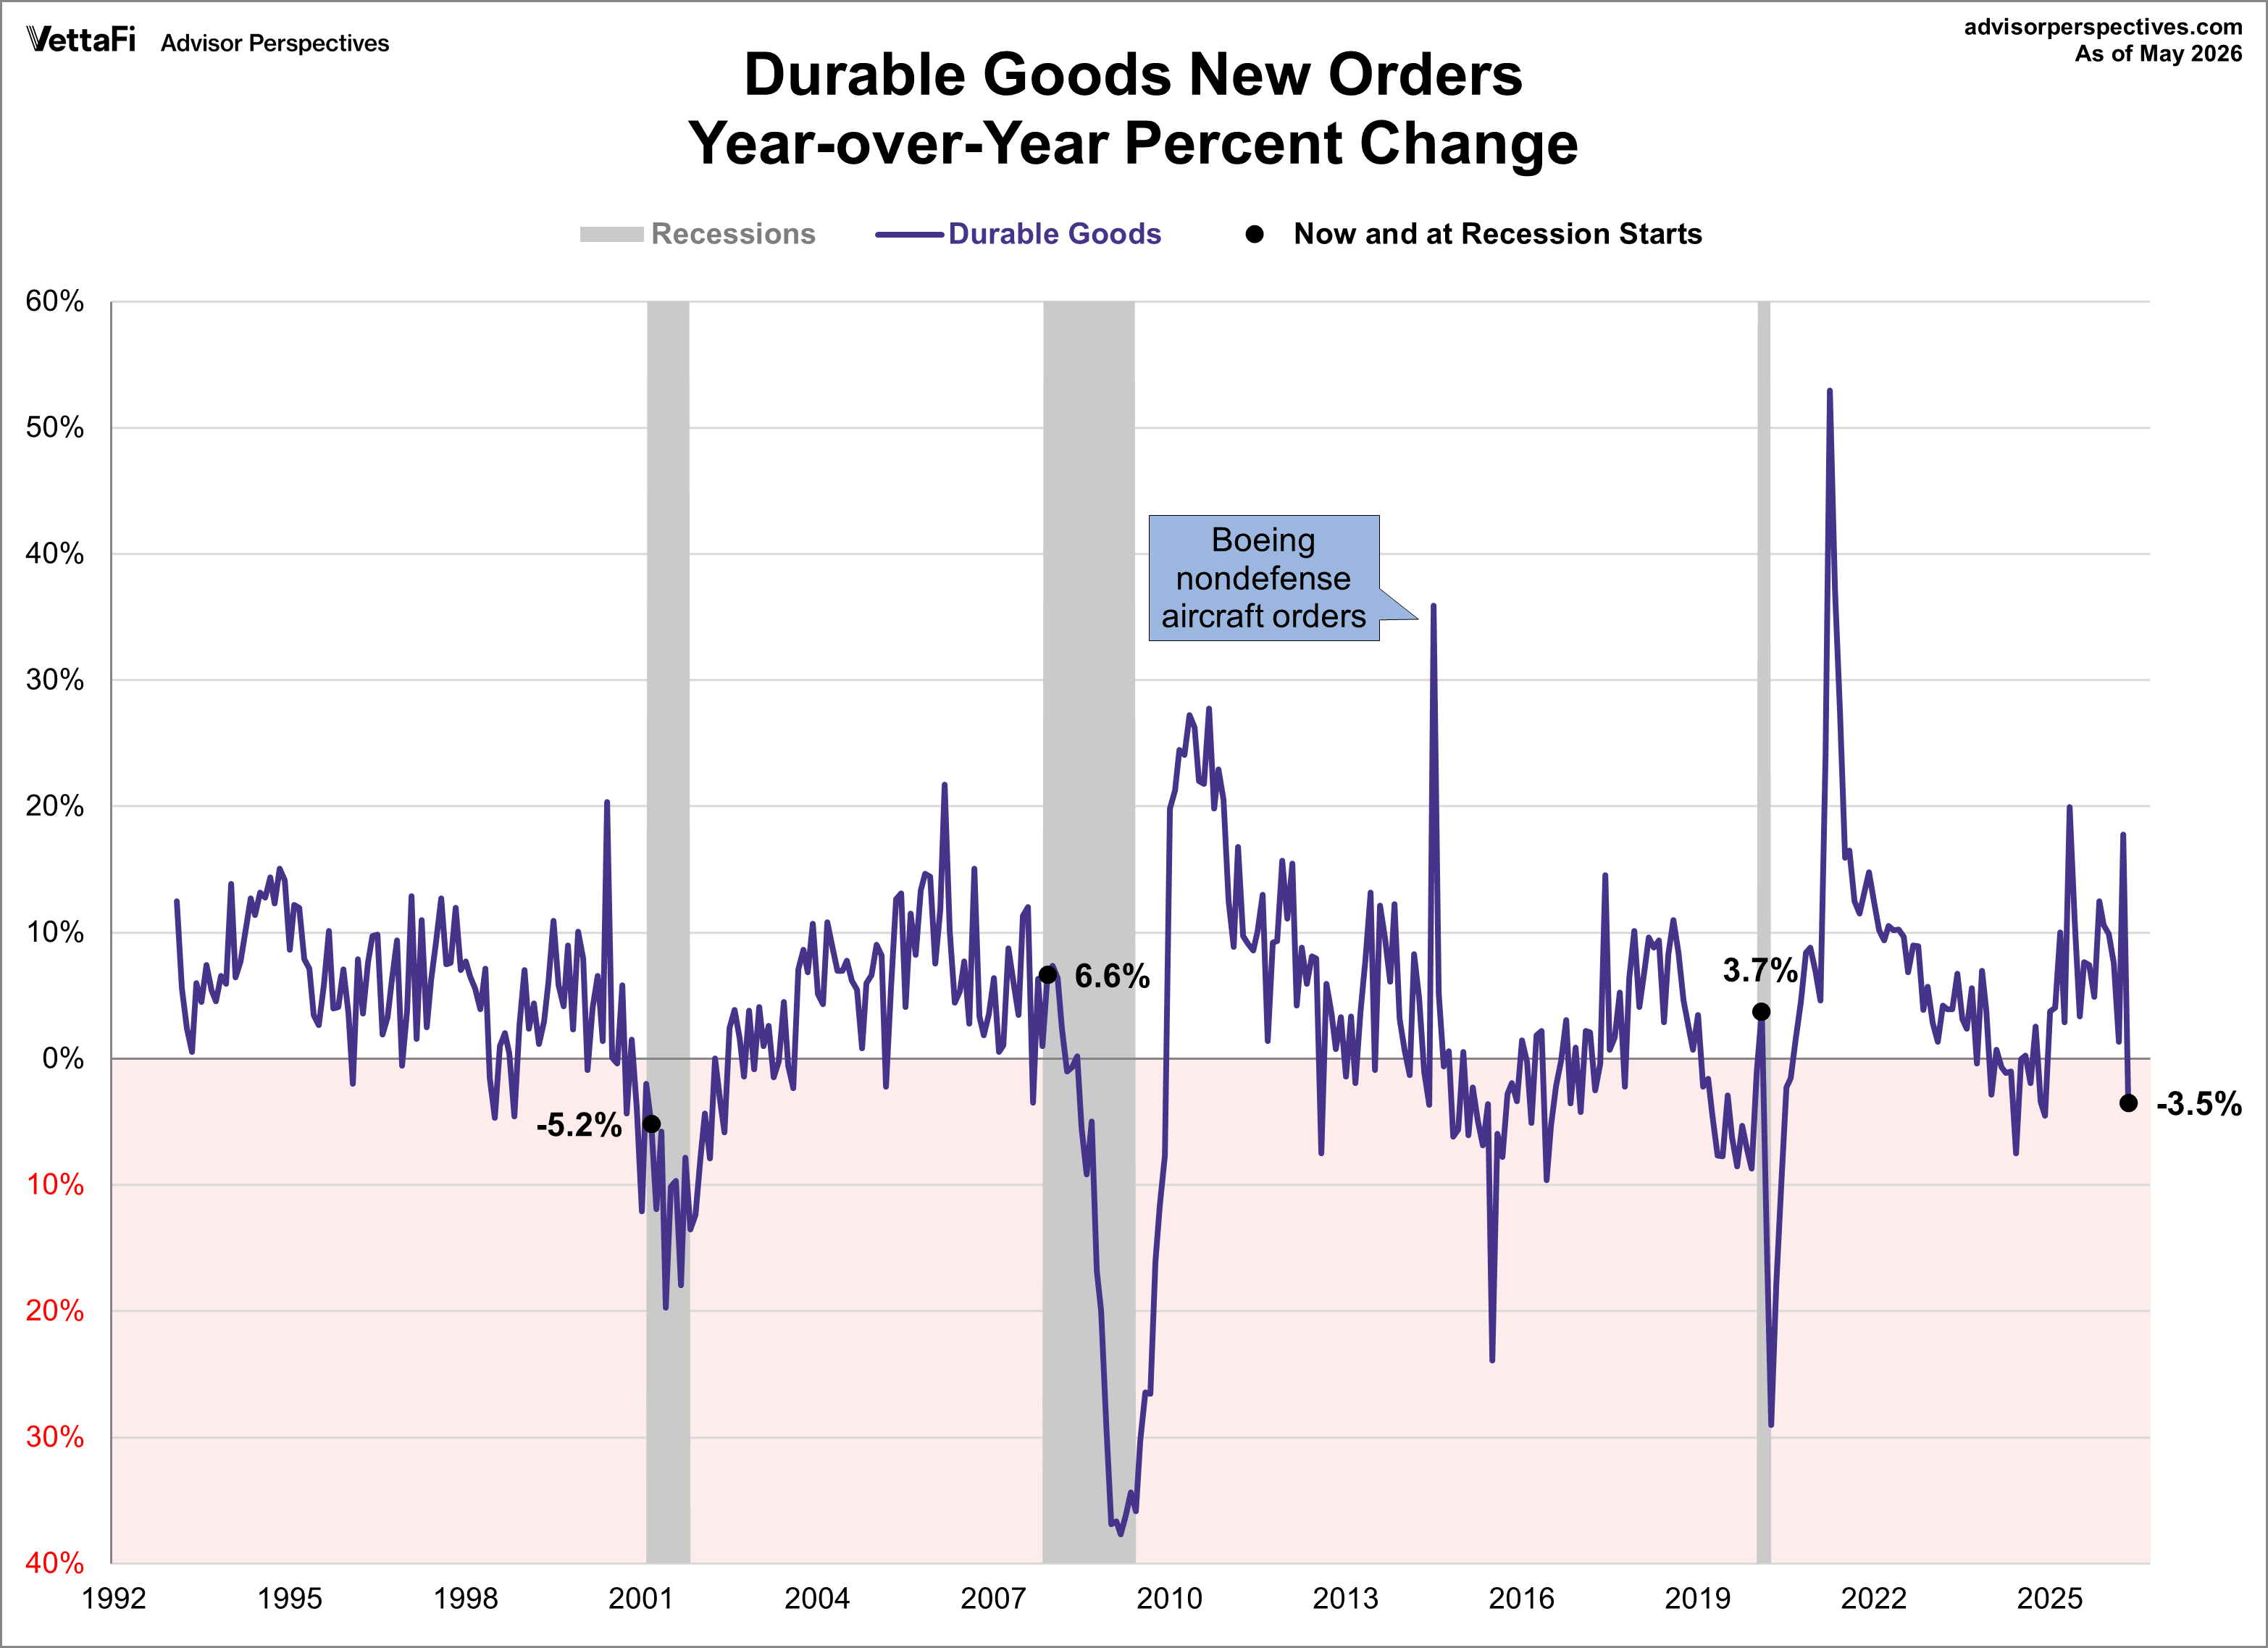
The next chart shows the year-over-year percent change in durable goods. We've highlighted the value at recession starts and the latest value for this metric.
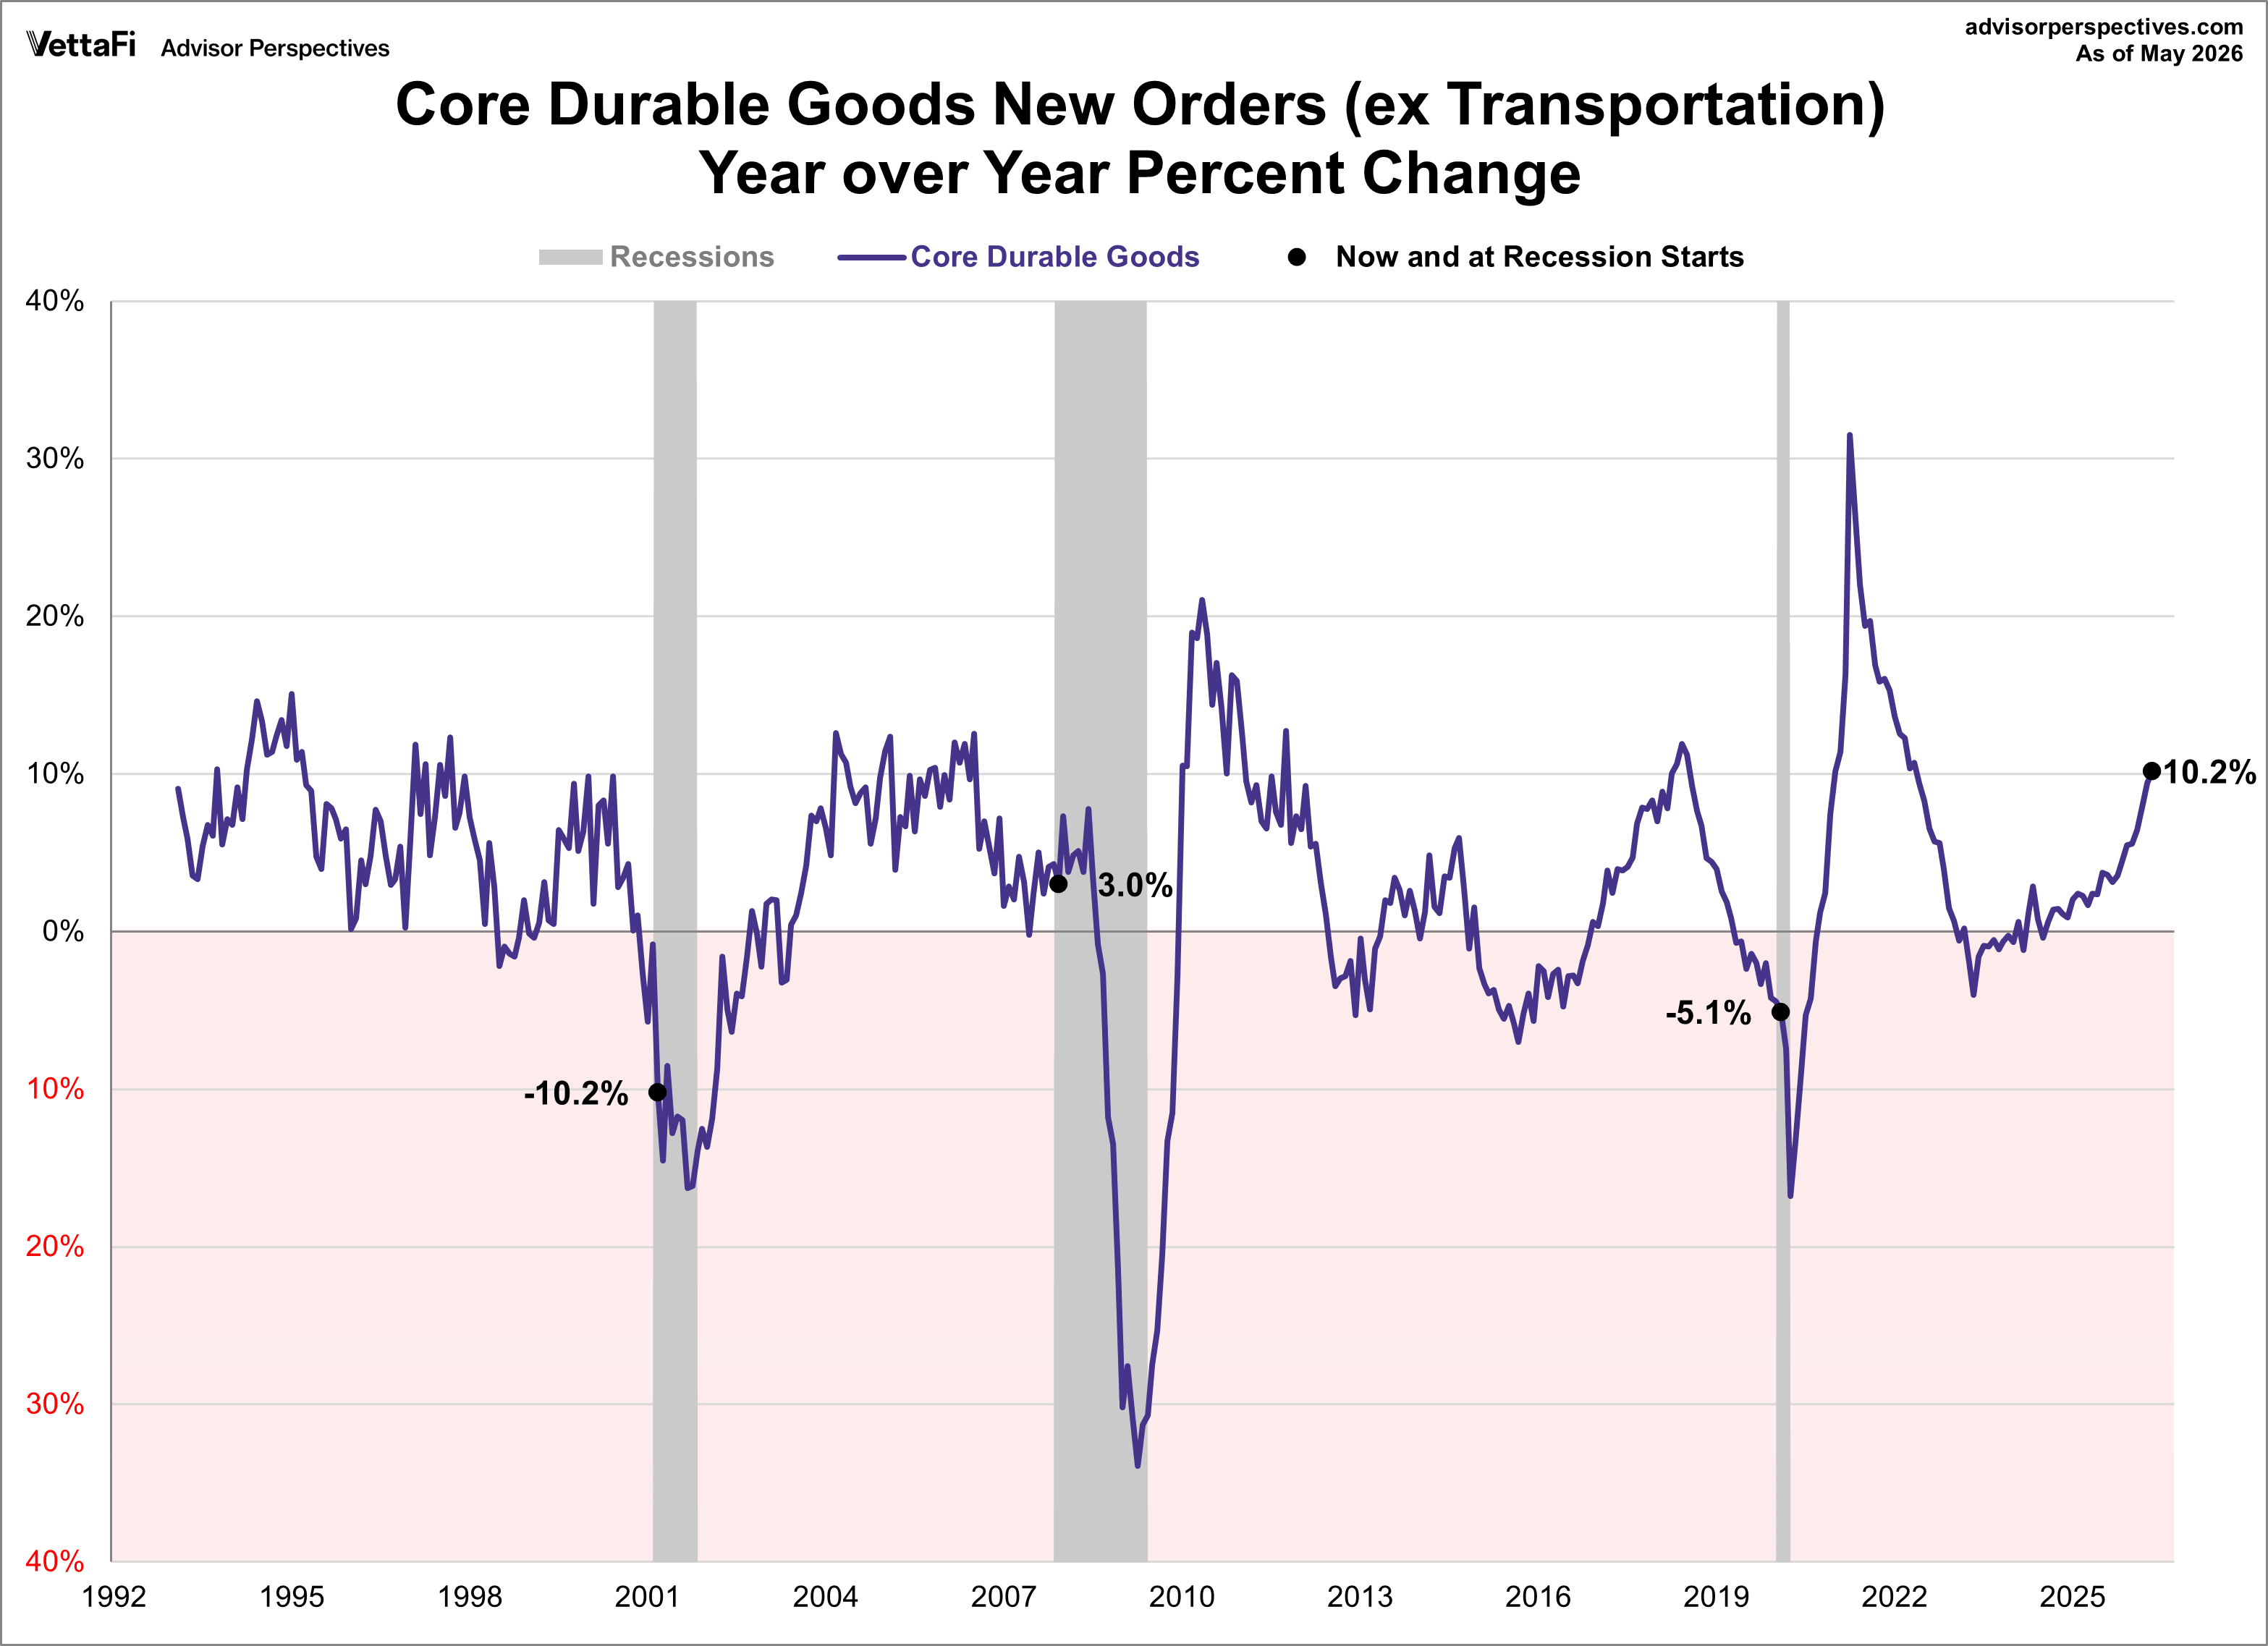
If we exclude transportation, "core" durable goods were up 1.3% from the previous month, exceeding the projected 0.5% monthly growth. Core durable goods are up 10.2% compared to one year ago, the highest level since May 2022. The next chart shows the year-over-year percent change in core durable goods.
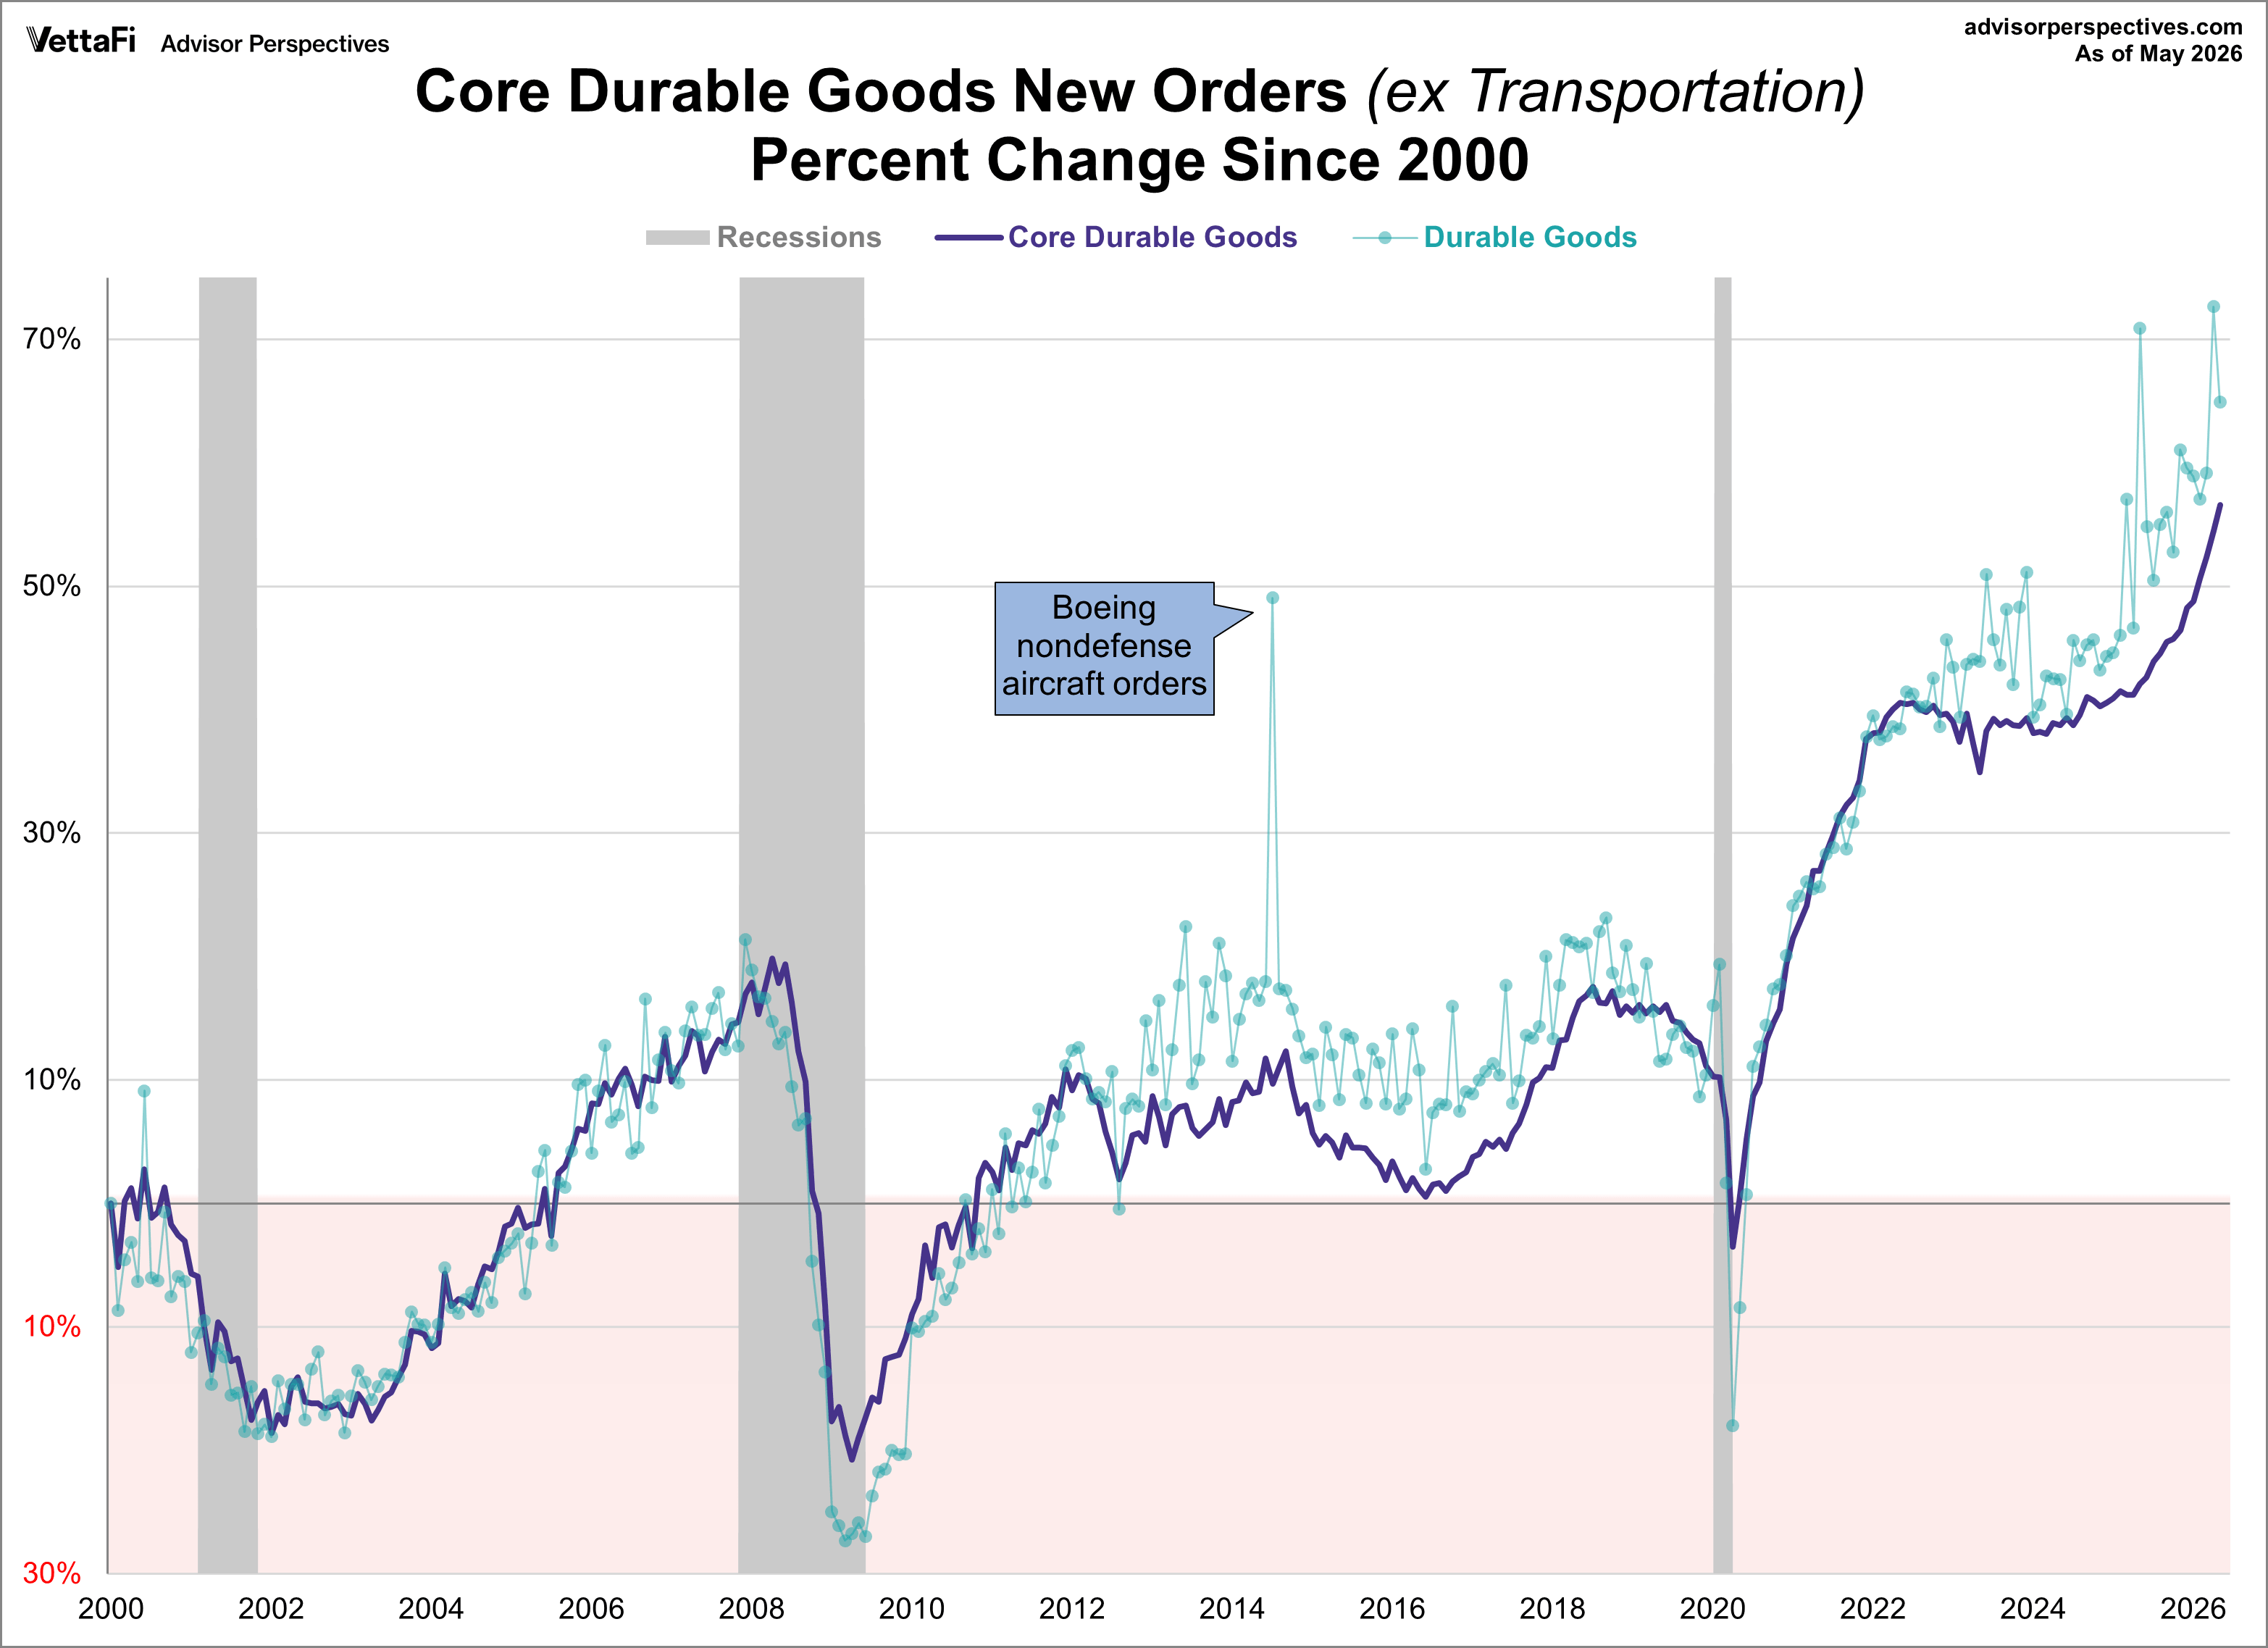
The next chart shows the growth in core durable goods (purple line) overlaid on the headline number (green dots) since the turn of the century. This overlay helps us see the substantial volatility of the transportation component. Since 2000, durable goods have grown 64.9% while core durable goods have grown 56.6%.
Durable Goods - Core Capex
Core capital goods new orders are manufacturers' new orders for non-defense capital goods excluding aircraft and is an important gauge of business spending, often referred to as "core capex." Core capex is company spending that is used to acquire, upgrade, and maintain physical assets such as property, plants, buildings, technology, and equipment. This month, core capex rose 1.6% month-over-month, surpassing the projected 0.6% monthly growth. Compared to the previous year, core capex are up 10.5% year-over-year.
The next two charts take a step back in the durable goods process to show illustrate core capex. Here is the year-over-year core capex.
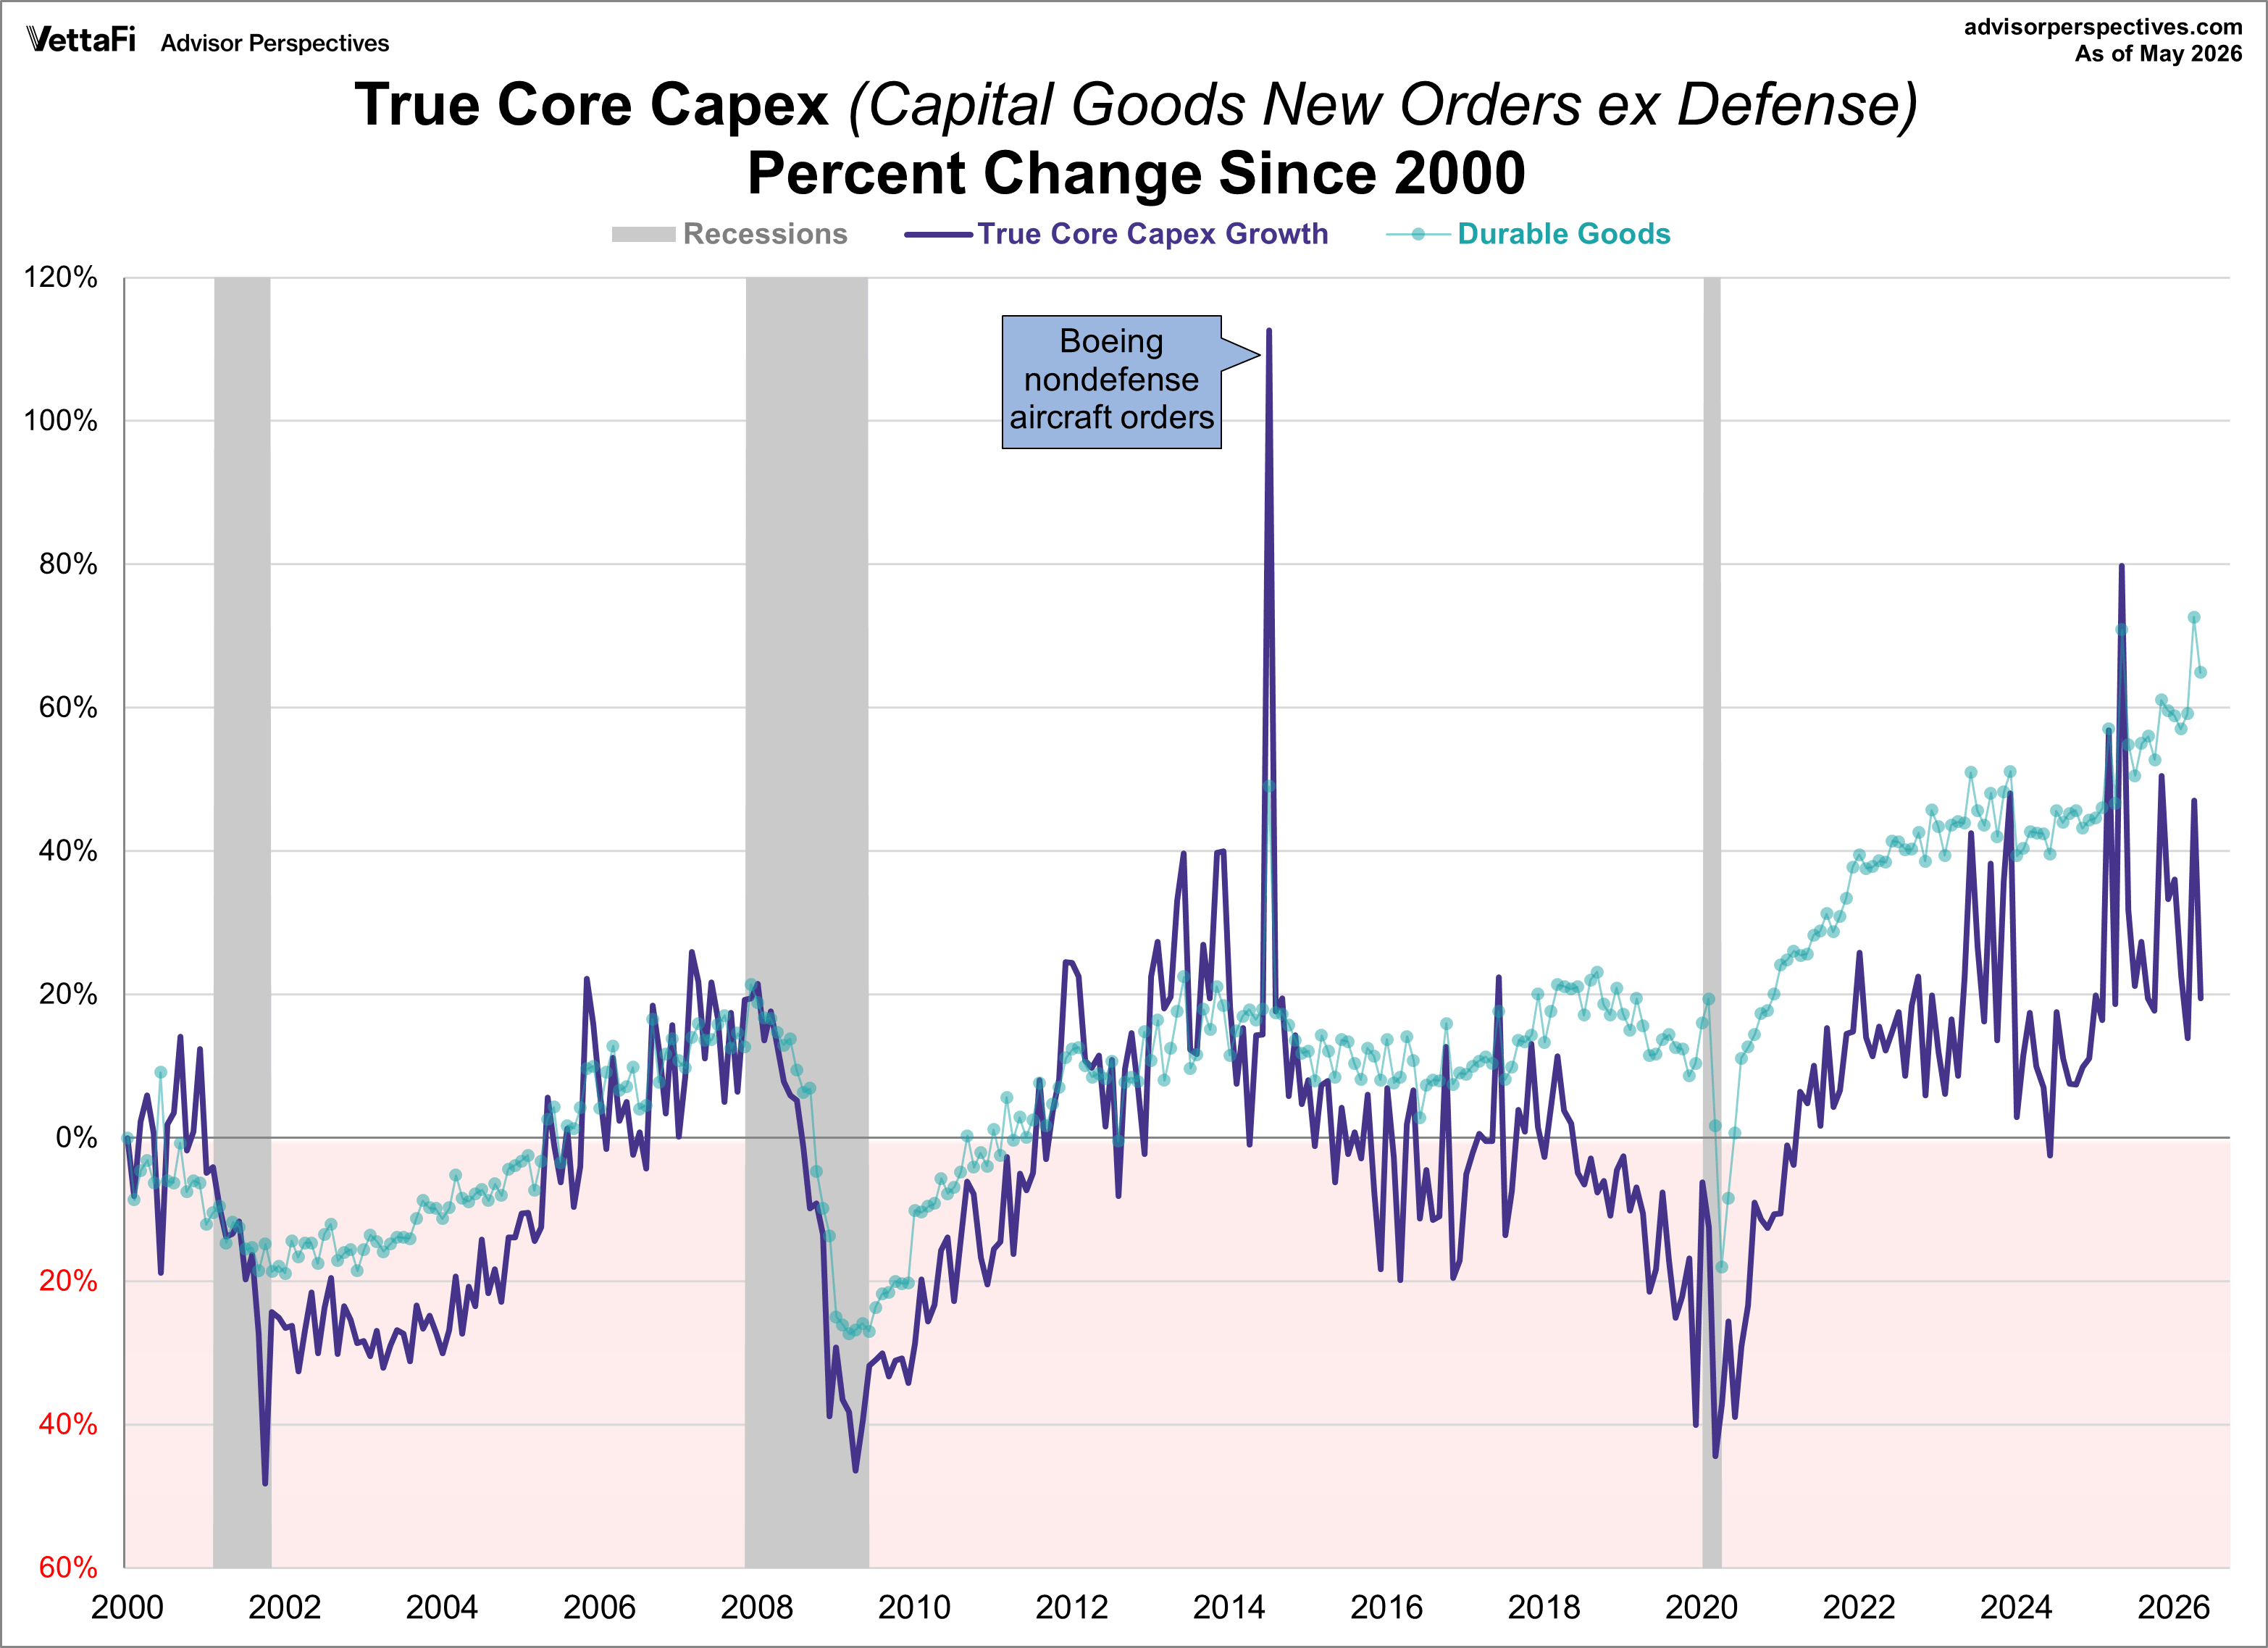
The next chart is an overlay of true core capital goods (excluding defense) on the larger series showing the percent change of the two since the turn of the century. Since 2000, durable goods have grown 64.9% while true core capex has grown 19.5%.
The "Real" Durable Goods Data
In theory, the durable goods orders series should be one of the more important indicators of the economy's health. However, its volatility and susceptibility to major revisions suggest caution in taking the data for any particular month too seriously. Additionally, this series is not adjusted for either population growth or inflation. Let's review the durable goods data with those two adjustments.
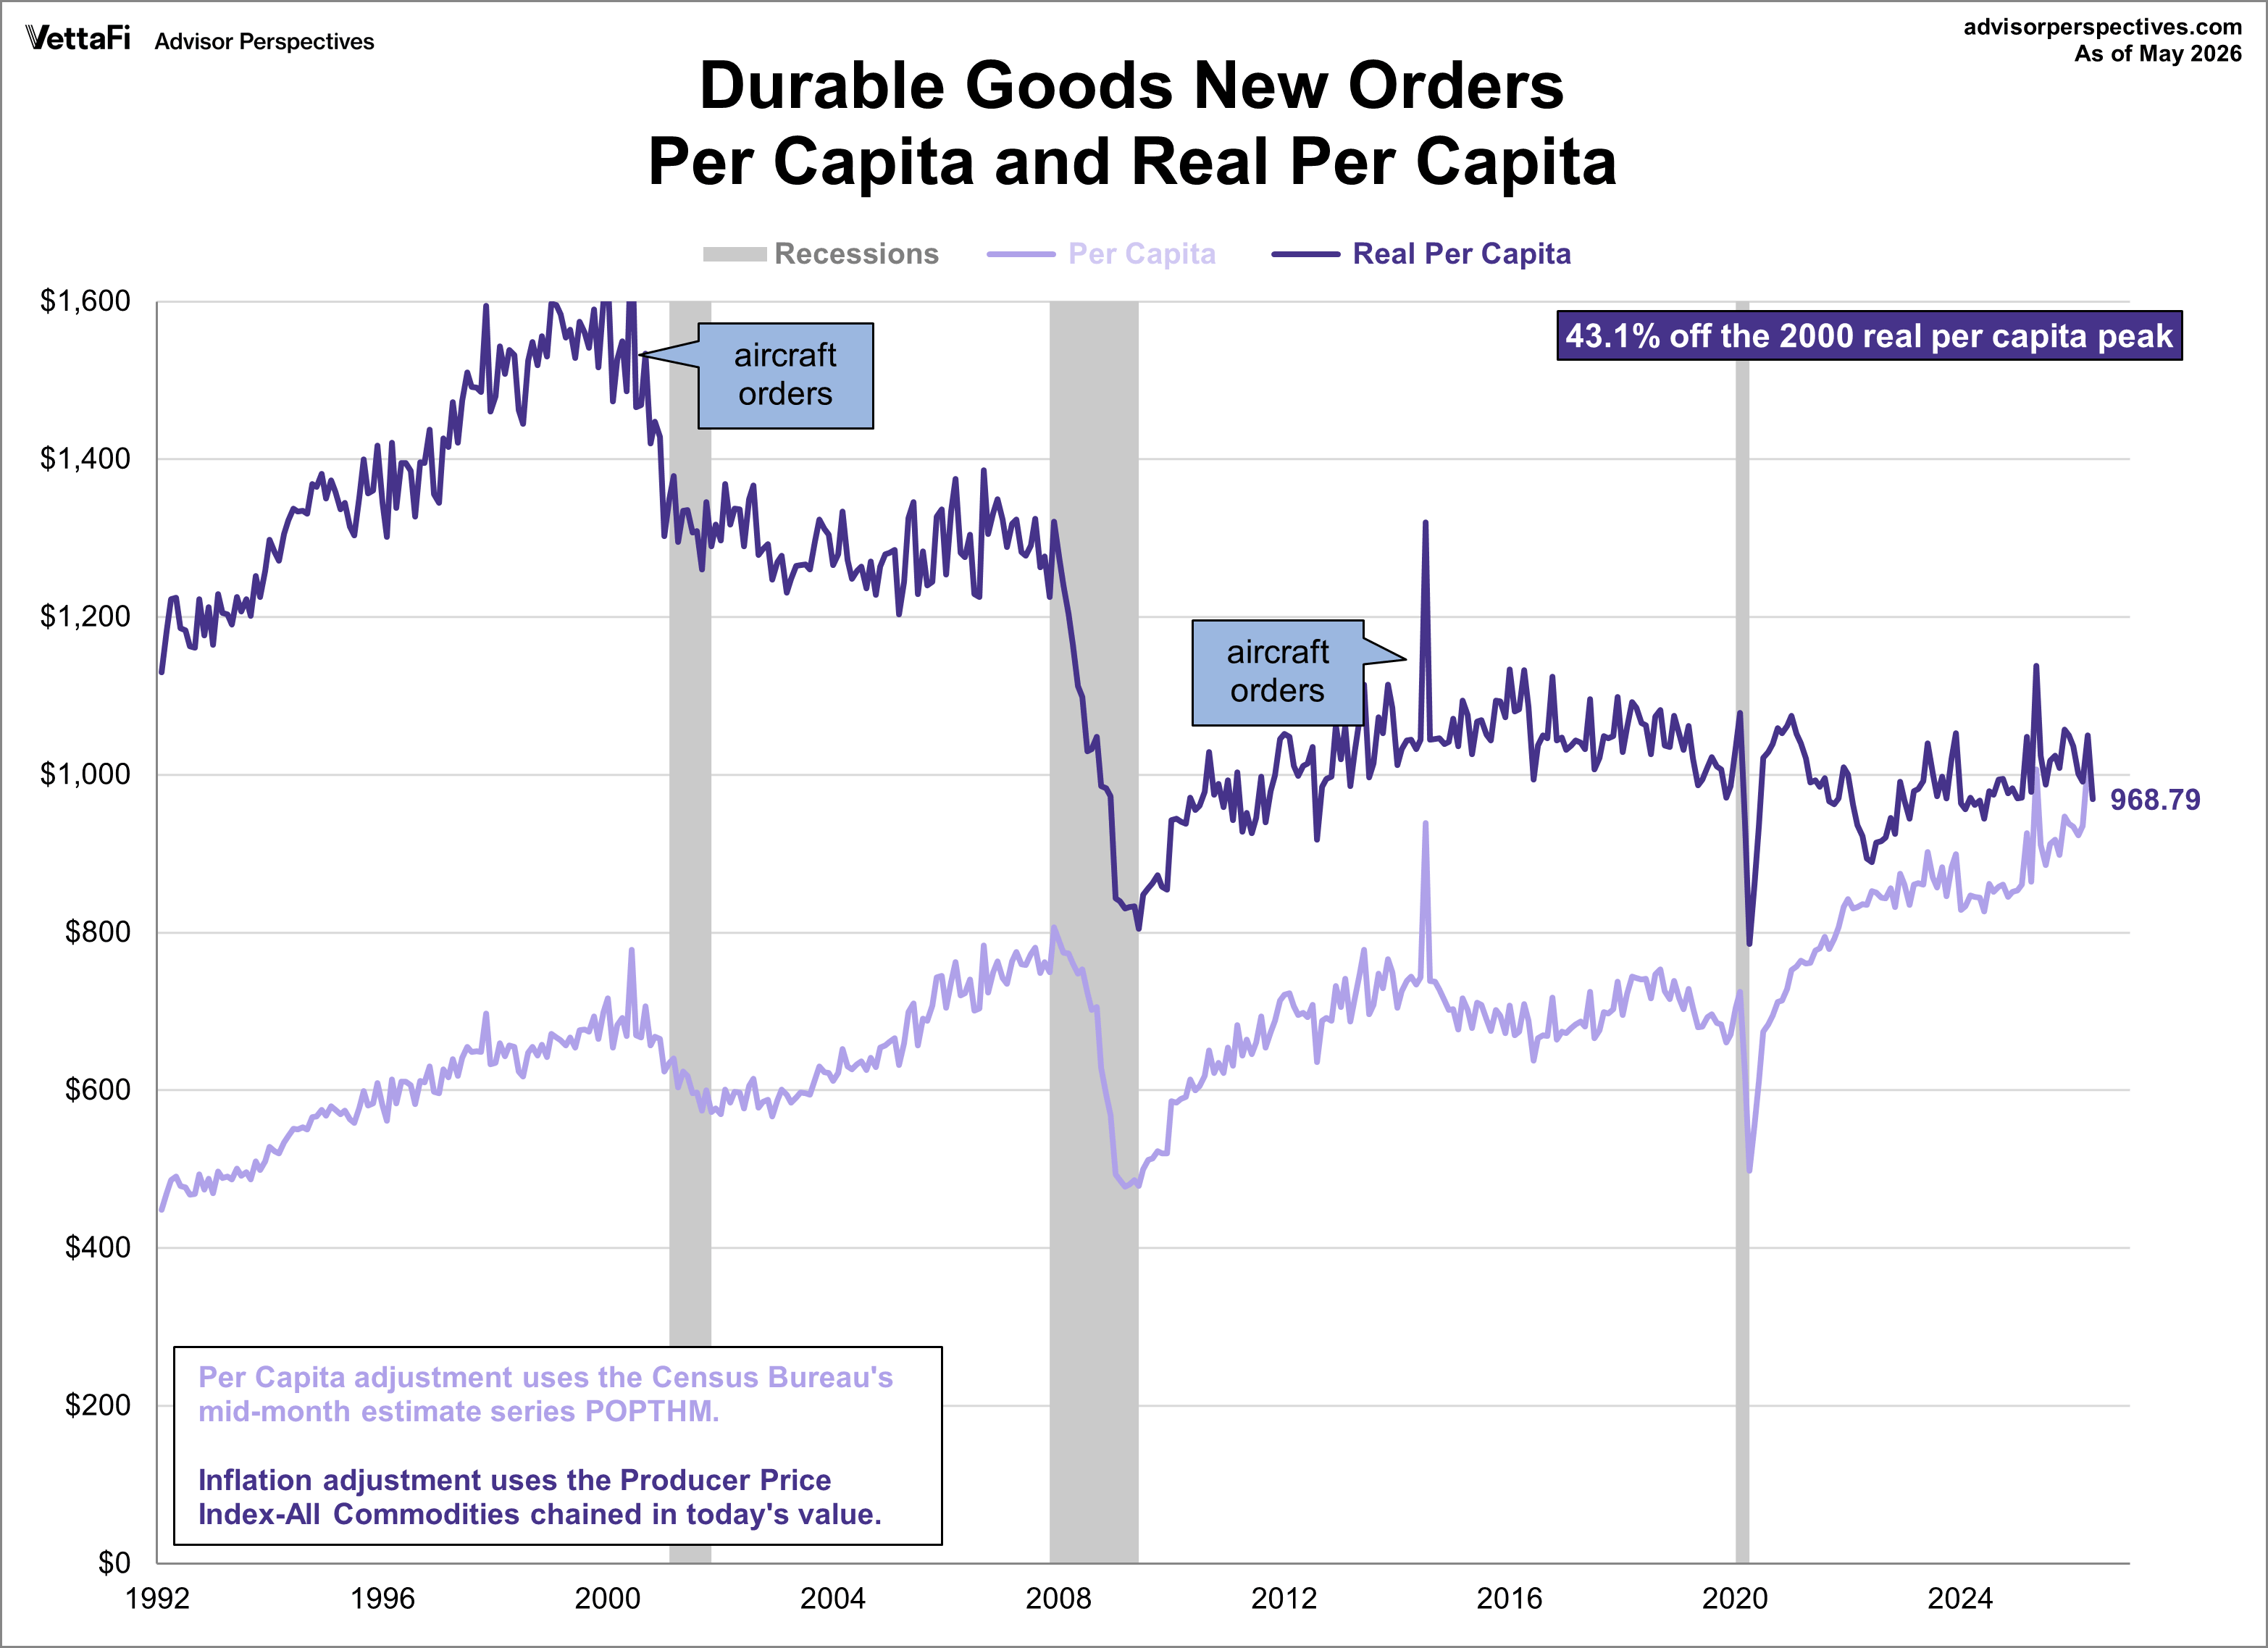
In the charts below the lighter line shows the goods orders divided by the Census Bureau's monthly population data, giving us durable goods orders per capita. The darker line goes a step further and adjusts for inflation based on the PPI for all commodities, chained in today's dollar value. This gives us the "real" durable goods orders per capita and thus a more accurate historical context in which to evaluate the conventional reports on the nominal monthly data.
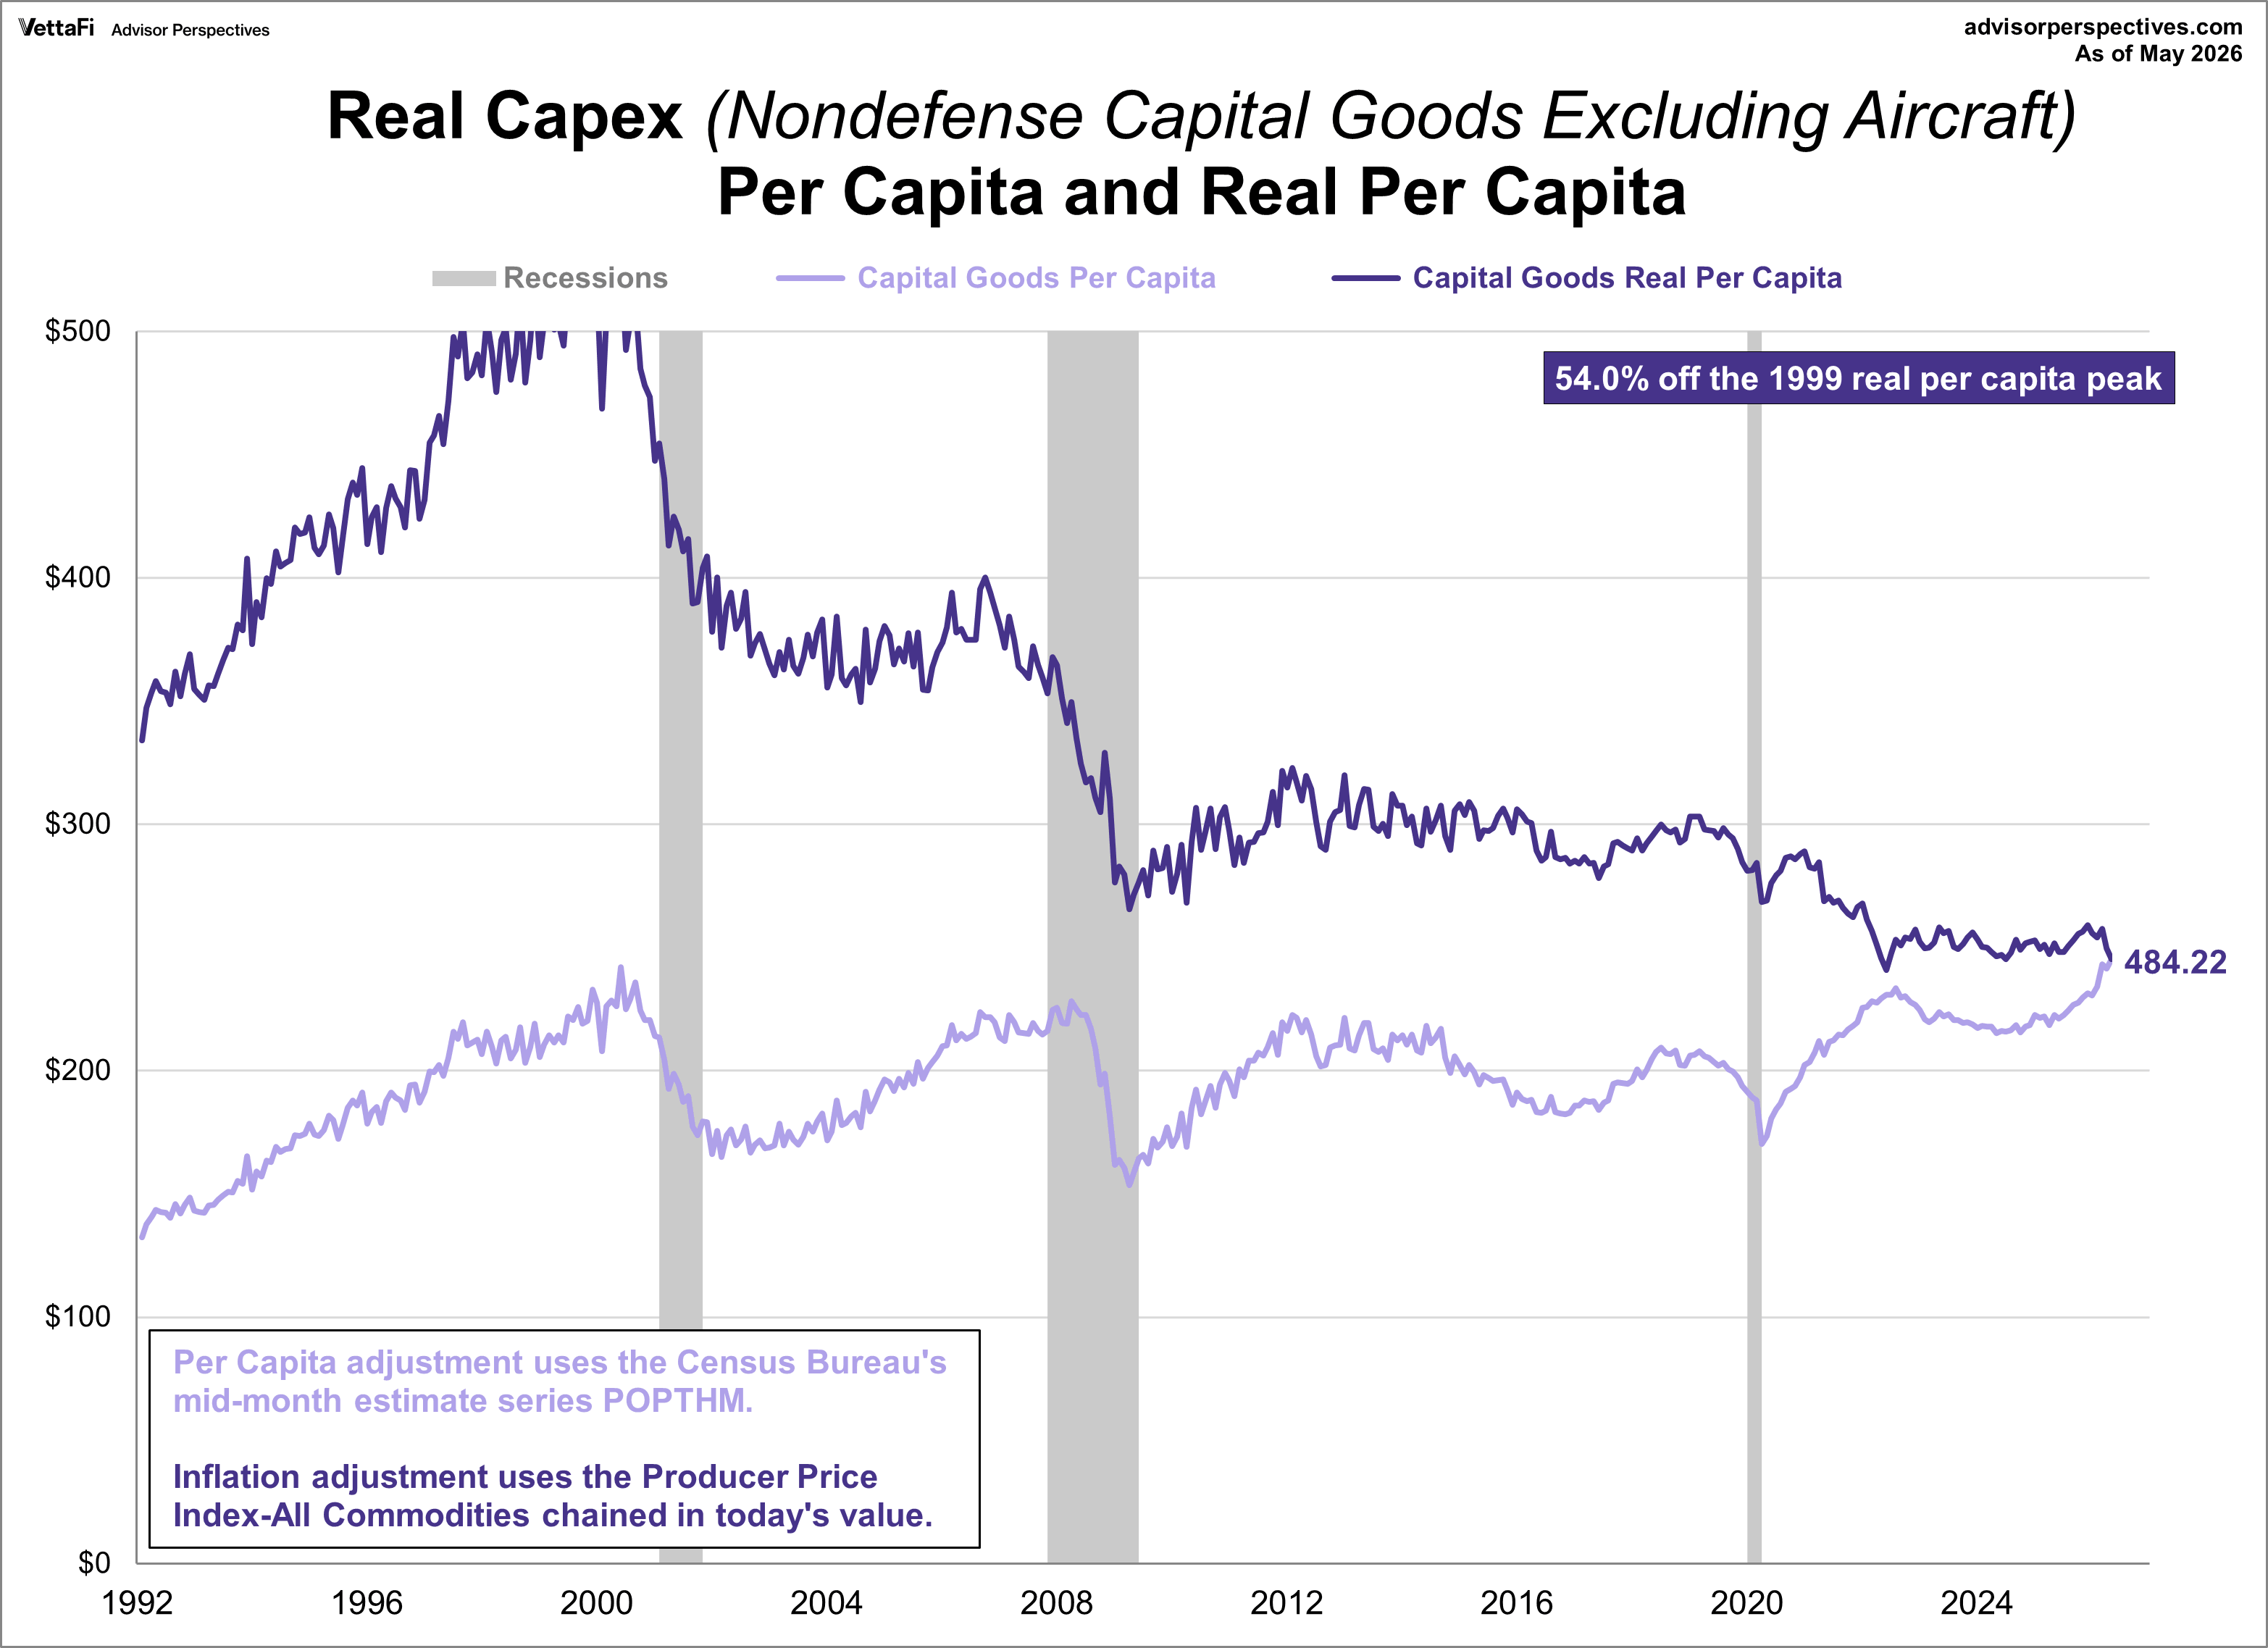
We've included a callout in the upper right corner to document the decline of the latest month from the all-time peak for the series.
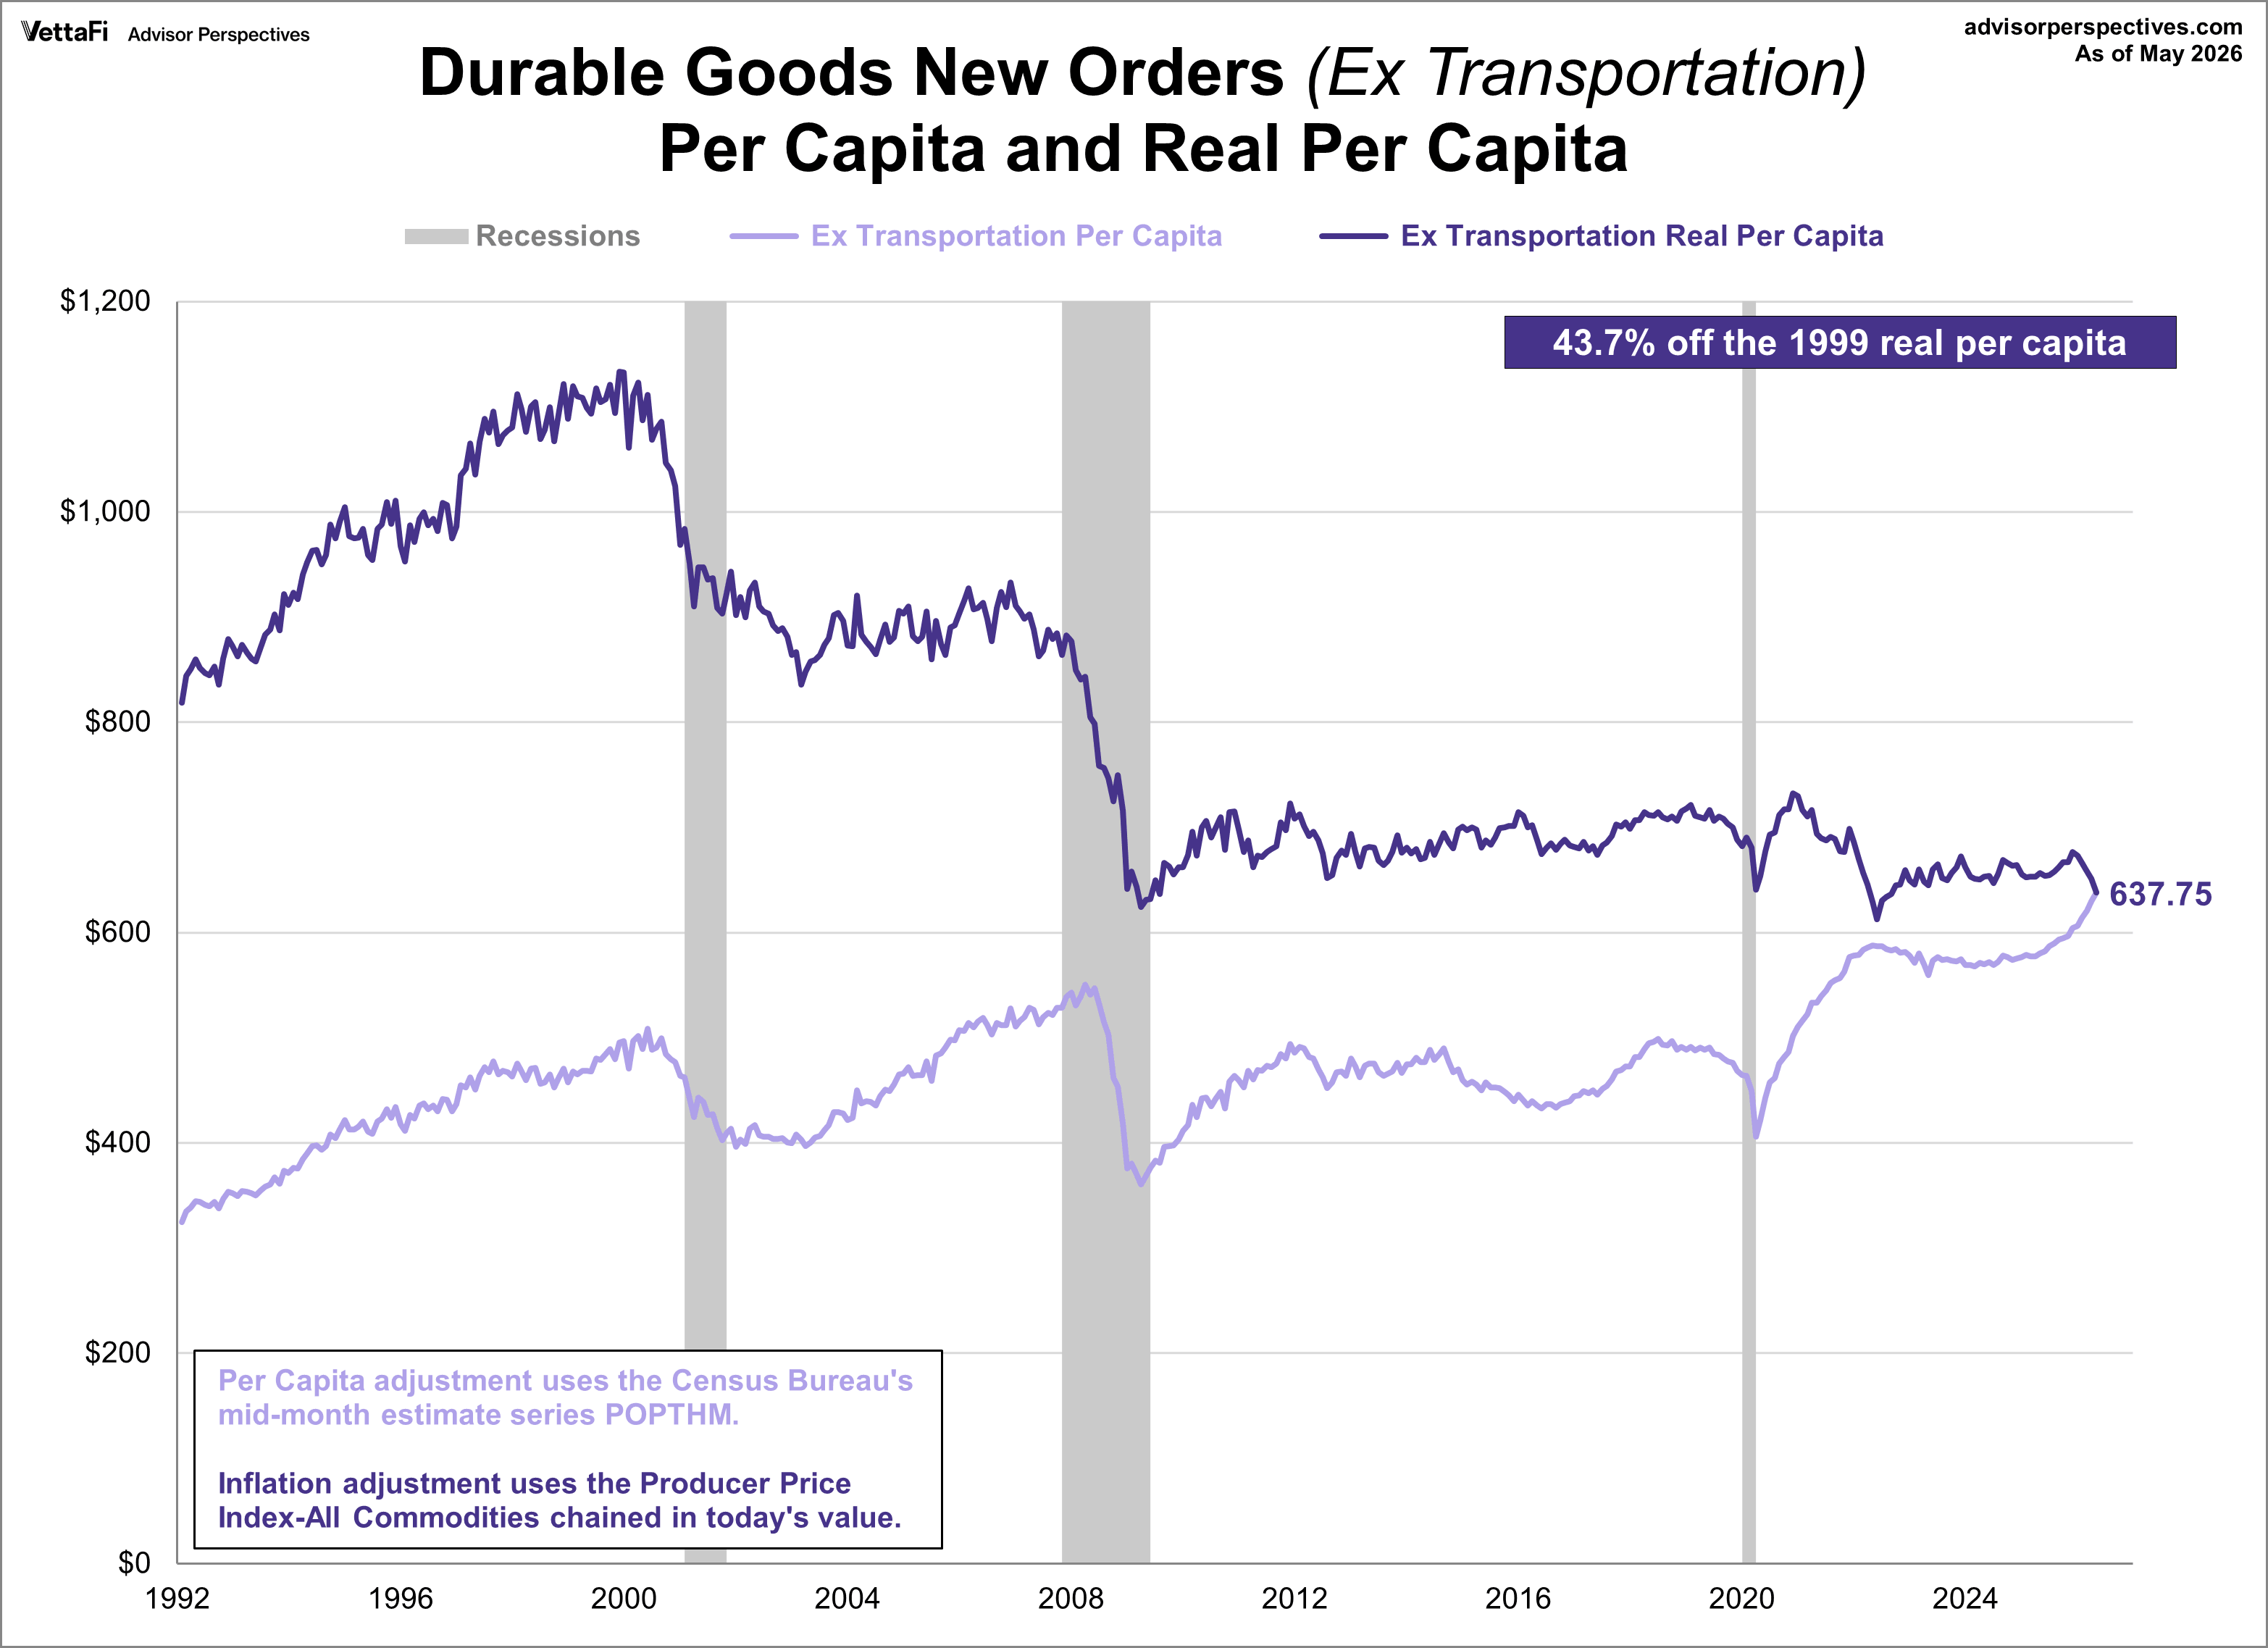
The next chart is similar to the first one except that it excludes the volatile transportation component, the series usually referred to as "core" durable goods.
Finally, let's take a big step back in the sales chain and look at the popular series often referred to as "core capex" — nondefense capital goods new orders excluding aircraft (capital goods are durable goods used in the production of goods or services), shown here on a per-capita basis, nominal and real.
The Long Term Trend in Durable Goods
As these charts illustrate, when we study durable goods orders in the larger context of population growth and also adjust for inflation, the data becomes a coincident macro-indicator of a major shift in demand within the U.S. economy. It correlates with a decline in real household incomes, as illustrated in our analysis of the most recent Census Bureau household income data:
- Household Incomes: Quintiles and Top 5%
- Household Incomes: Age
- Household Incomes: Educational Attainment
- Household Incomes: Purchasing Power by State
- Household Incomes: State
- Household Incomes: Middle Class
The secular trend in durable goods orders also helps us understand the long-term trend in GDP illustrated elsewhere. See especially the most recent update on GDP.
Membership required
Membership is now required to use this feature. To learn more:
View Membership BenefitsSponsored Content
Editorial Calendar
View Full Calendar Eastern Time Zone
+ Add the editorial calendar to your Google Calendar.
Upcoming Virtual Events View All


