Light Vehicle Sales
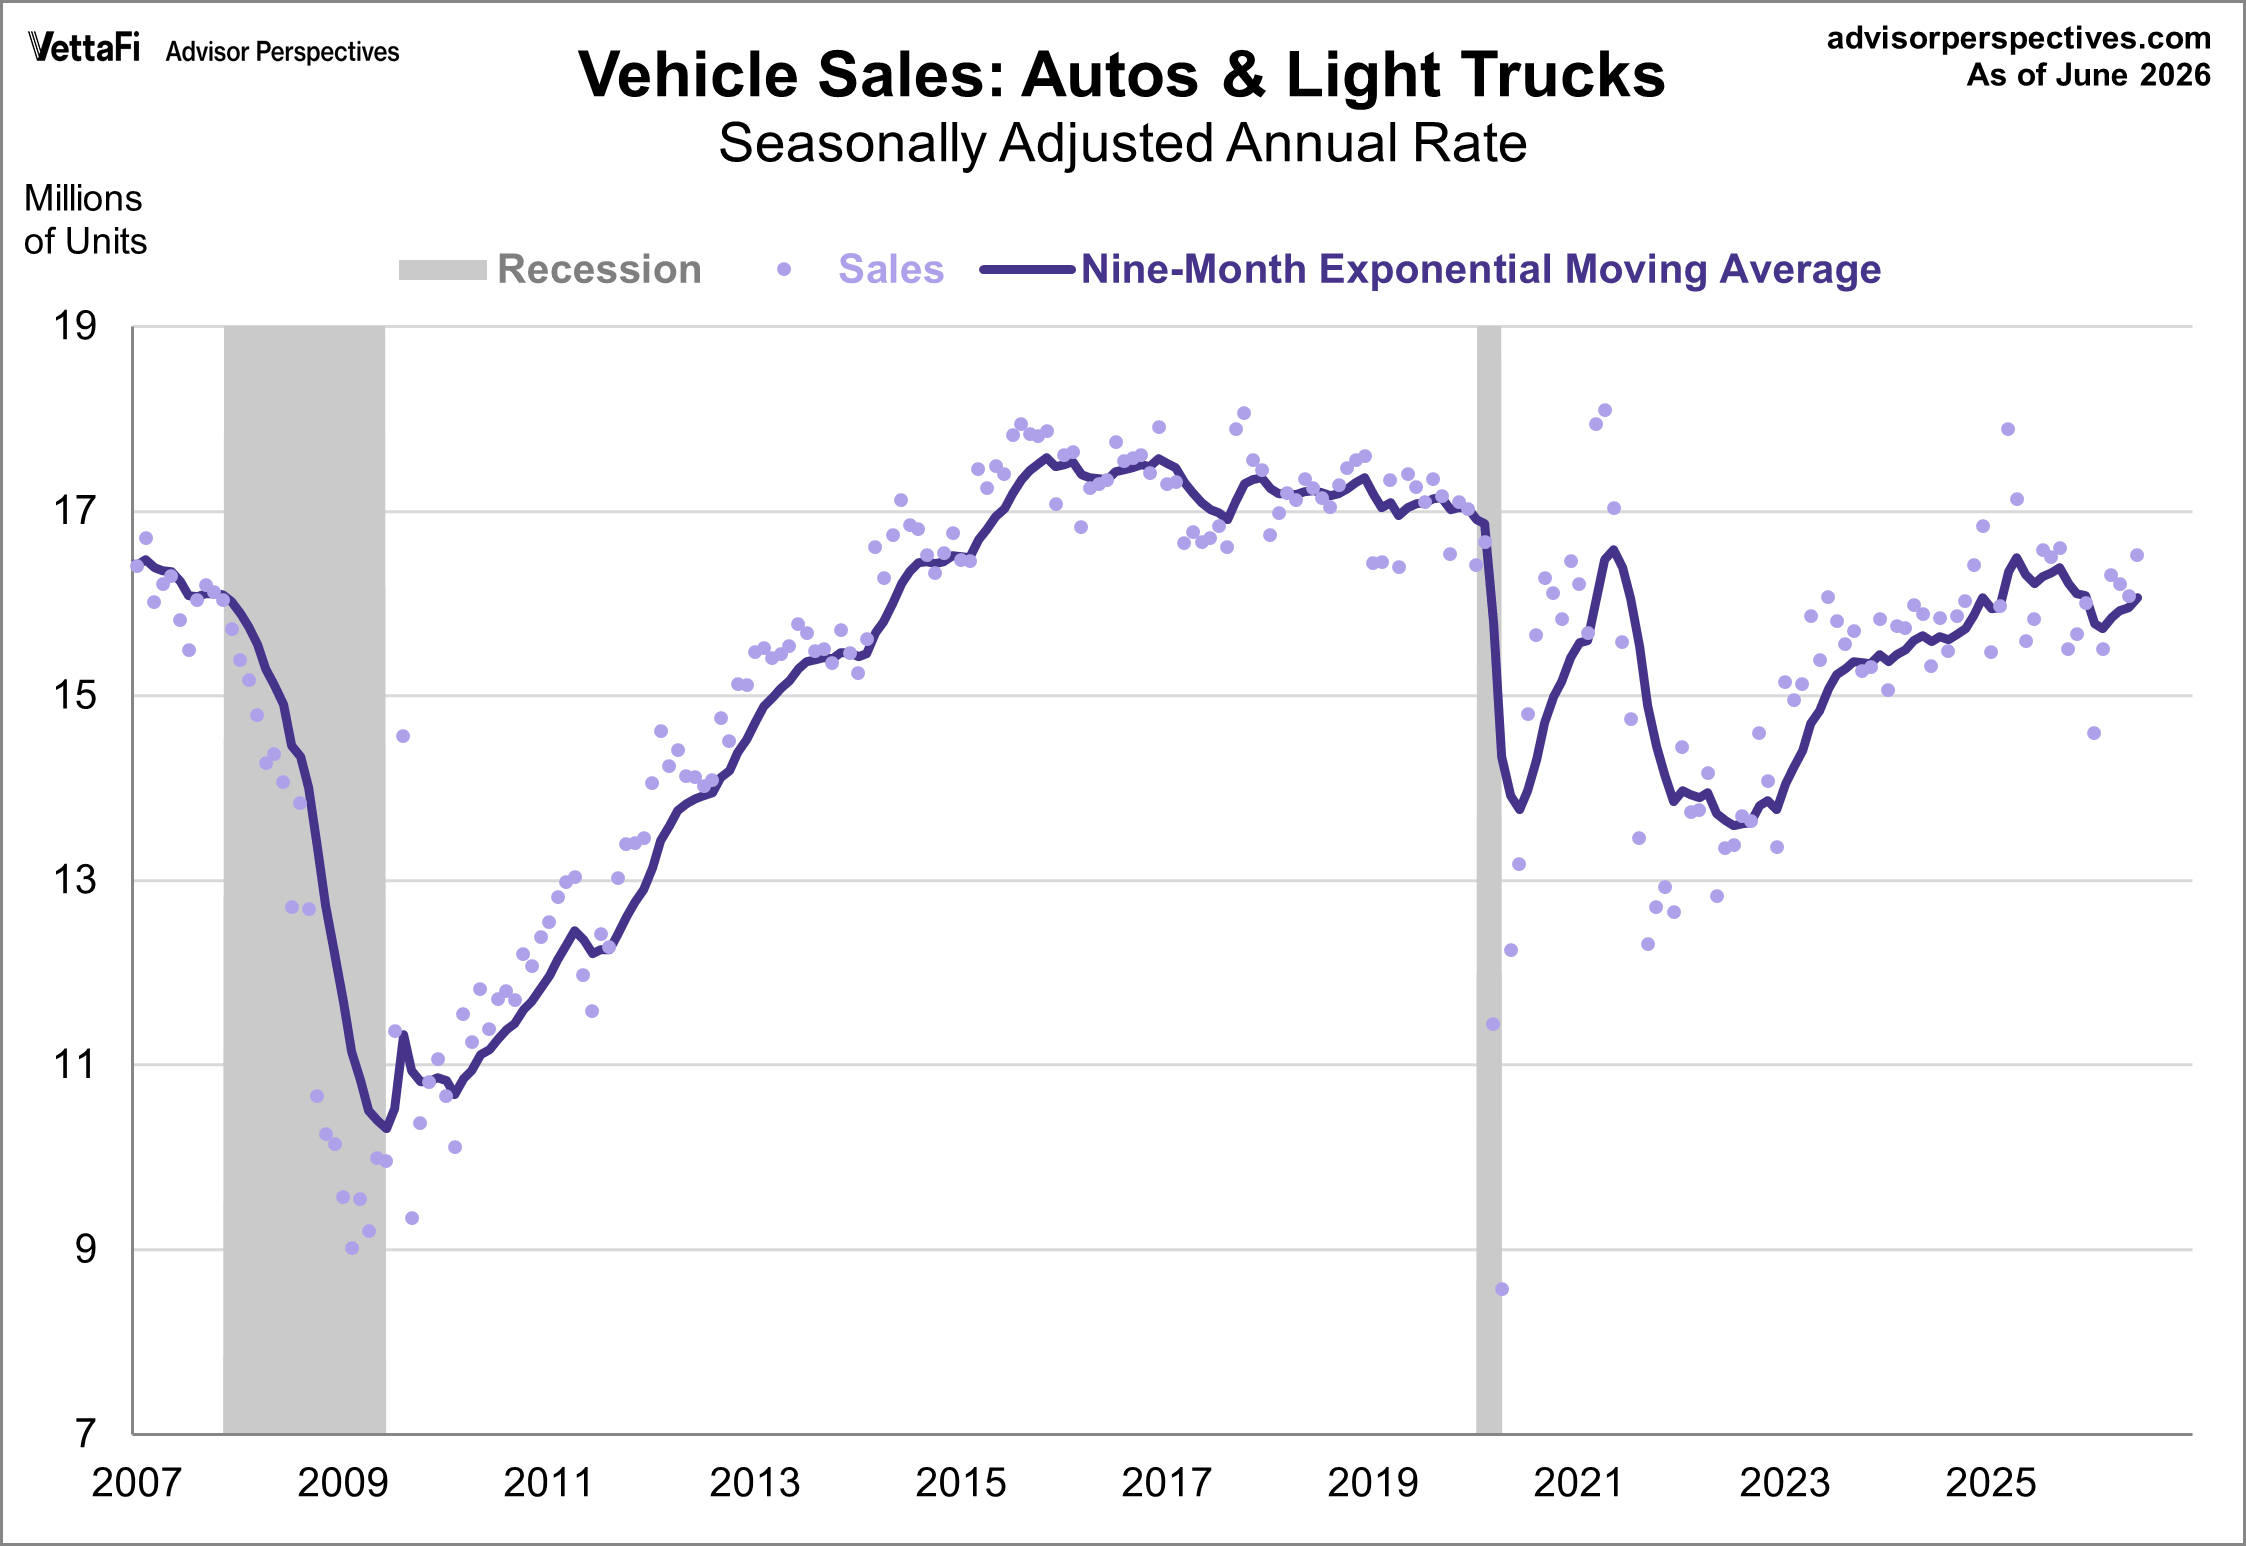
Vehicle sales rose to their highest level in nine months in June, coming in at a seasonally adjusted annual rate of 16.523 million units. This represents a 2.8% increase from the previous month and a 4.4% rise from one year ago.
The first chart shows the series since 2007, which illustrates the dramatic impact of the Great Recession. This is quite a noisy series - the absolute average month-over-month change is 4.3% therefore we've added a nine-month exponential moving average (at the suggestion of Bob Bronson of Bronson Capital Markets Research). The moving average reduces the distortion of seasonal sales events (e.g., Memorial Day and Labor Day weekend) and thus helps us visualize the trend. The latest moving average is at an annual rate of 16.065 million units.

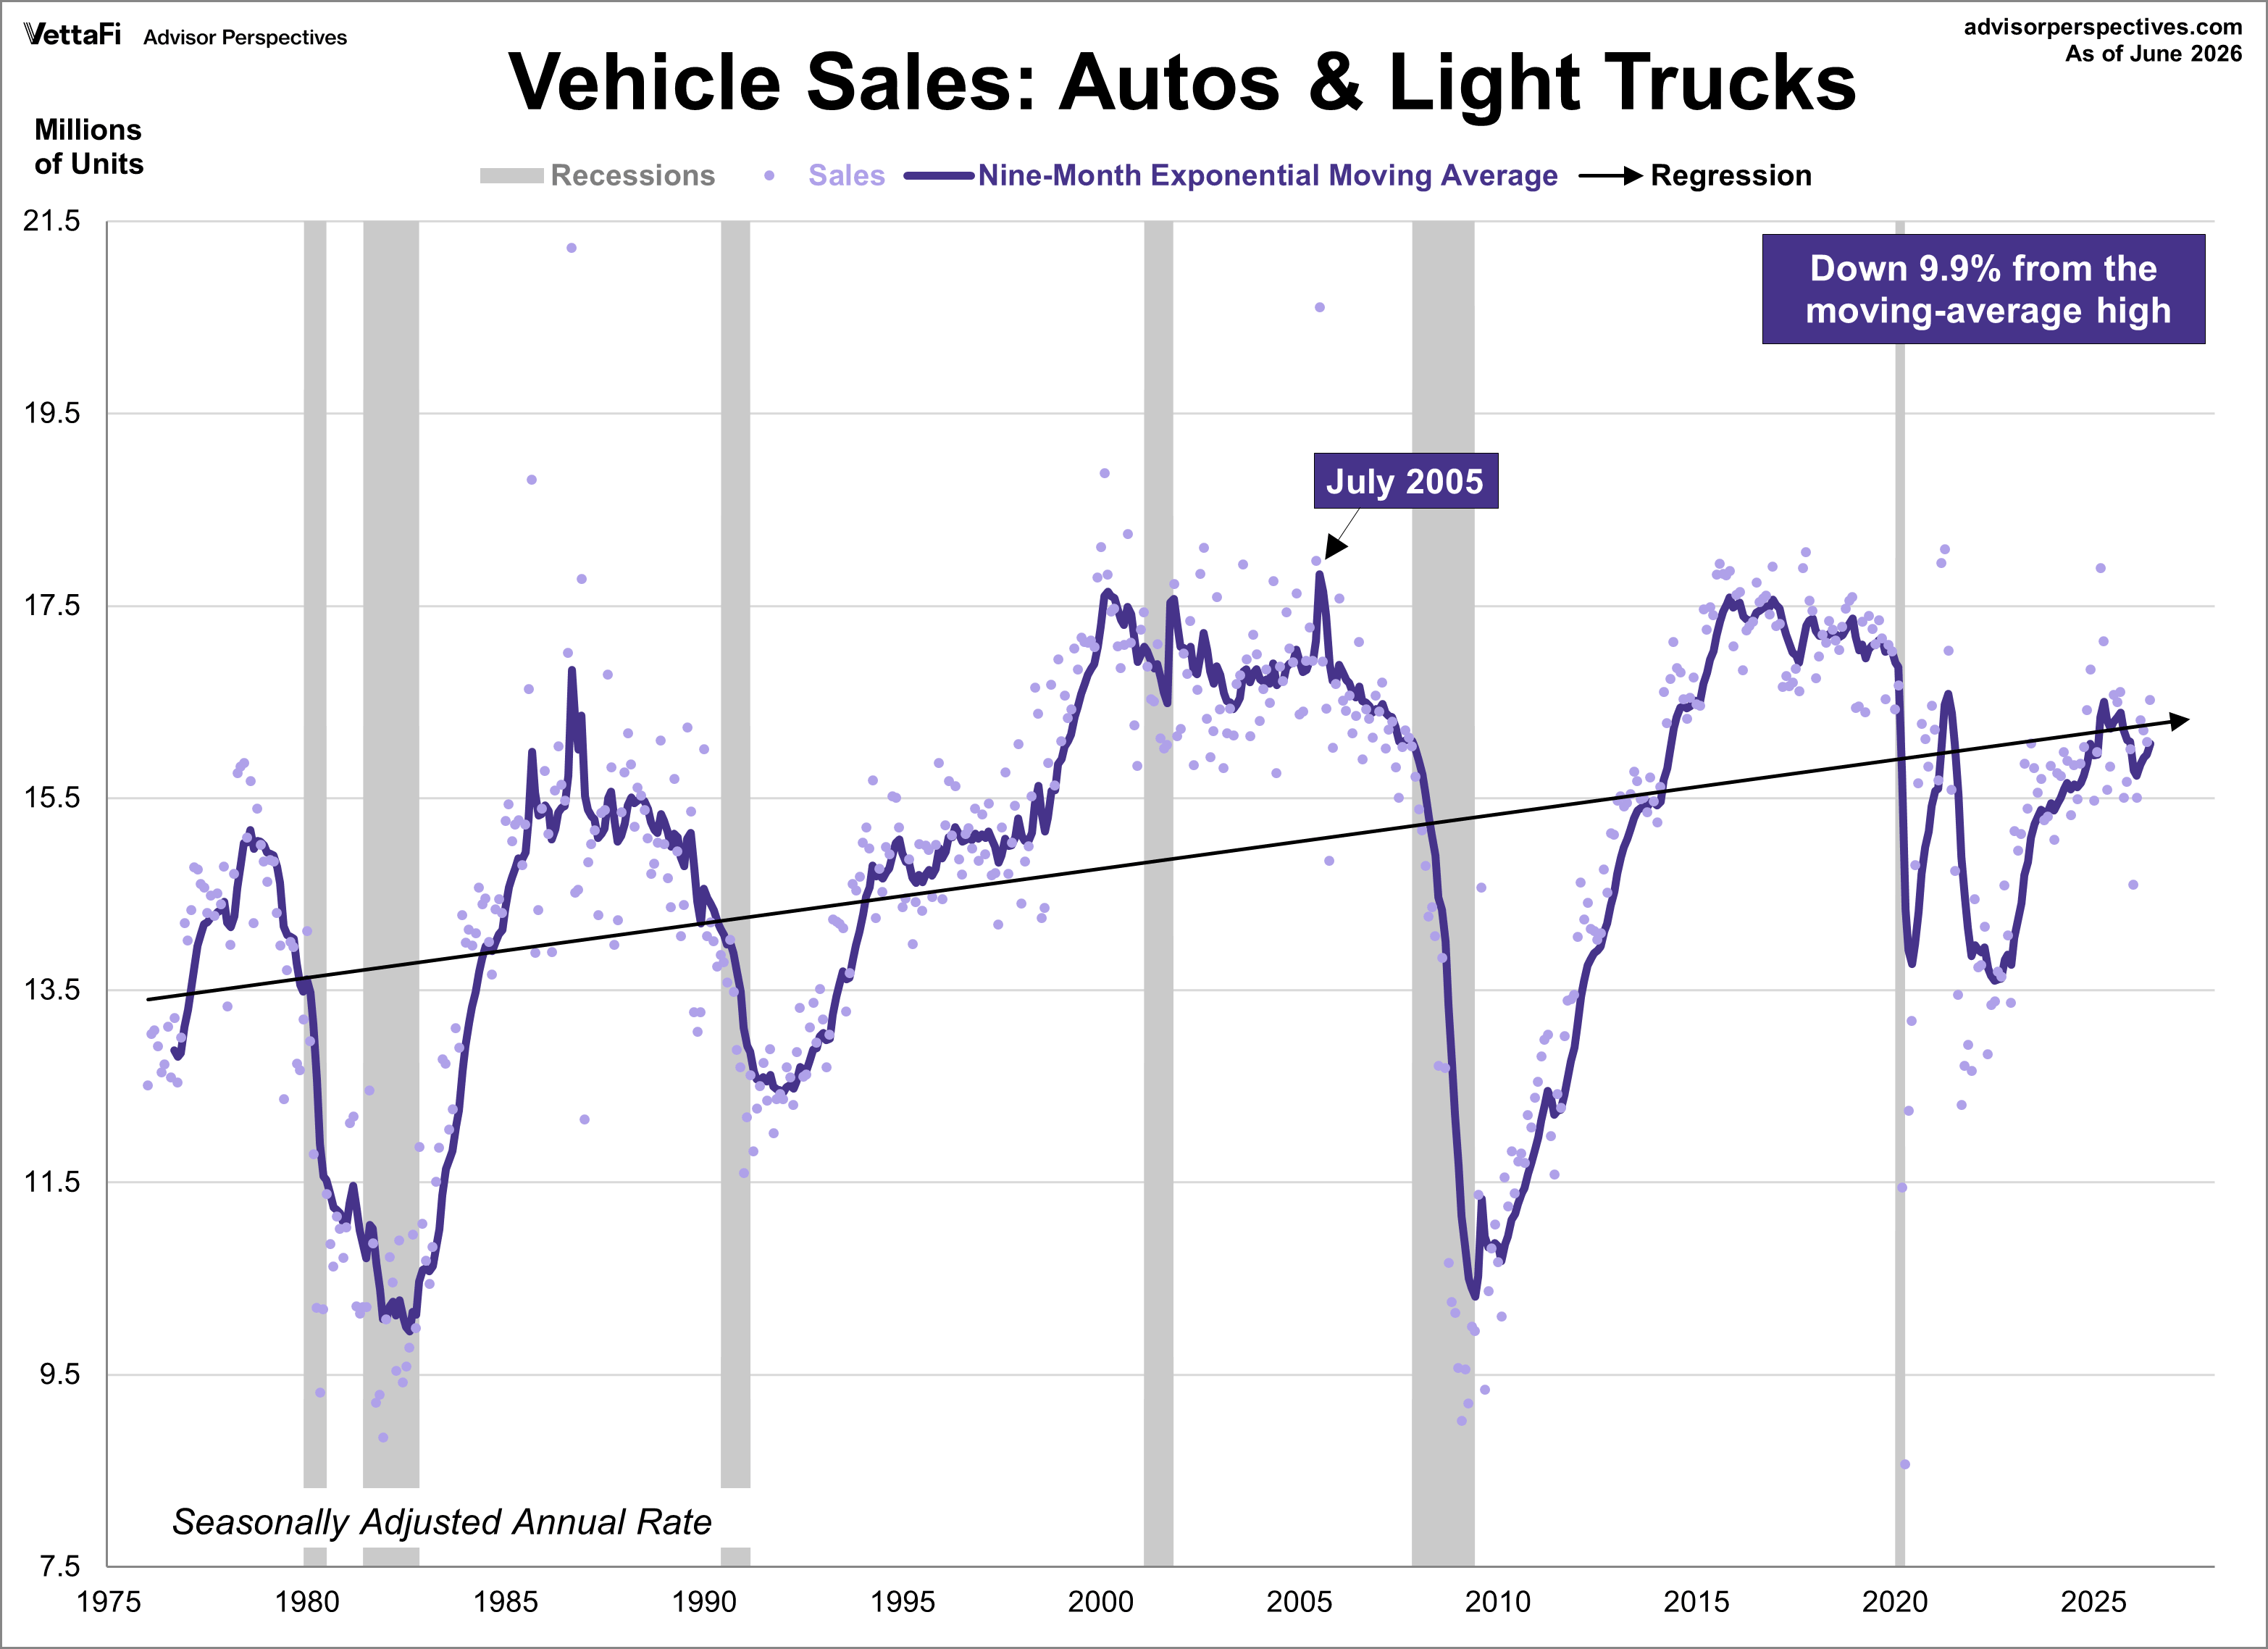
Here is the complete series data from 1976. We've added a linear regression to further illustrate the direction of the long-term trend. The latest moving average value is 9.9% below its record high in July 2005.
Vehicle Sales: Heavy Trucks
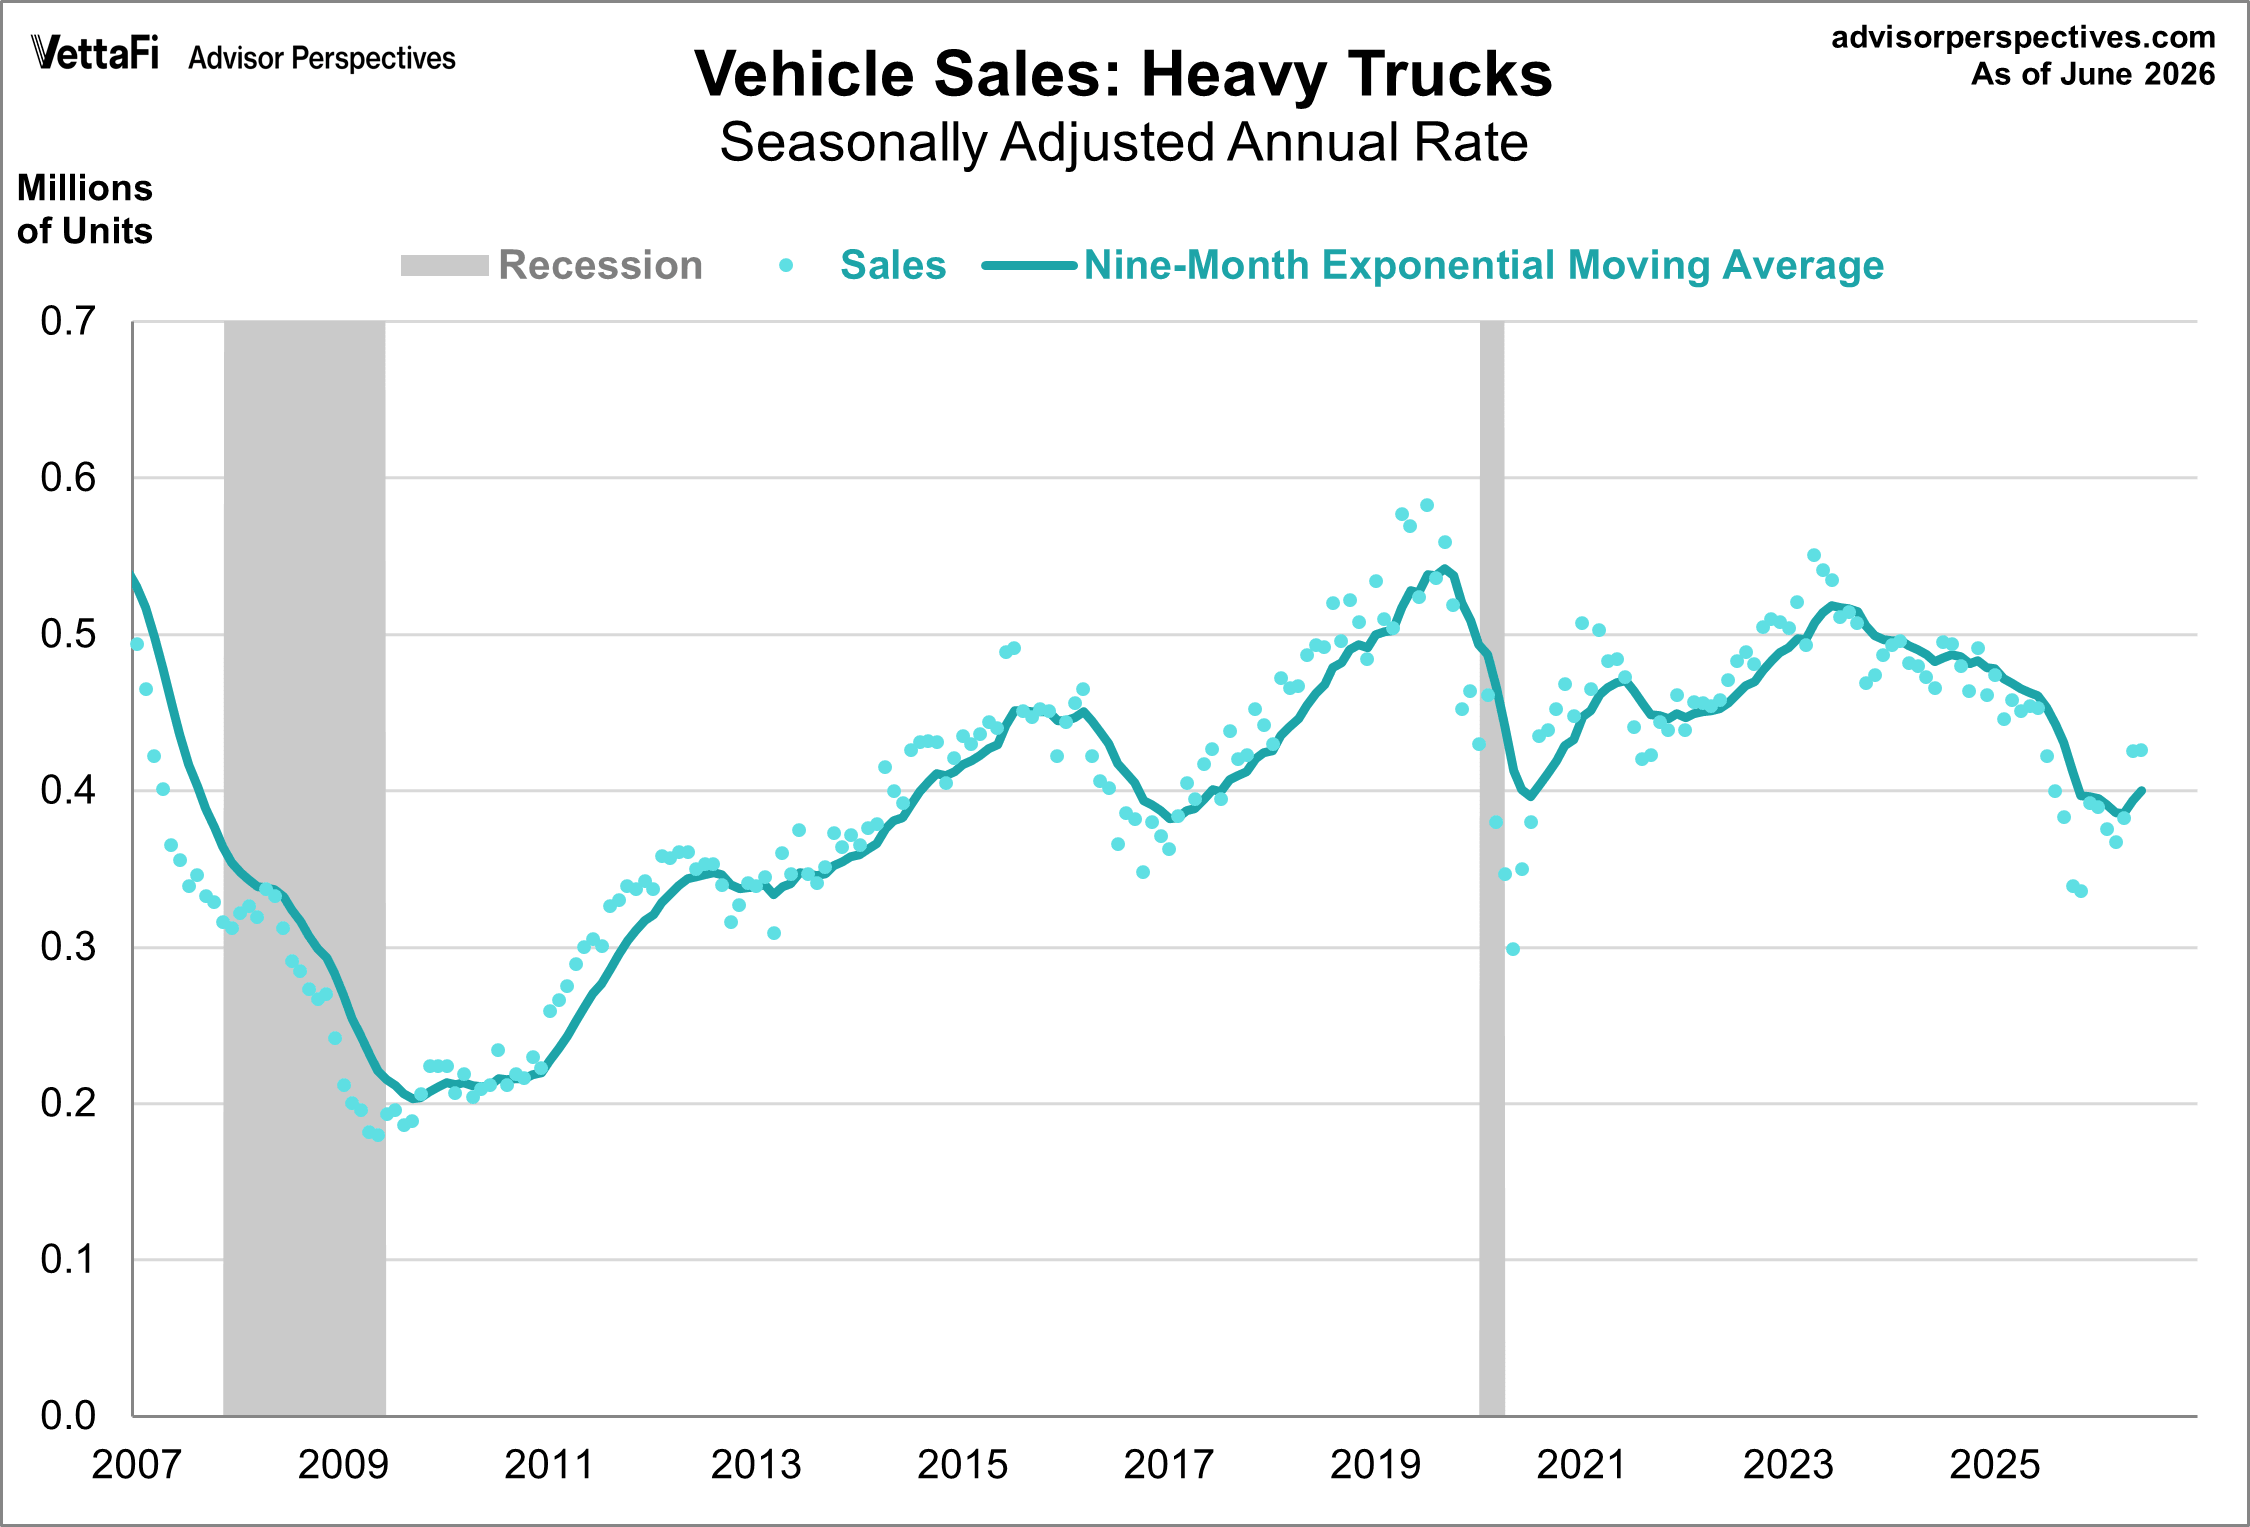
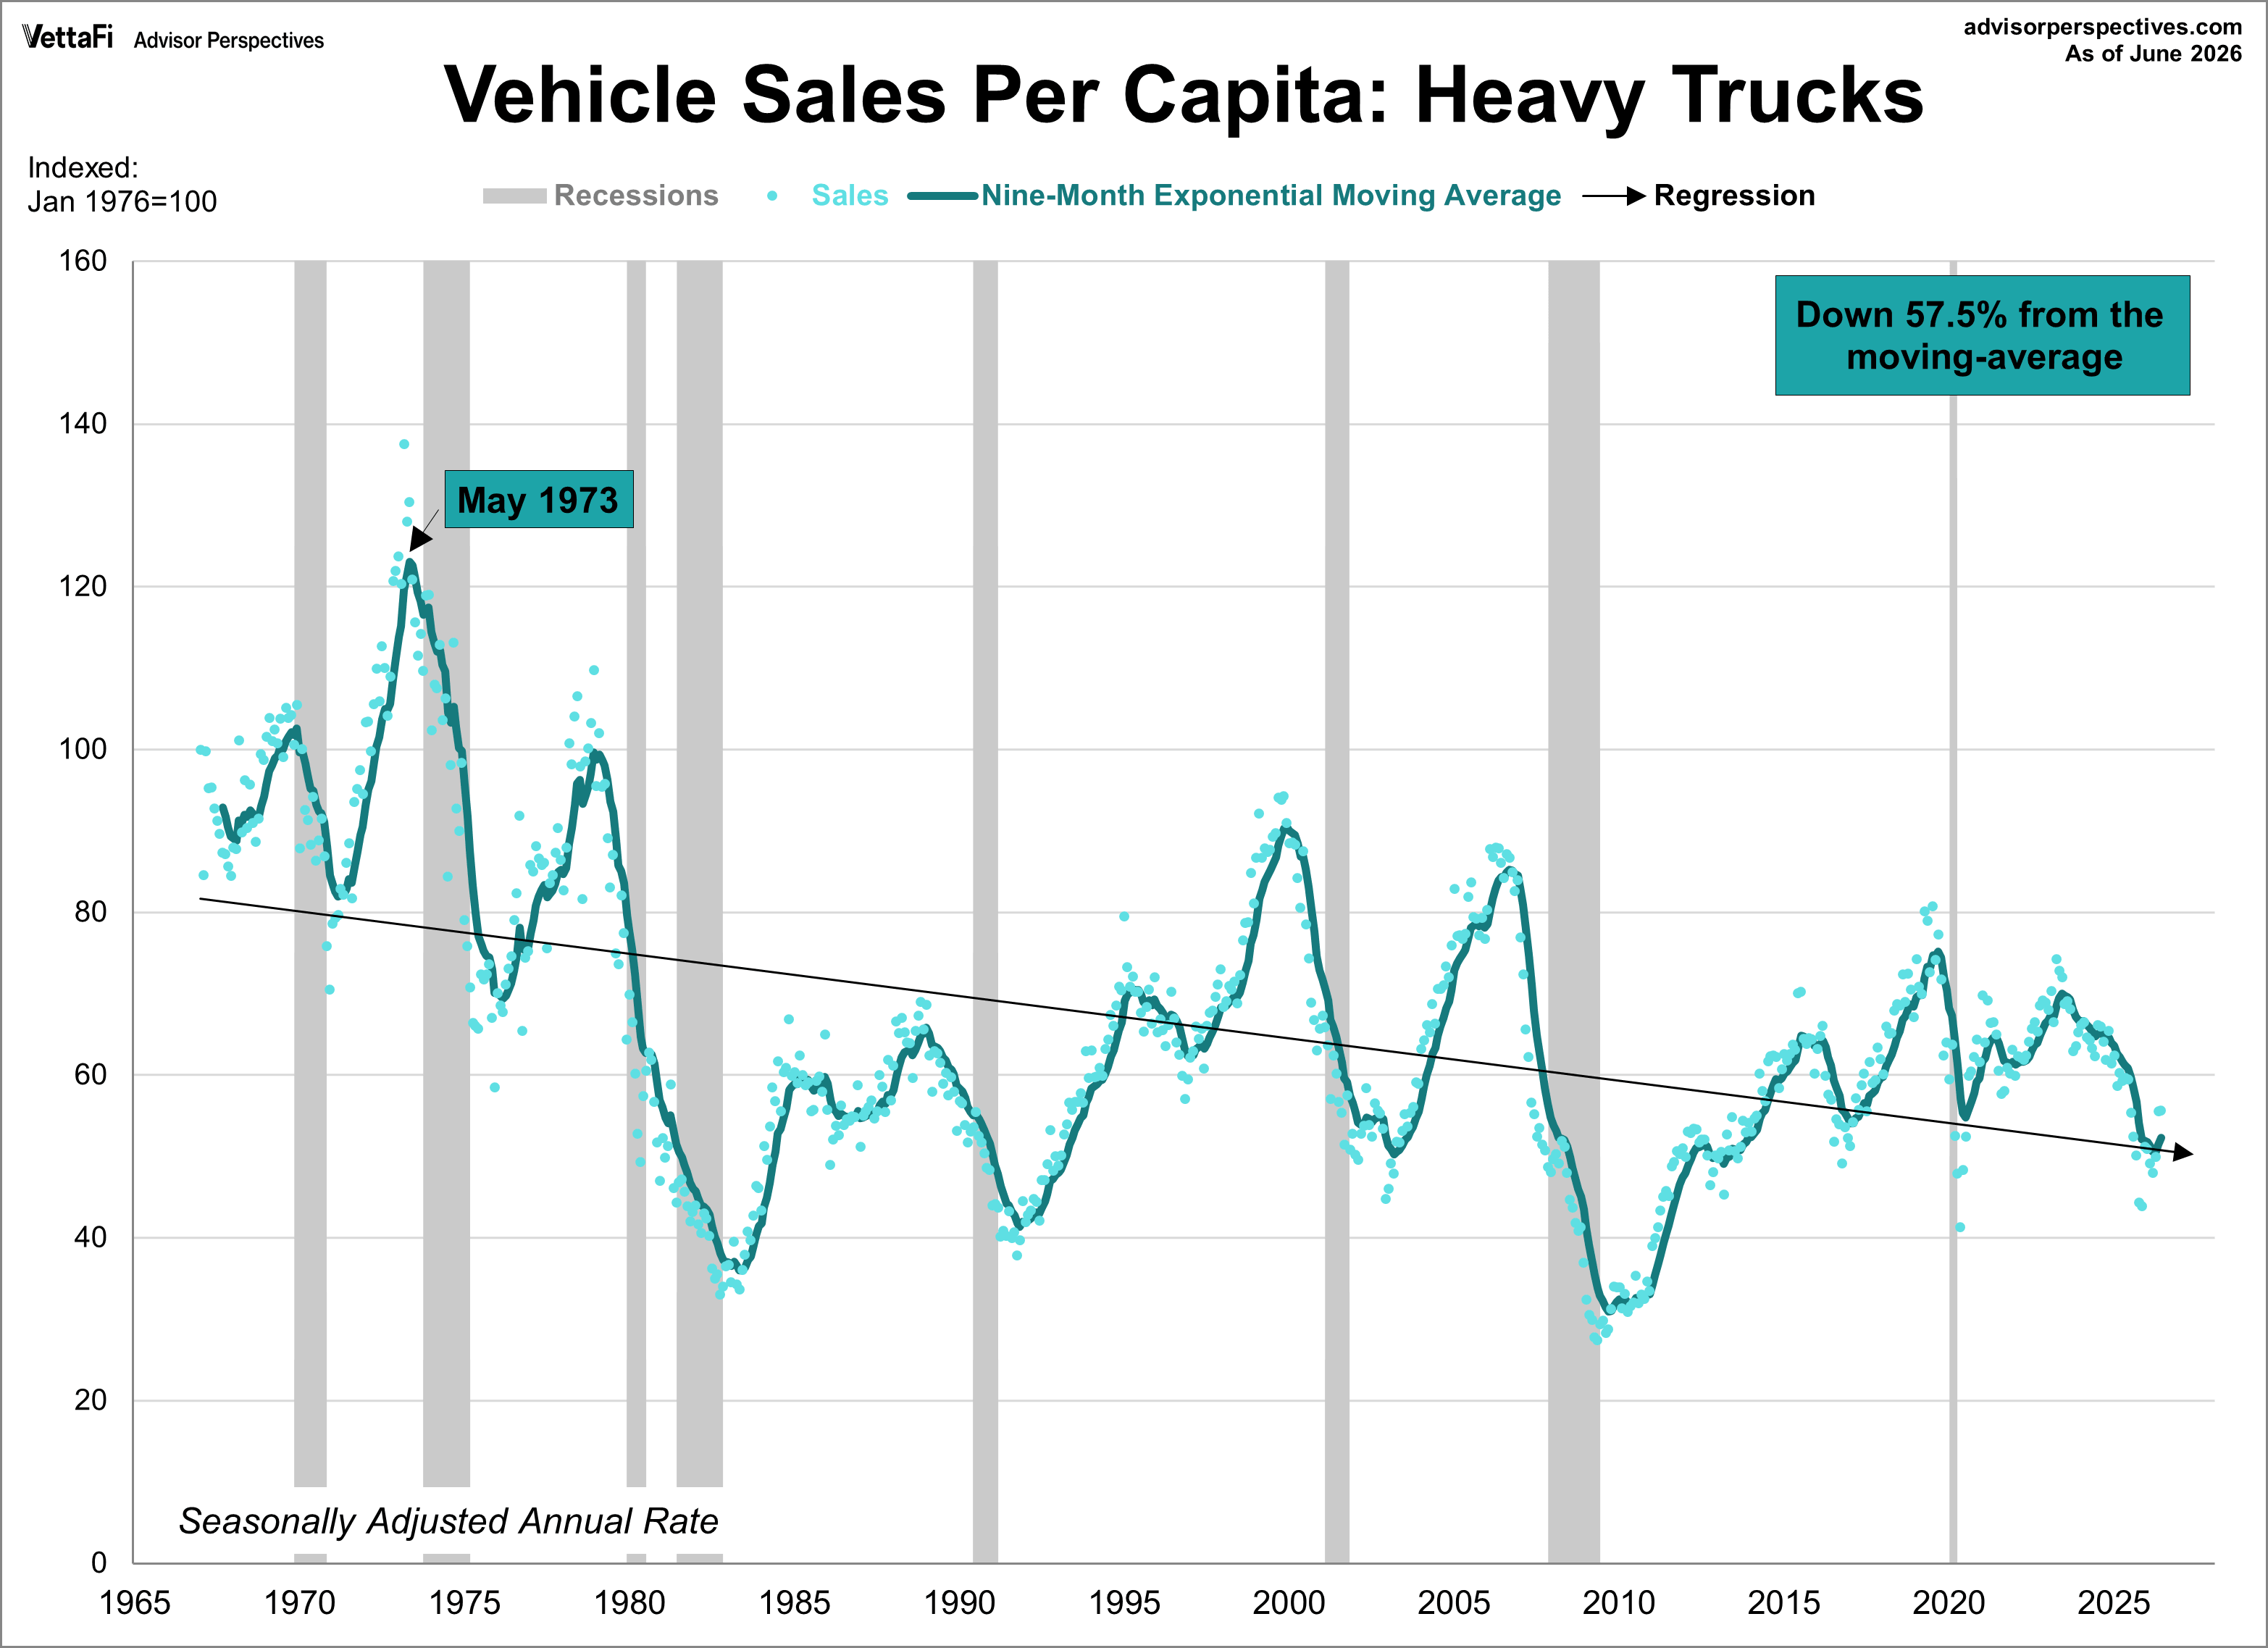
Heavy truck sales rose a third straight month to their highest level in a year in June, coming in at a seasonally adjusted annual rate of 0.402 million units. This represents a 0.1% increase from the previous month but a 5.9% drop from one year ago. Additionally, the nine-month exponential moving average is now at 0.400 million units.
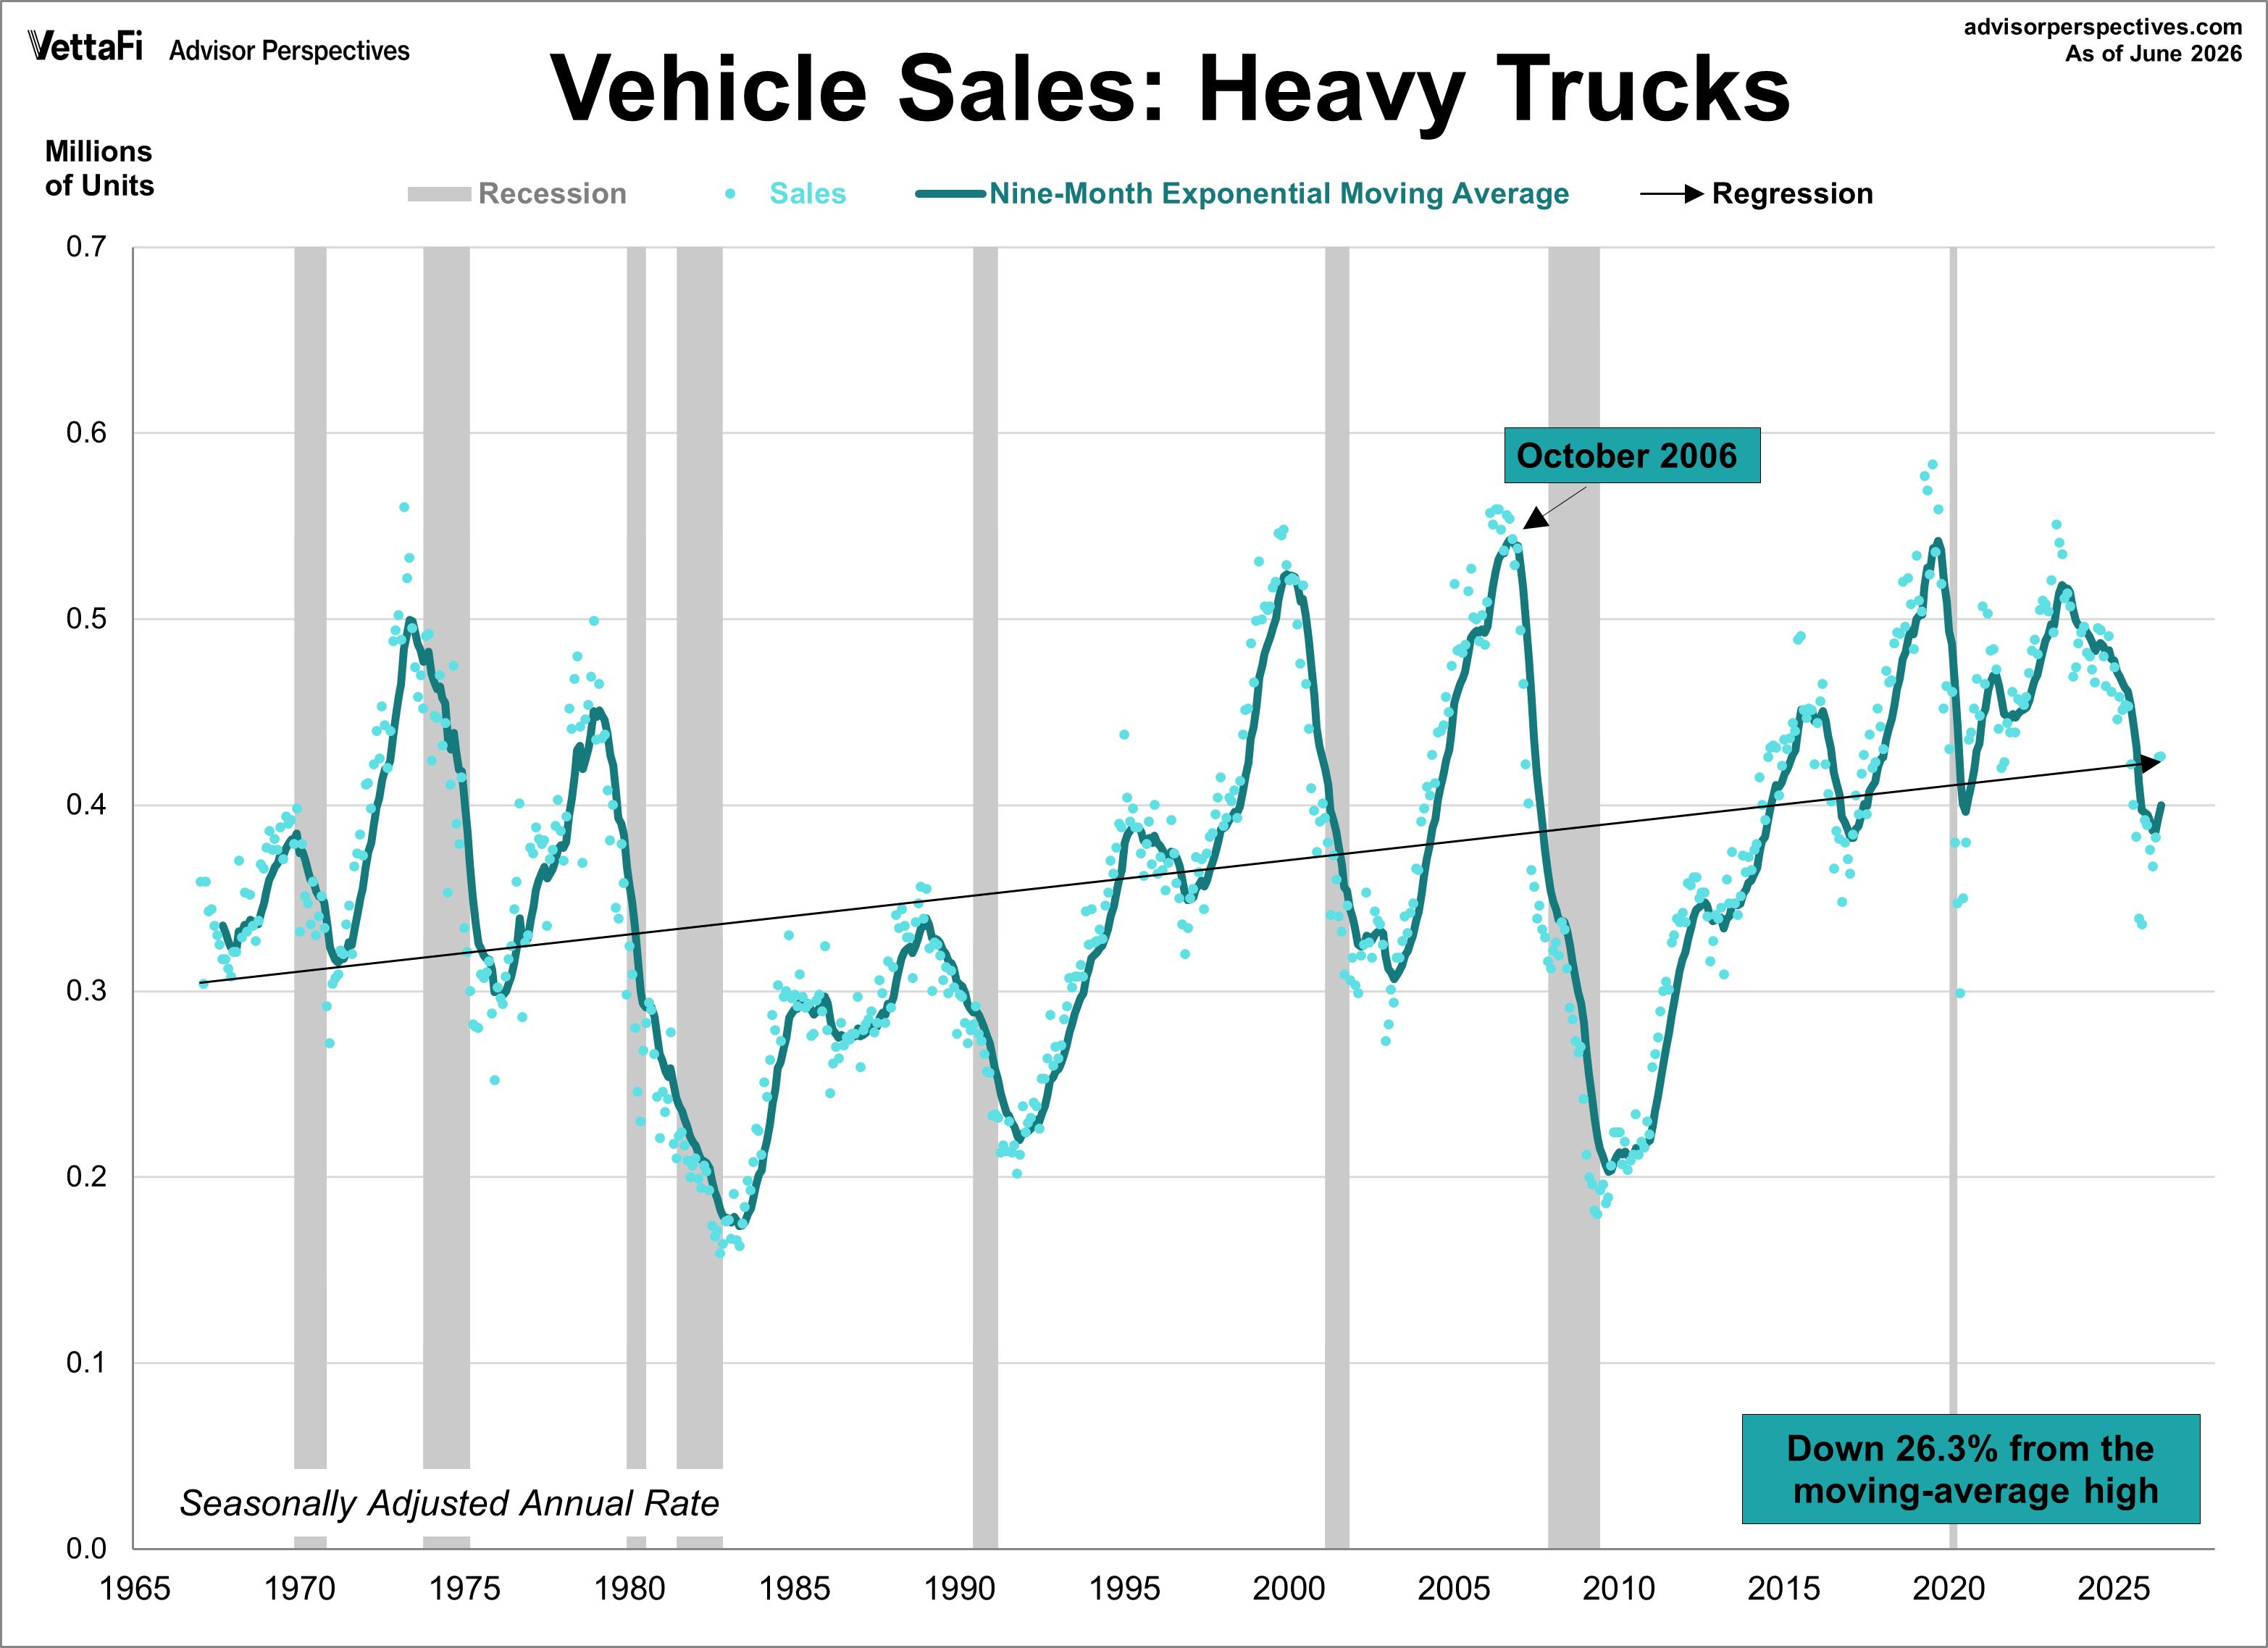
Here is the complete series data from 1967. Again, we've added a linear regression to further illustrate the direction of the long-term trend. The latest moving average value for heavy trucks is 26.3% below its record high in October 2006.
Vehicle Sales: Population-Adjustment
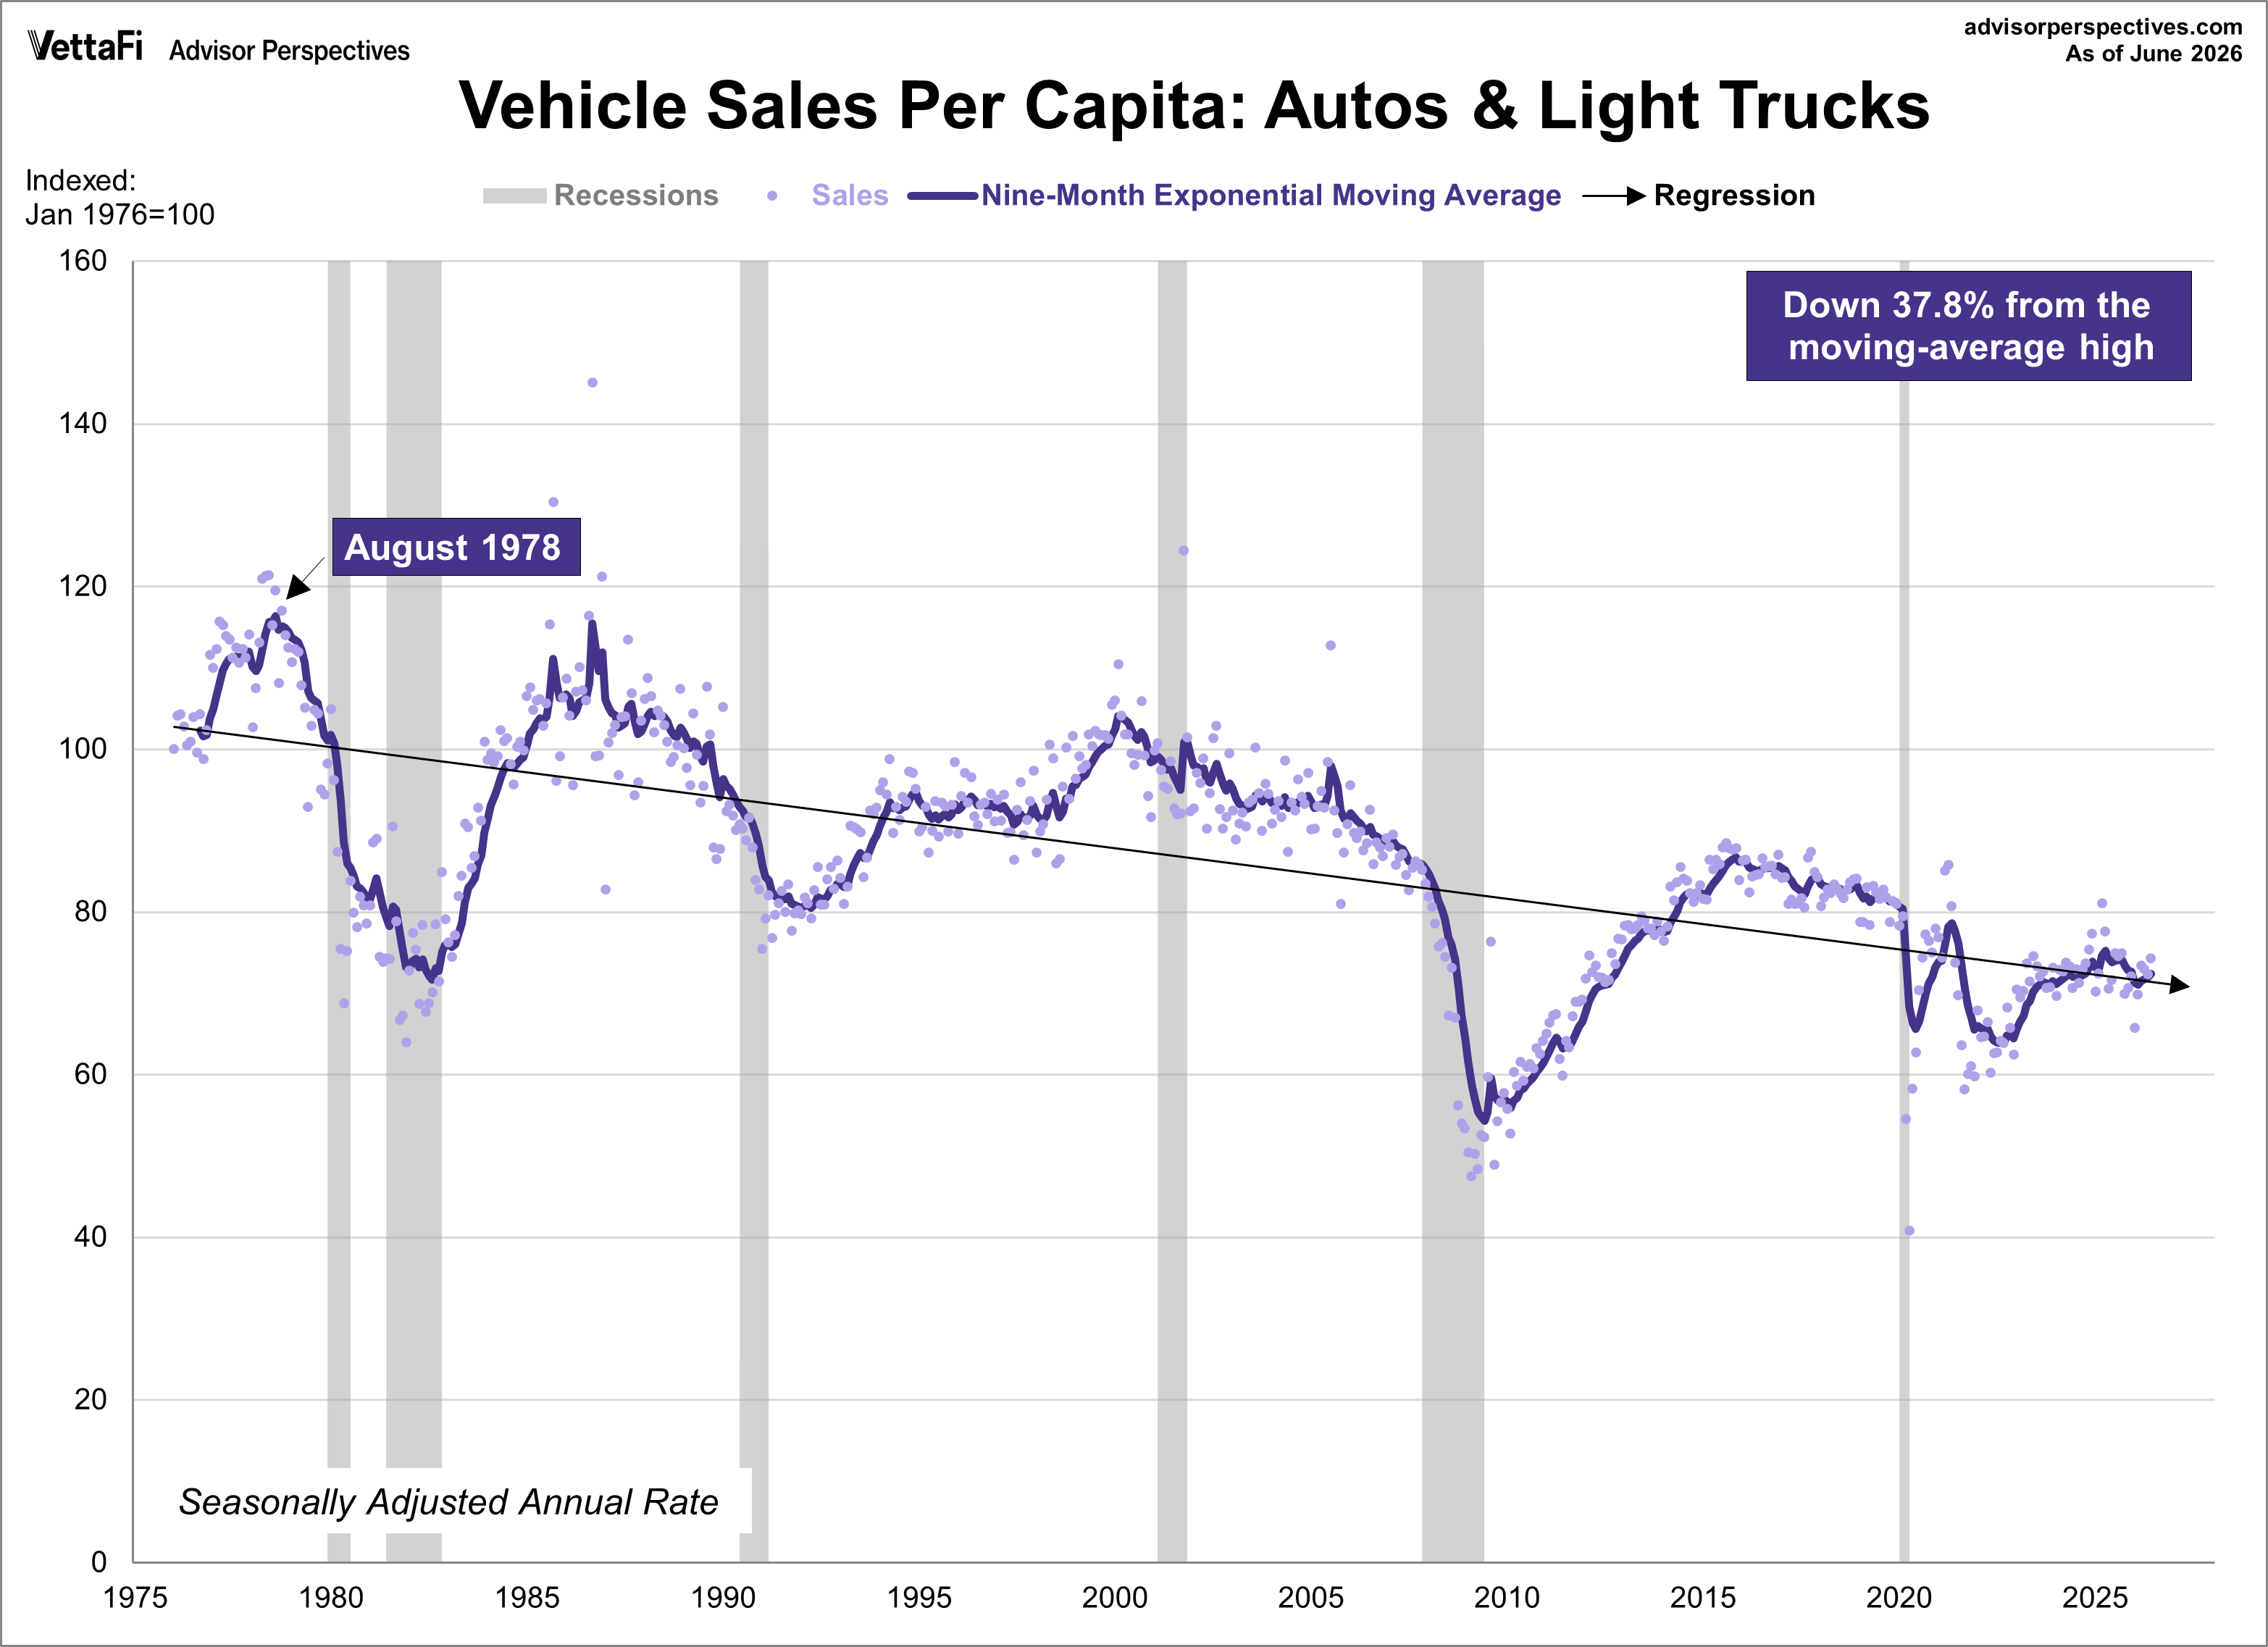
Since 1967, the civilian non-institutional population age 16 and over (i.e., driving age, not in the military, or an inmate) has risen about 64.5%. For a more accurate representation of vehicle sales, our next charts focus on the population-adjusted data by implementing two key modifications:
- We've created a per-capita version using the FRED's CNP16OV series for the adjustment.
- We've indexed the numbers so that the first data point, January 1976, equals 100.
The moving average for vehicle sales per capita series peaked in August 1978. Fast forward more almost 50 years, it is now down 37.8% from that peak.