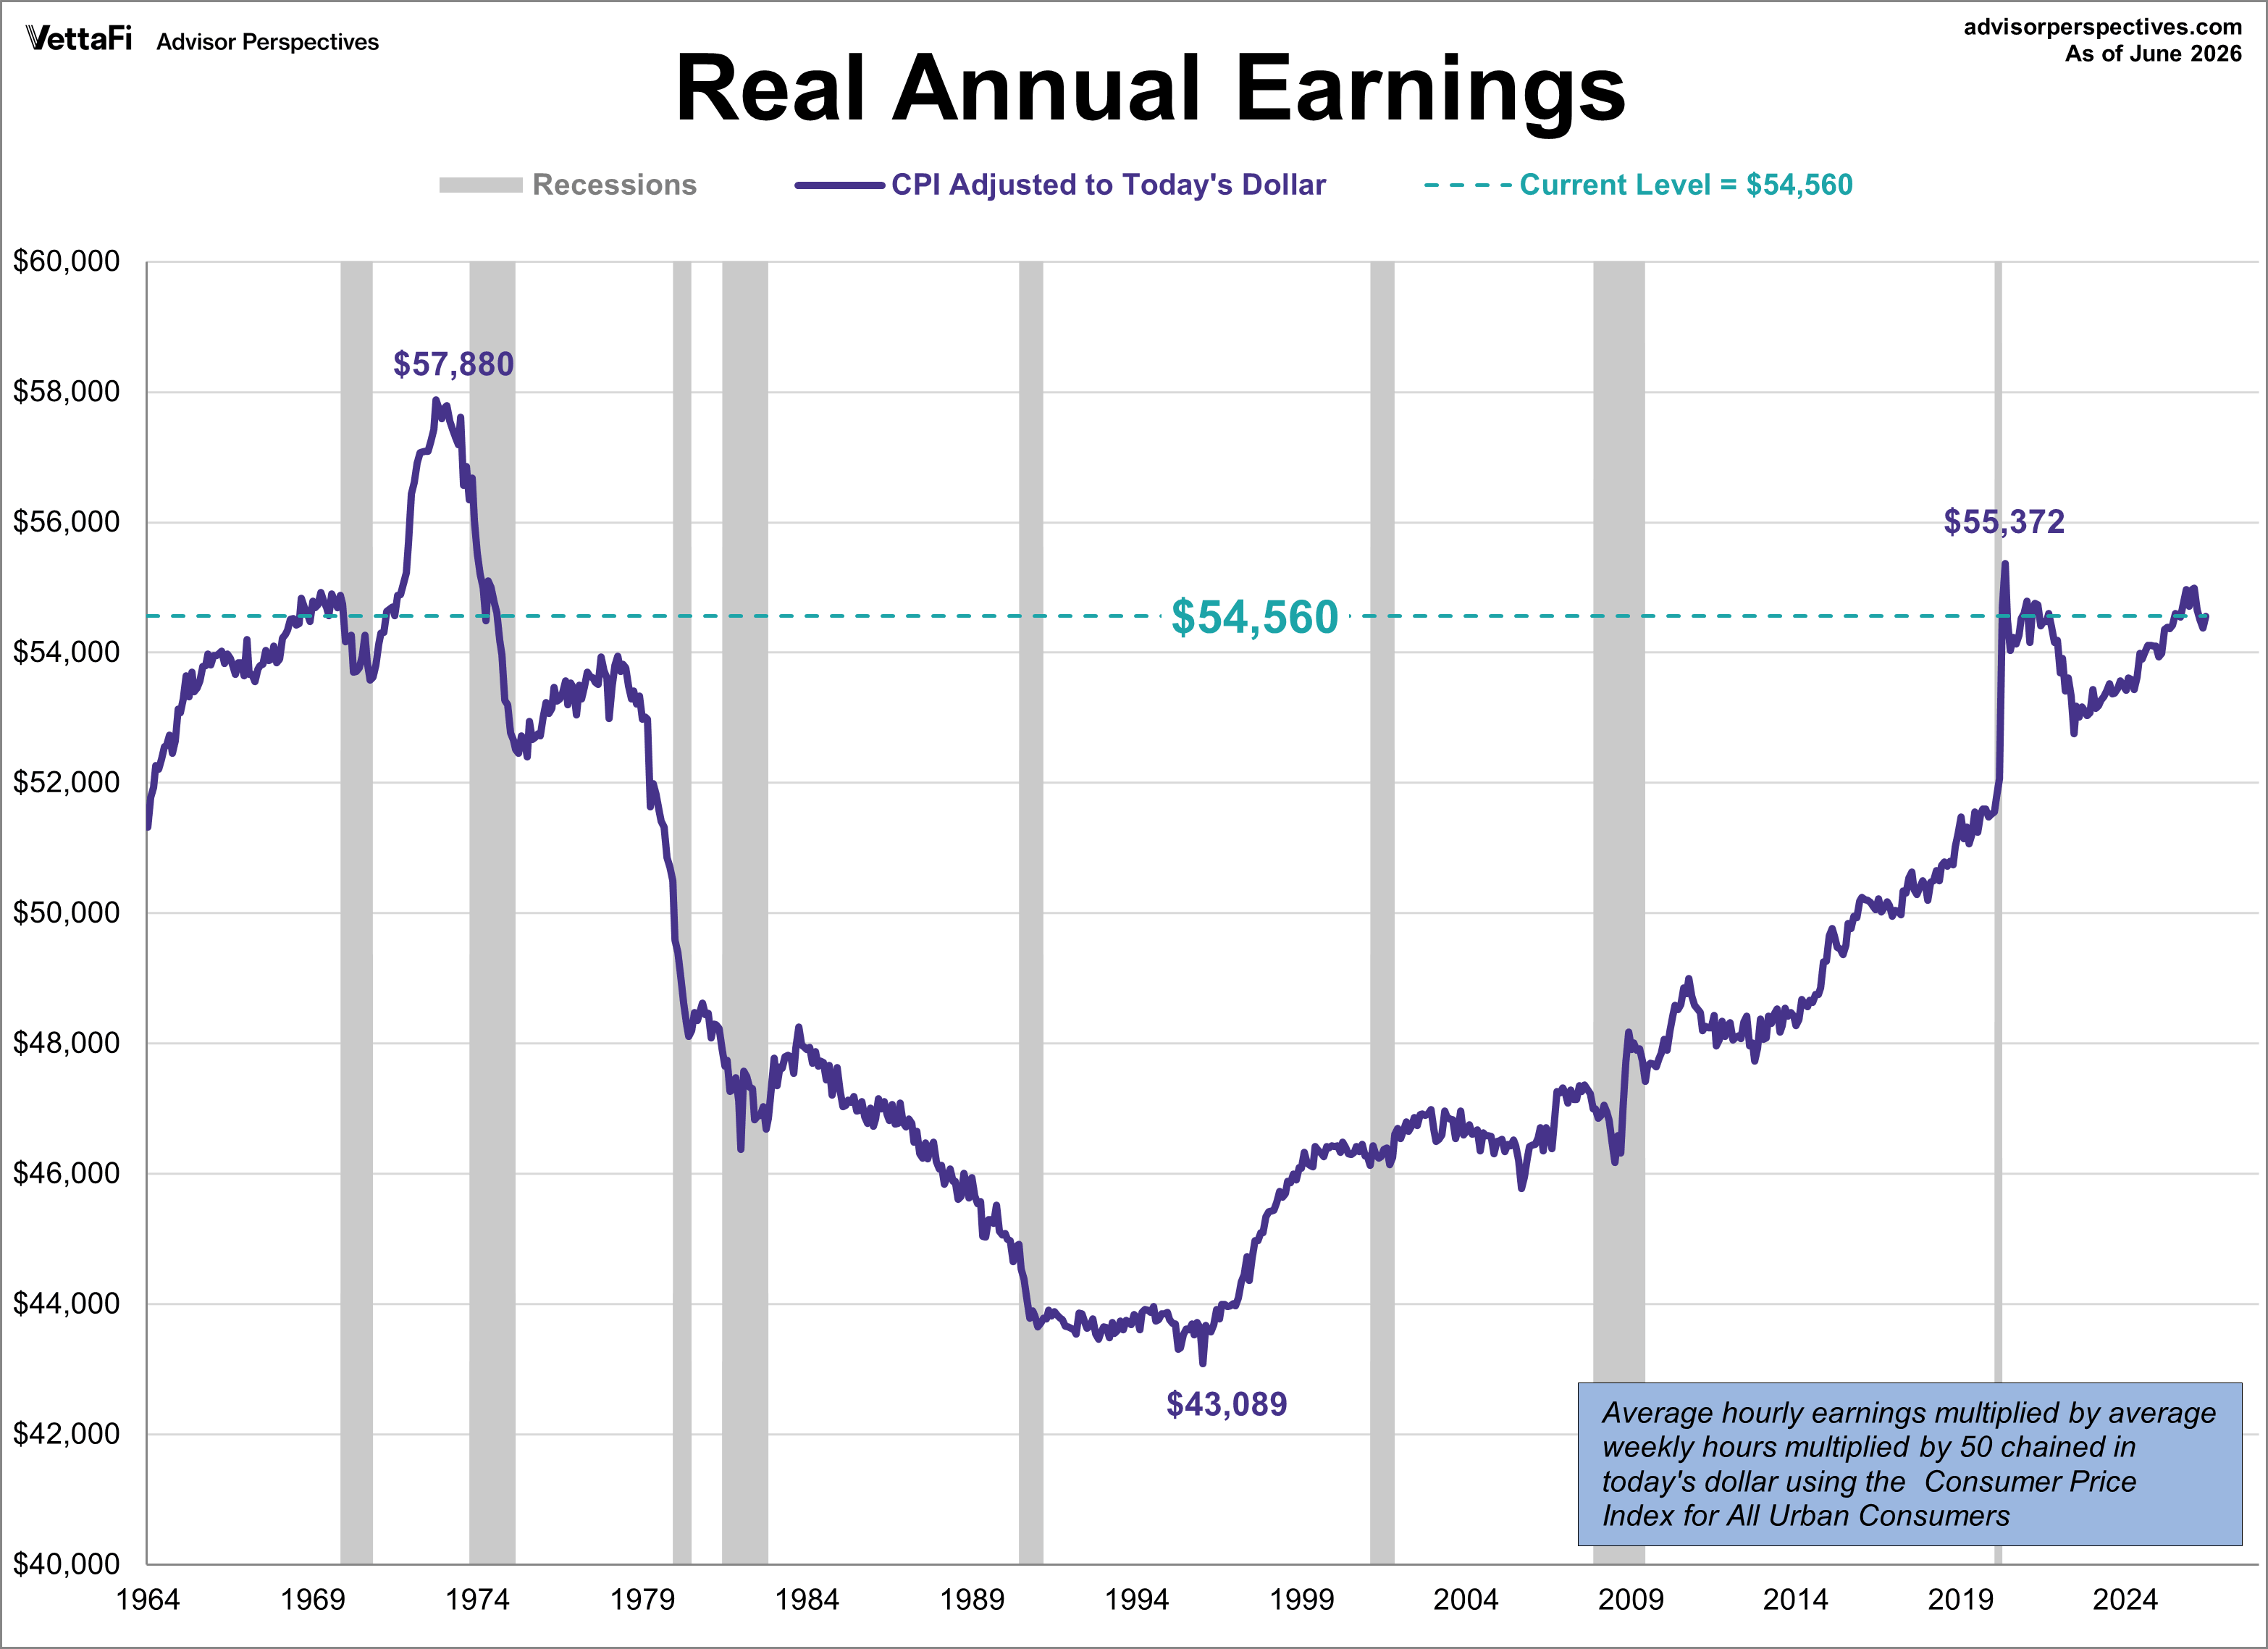
The Bureau of Labor Statistics has been collecting data on this workforce cohort since 1964. The government numbers provide some excellent insights on the income history of what we might think of as the private middle-class wage earner. This series has been updated to include the June release of the Consumer Price Index (CPI) as the deflator and the BLS monthly employment update. The latest hypothetical real (inflation-adjusted) annual earnings are at $54,560, down 5.7% from over 50 years ago.
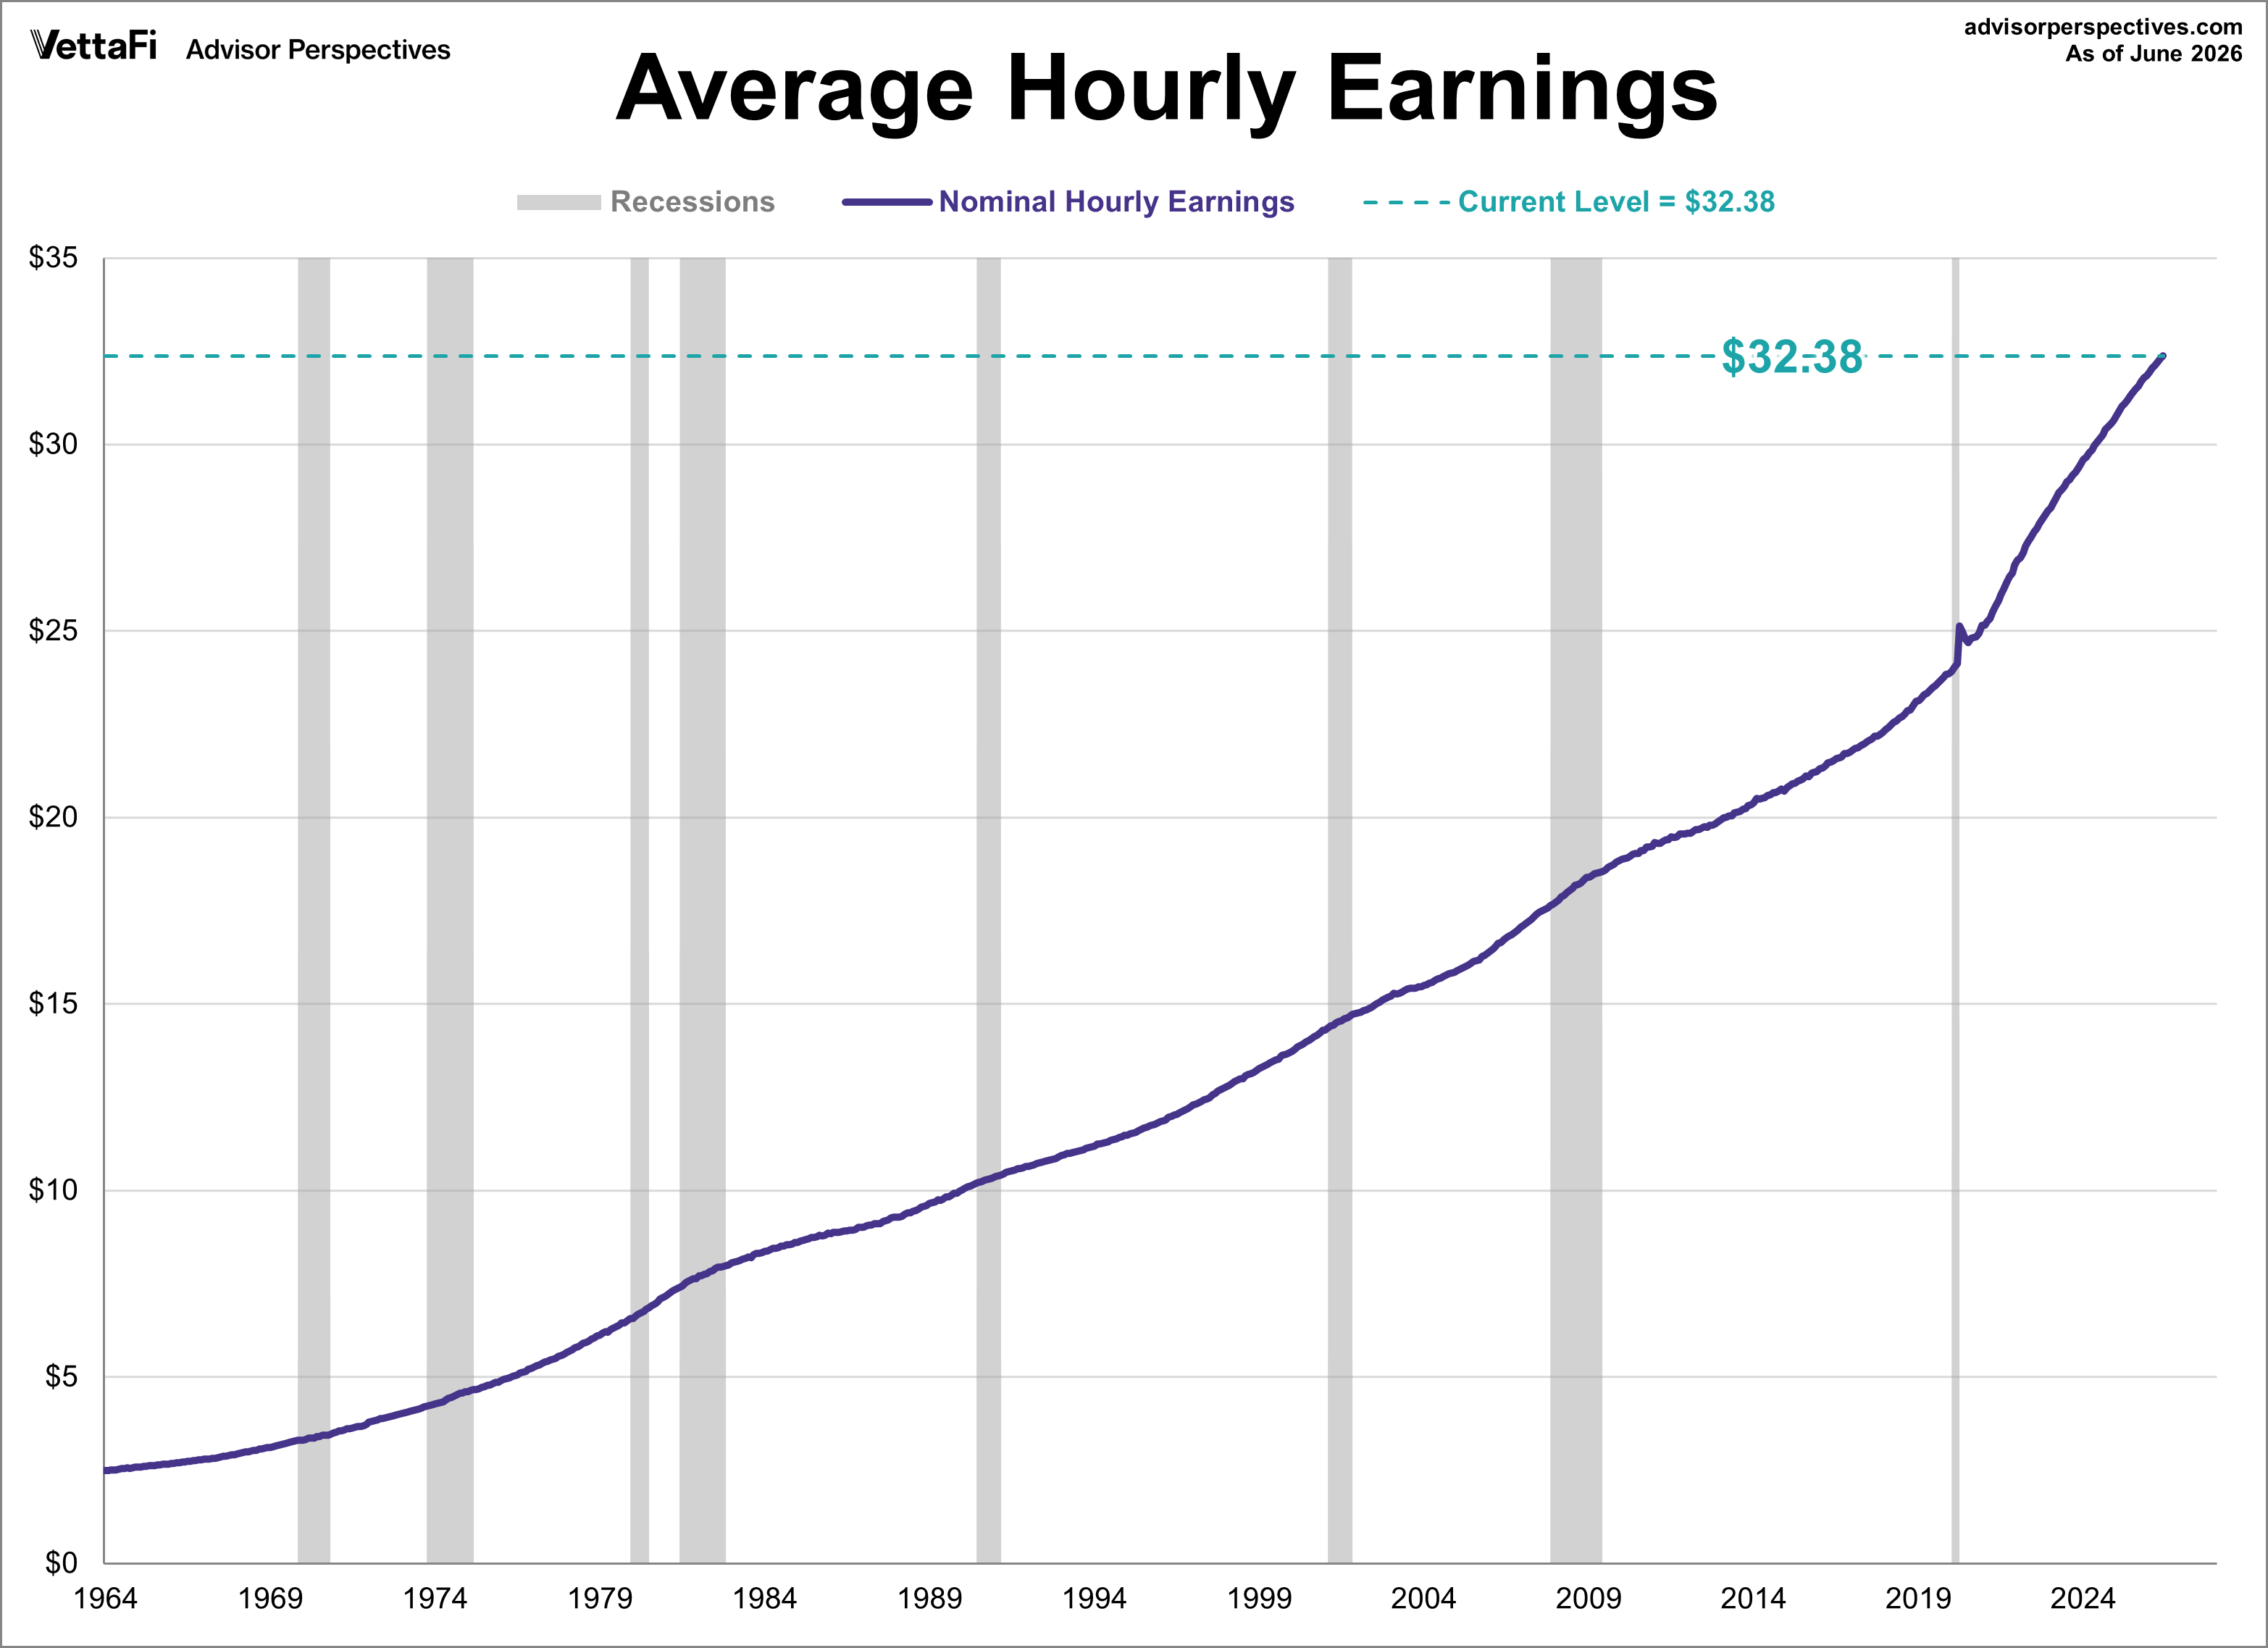
The first snapshot shows the growth of average hourly earnings. The nominal data exhibits a relatively smooth upward trend. The COVID pandemic caused a temporary rise in earnings likely due to demand for temporary work. Hourly earnings in June were at $32.38, up from $32.31 in May.

There are, however, two critical pieces of information that dramatically alter the nominal series: the average hours per week and inflation.
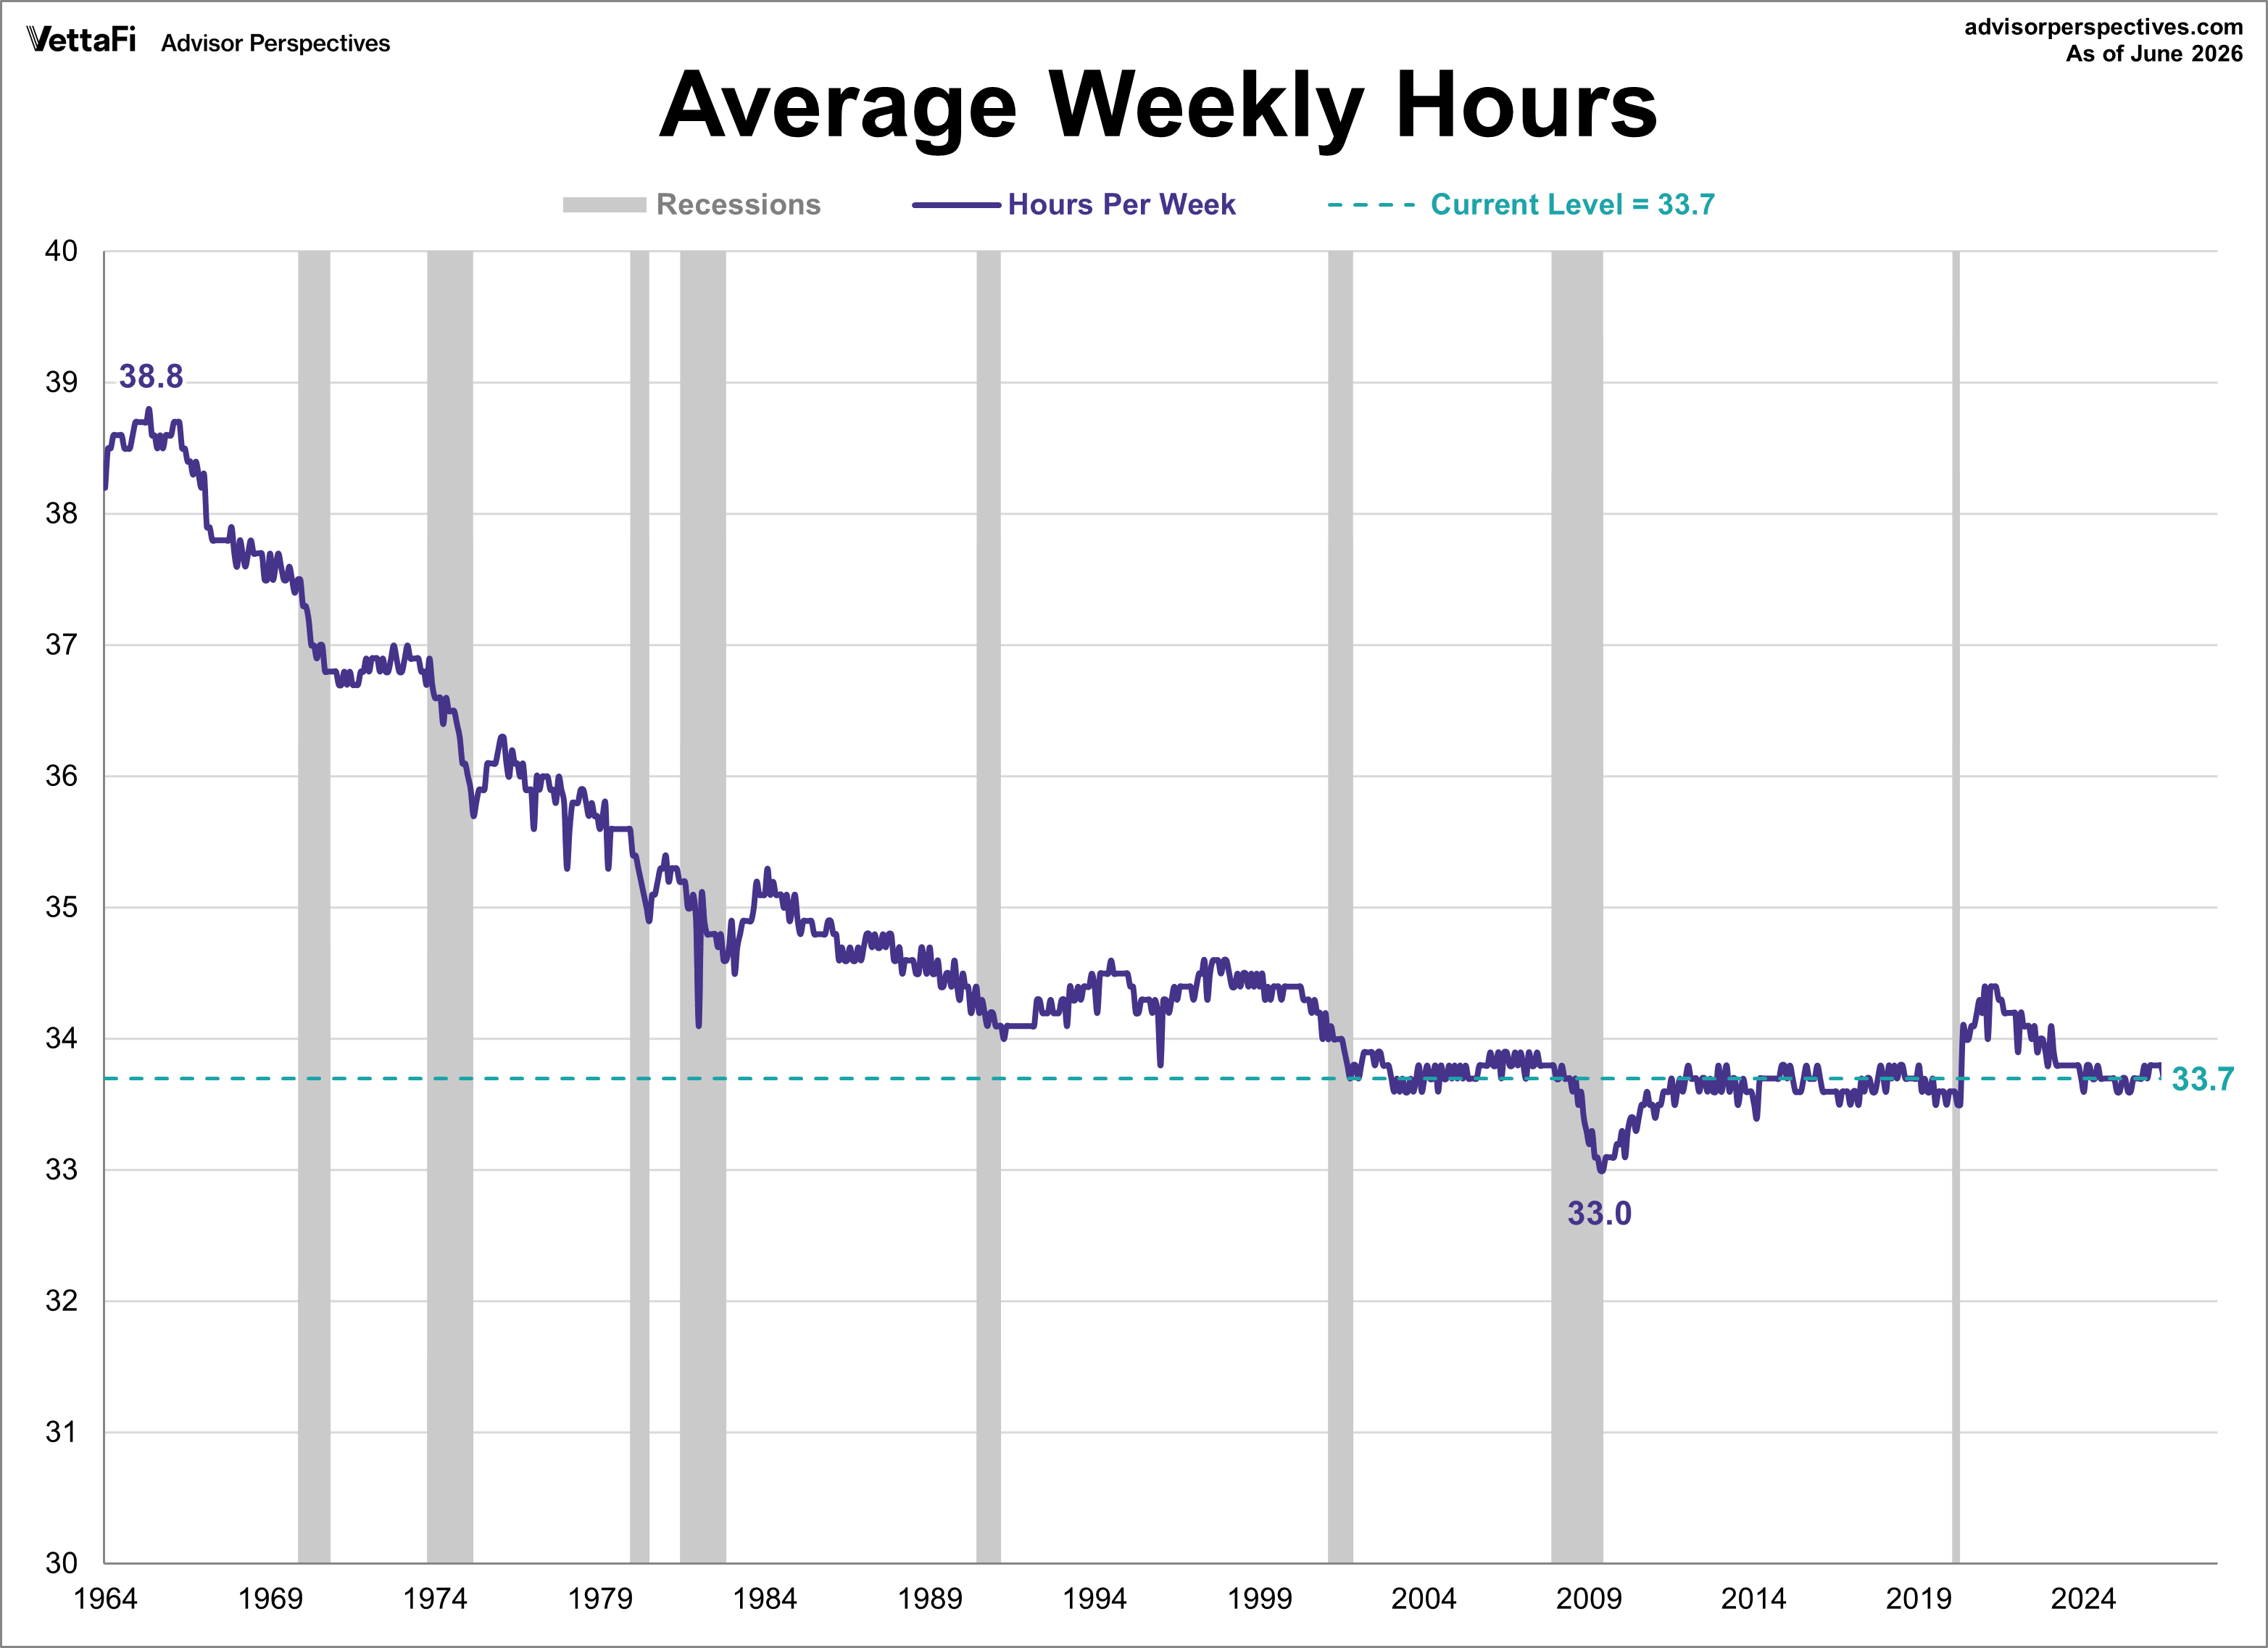
The average hours per week has trended in quite a different direction, from around 39 hours per week in the mid-1960s to a low of 33 hours at the end of the great recession (2009). At the beginning of the COVID crisis, weekly hours dropped to as low as 33.3. However, at the start of 2021, weekly hours quickly rose to levels last seen in the mid- to late 90s before gradually retreating. In June, weekly hours were at 33.7, down from 33.8 in May.
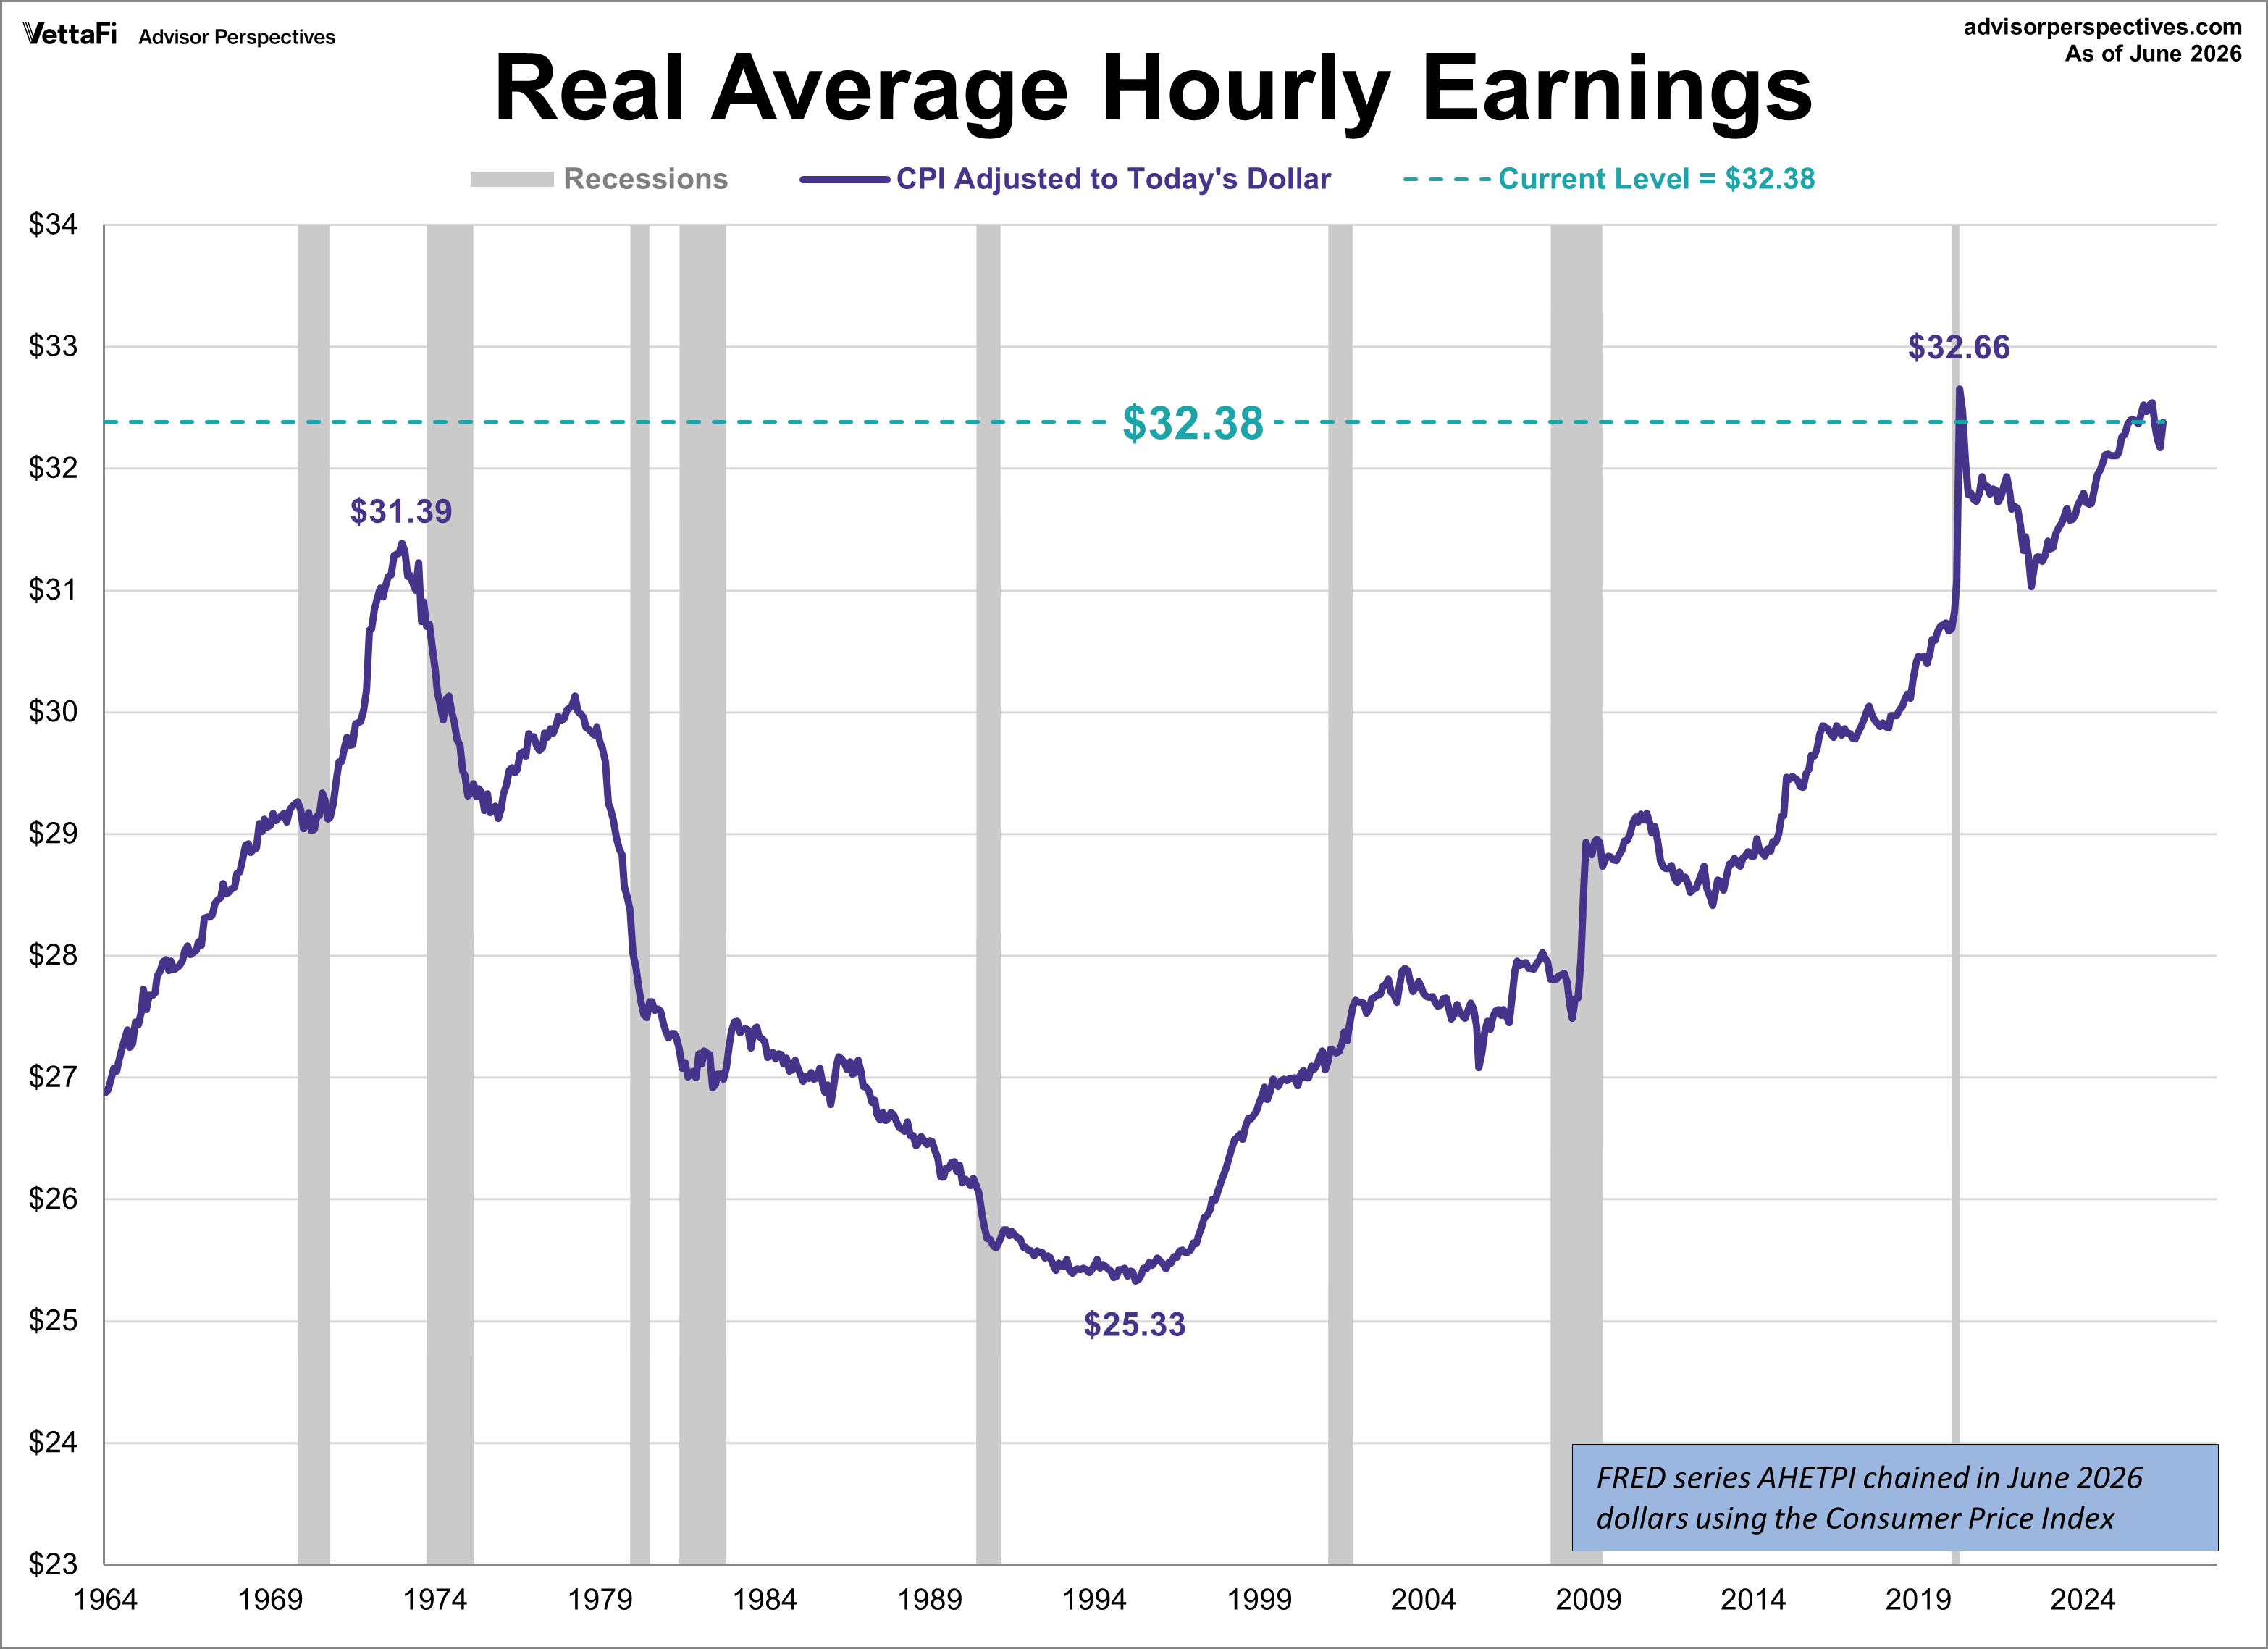
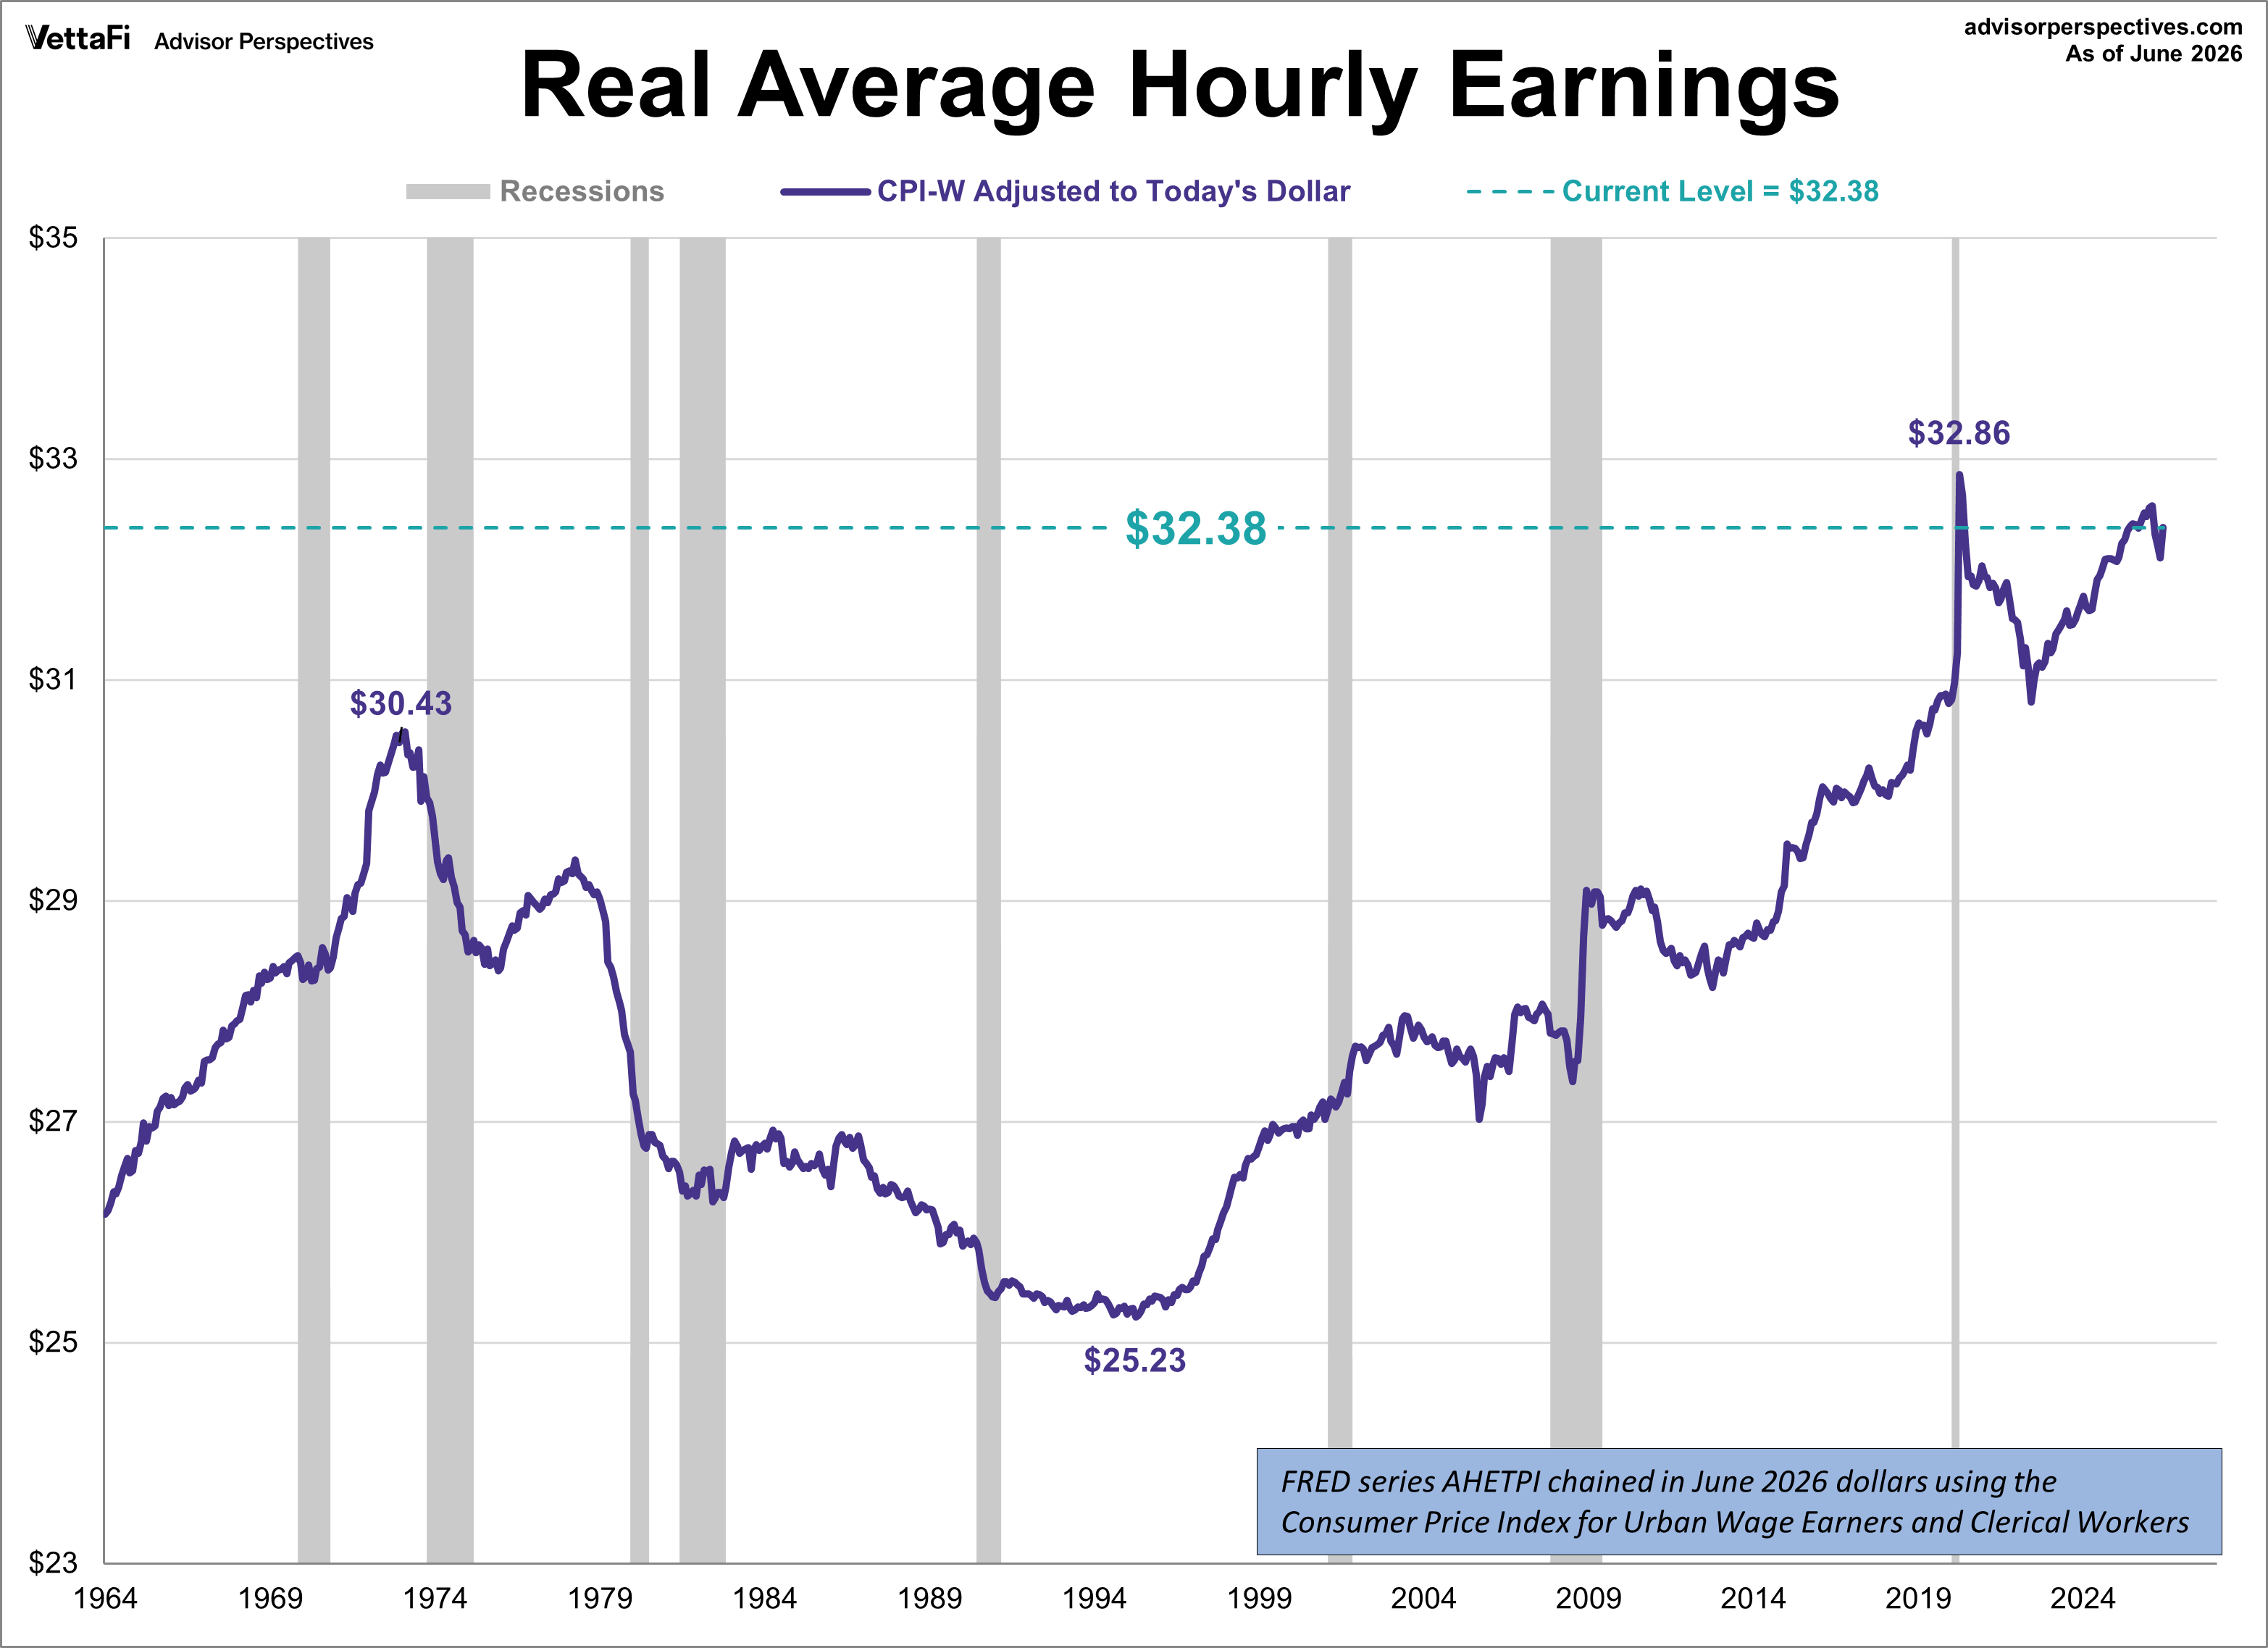
What about inflation? The next chart adjusts hourly earnings to the purchasing power of today's dollar. We've used the familiar CPI for urban consumers for the adjustment through the latest monthly data. Theoretically, the CPI is designed to reflect the cost of living for metropolitan-area households.
Recall from the nominal chart that the latest hourly earnings were at an all-time high. However, after adjusting for inflation, we see that the latest hourly earnings are below their all-time high reached in April 2020.
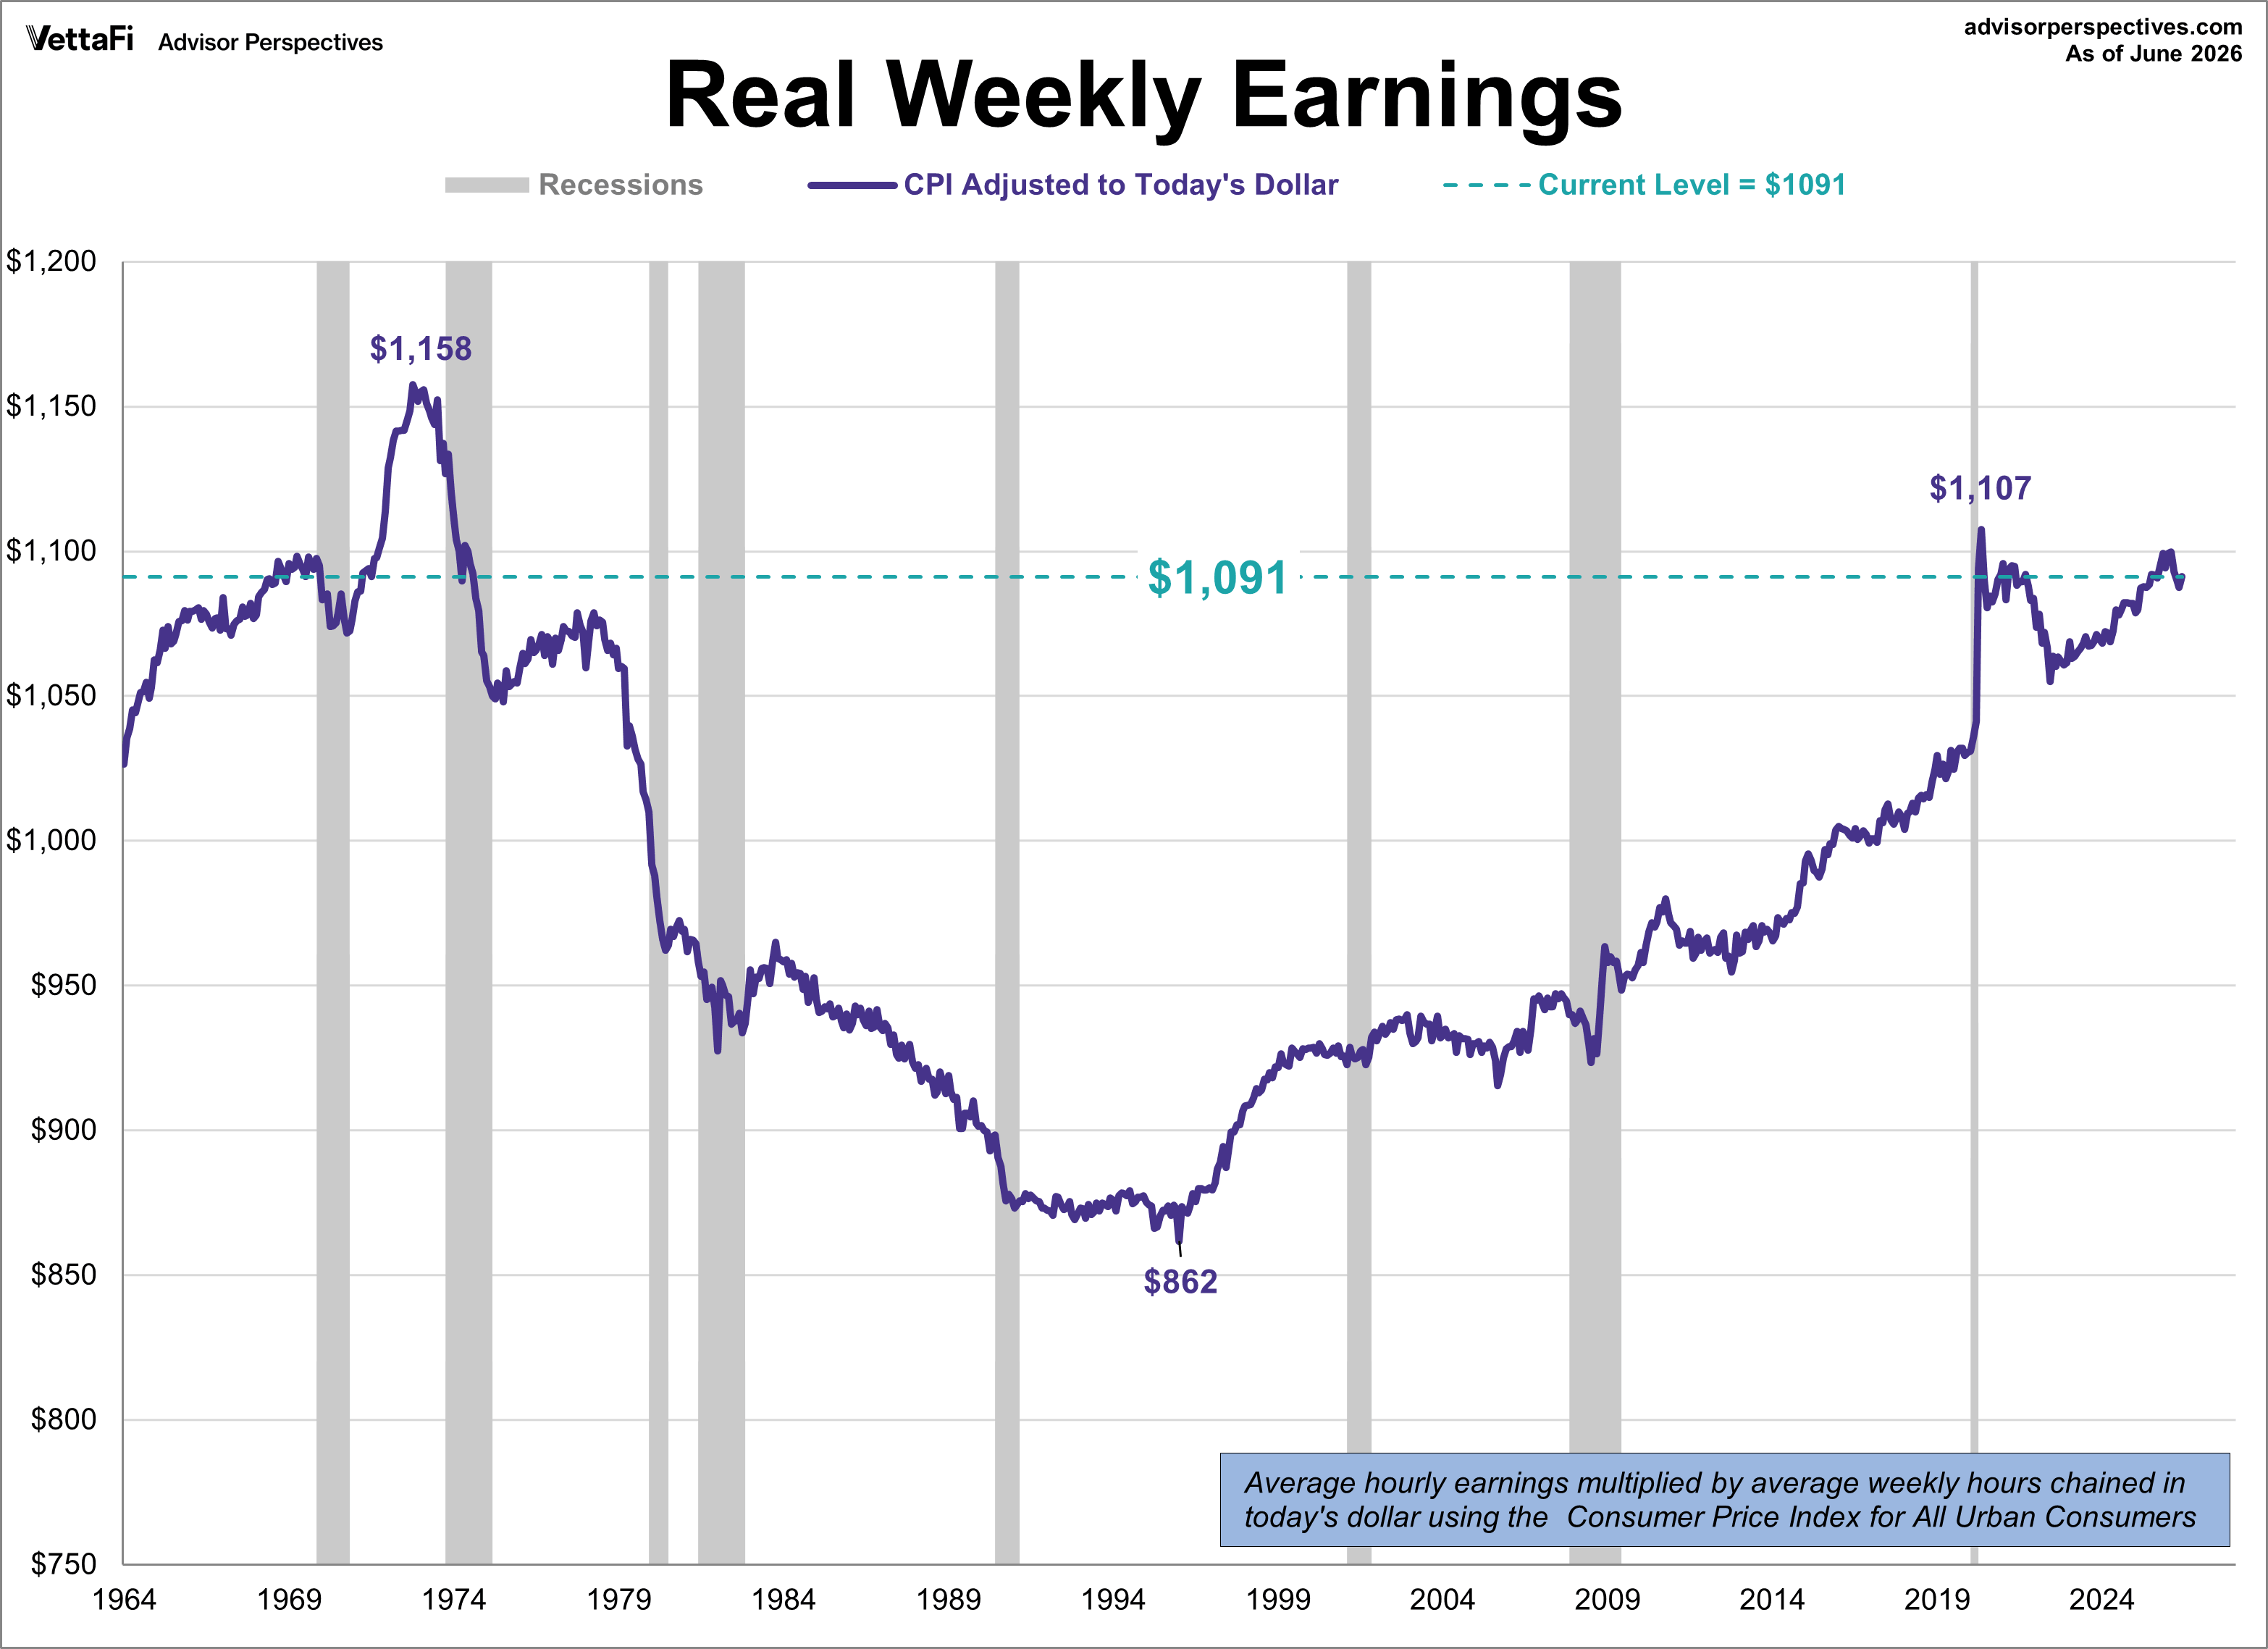
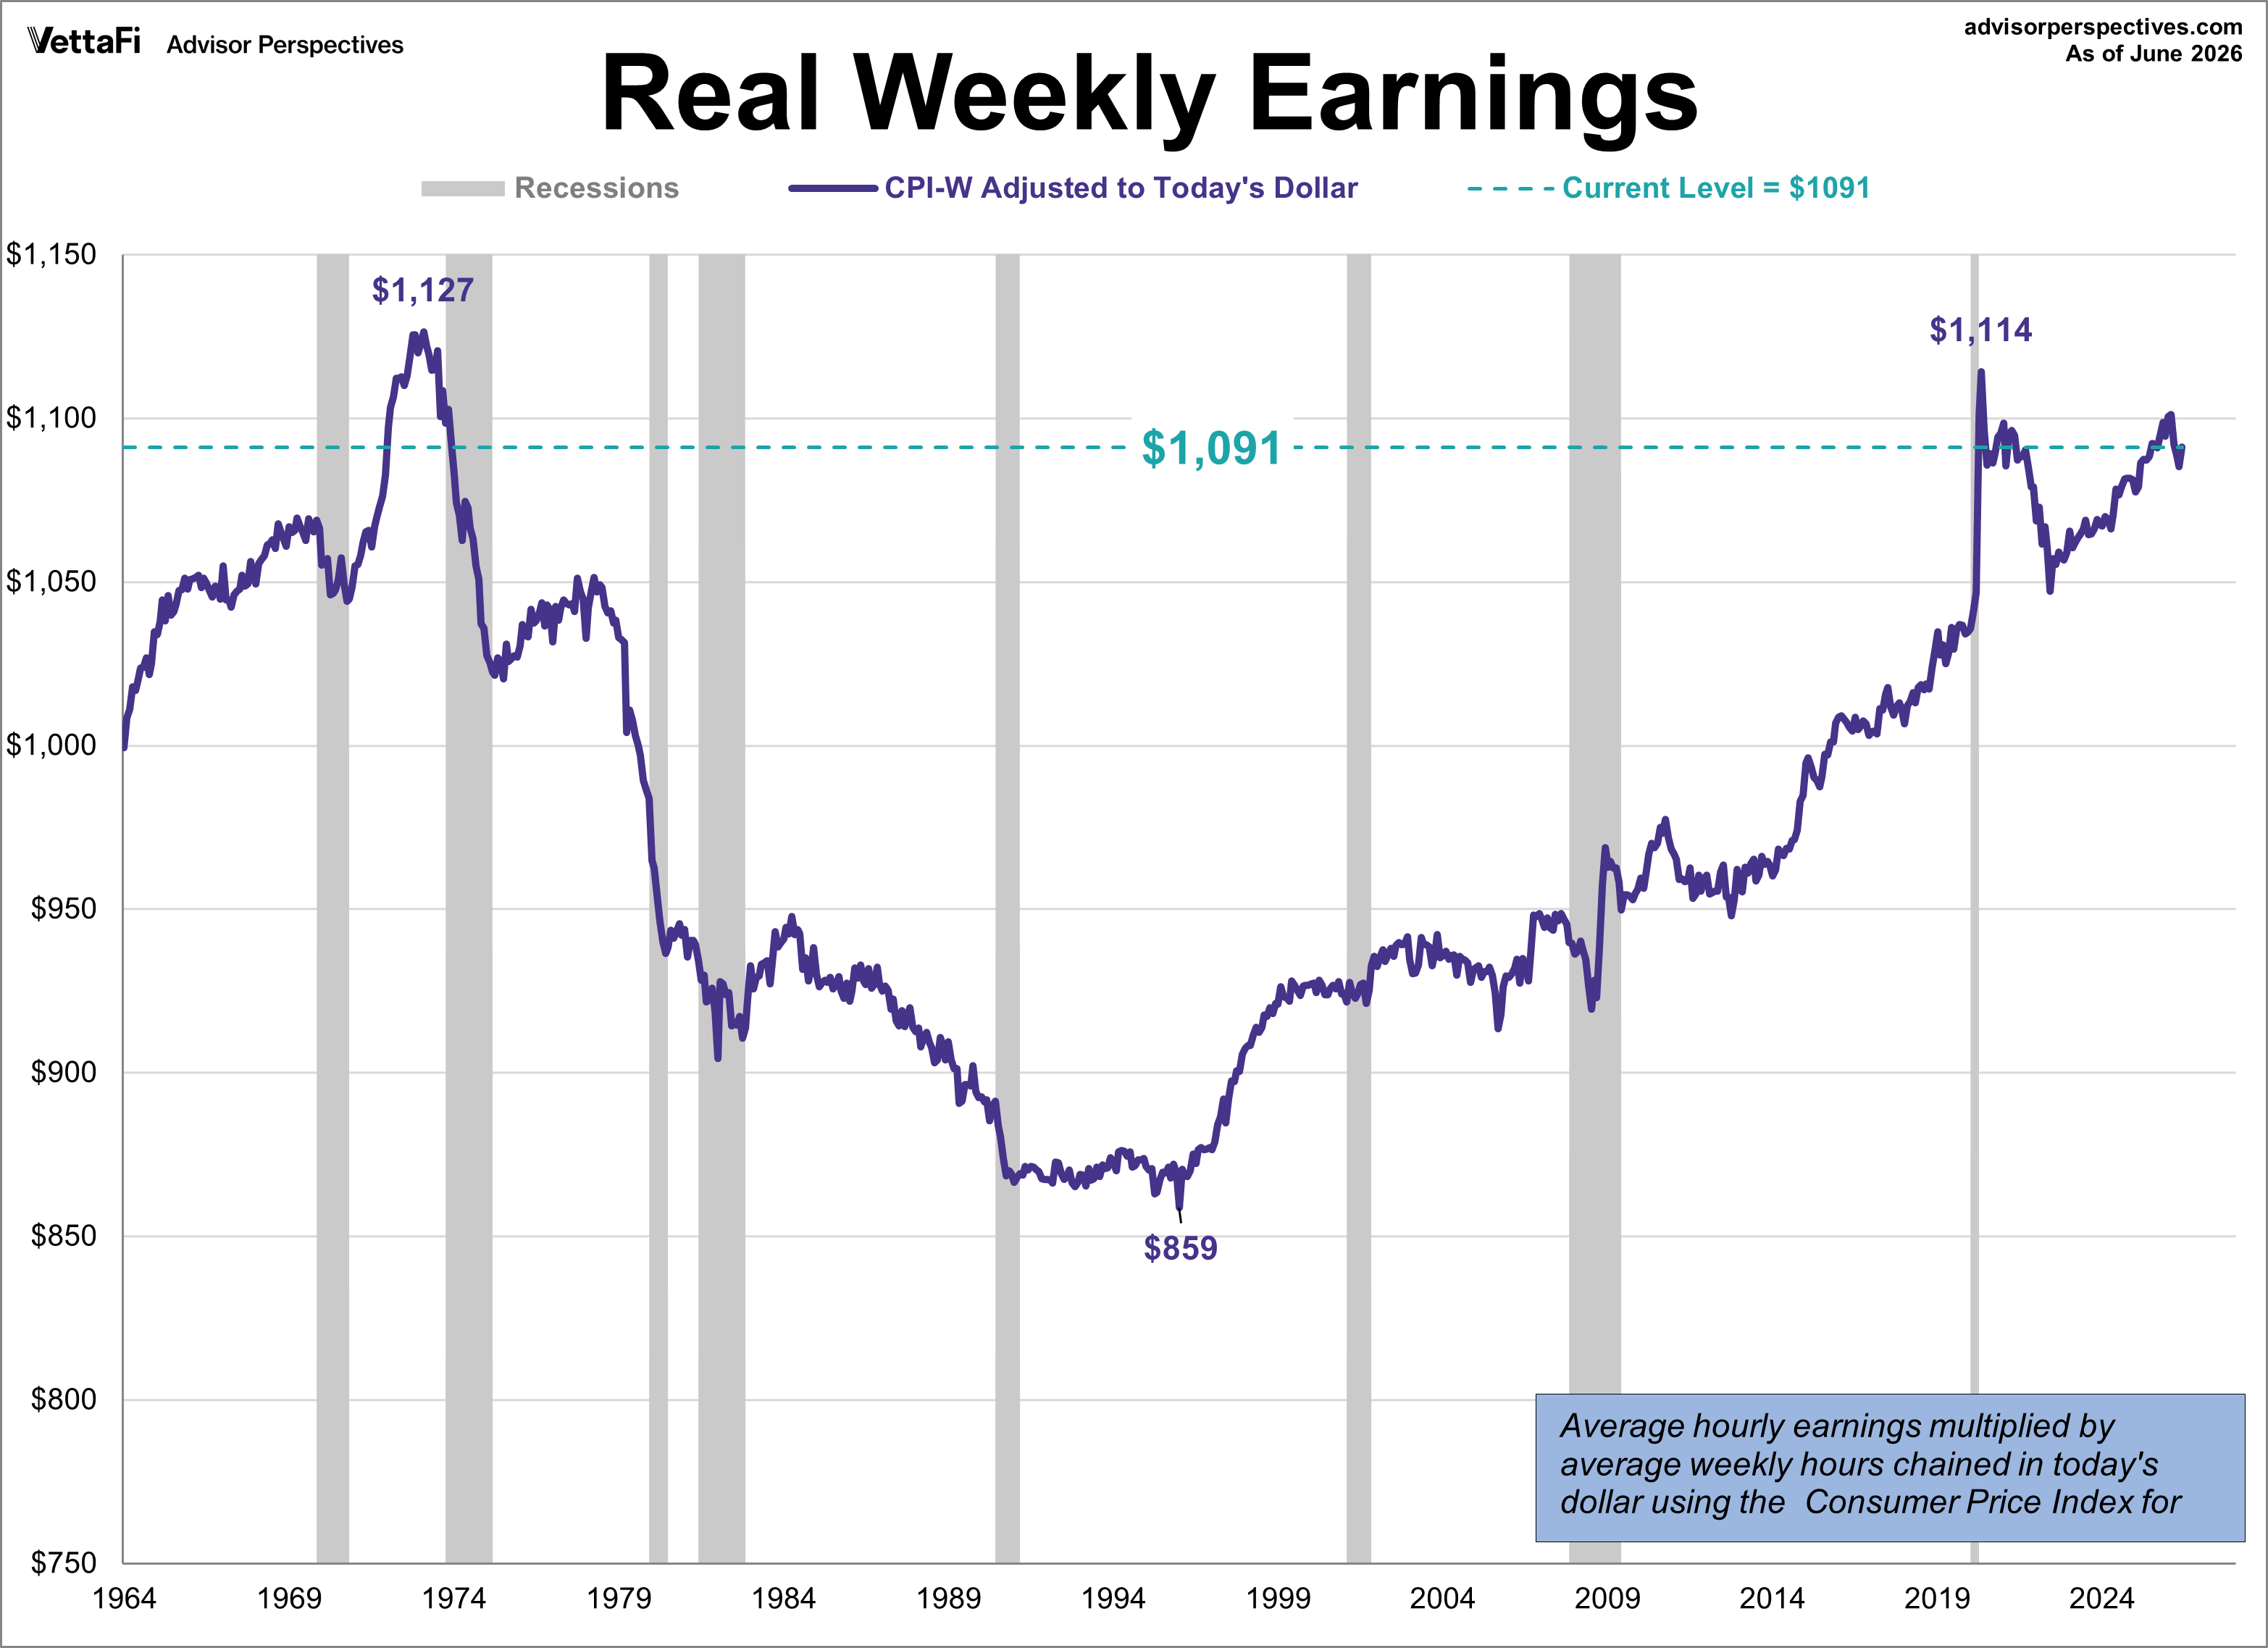
Now let's multiply the real average hourly earnings ($32.38) by the average hours per week (33.7). We thus get a figure for average weekly earnings of this middle-class cohort, currently at $1,091 — below its $1,158 peak back in the early 1970s and just under the most recent peak from 2020.
This is a gross income number that doesn't include any tax withholding or other deductions. Disposable income would be noticeably lower.
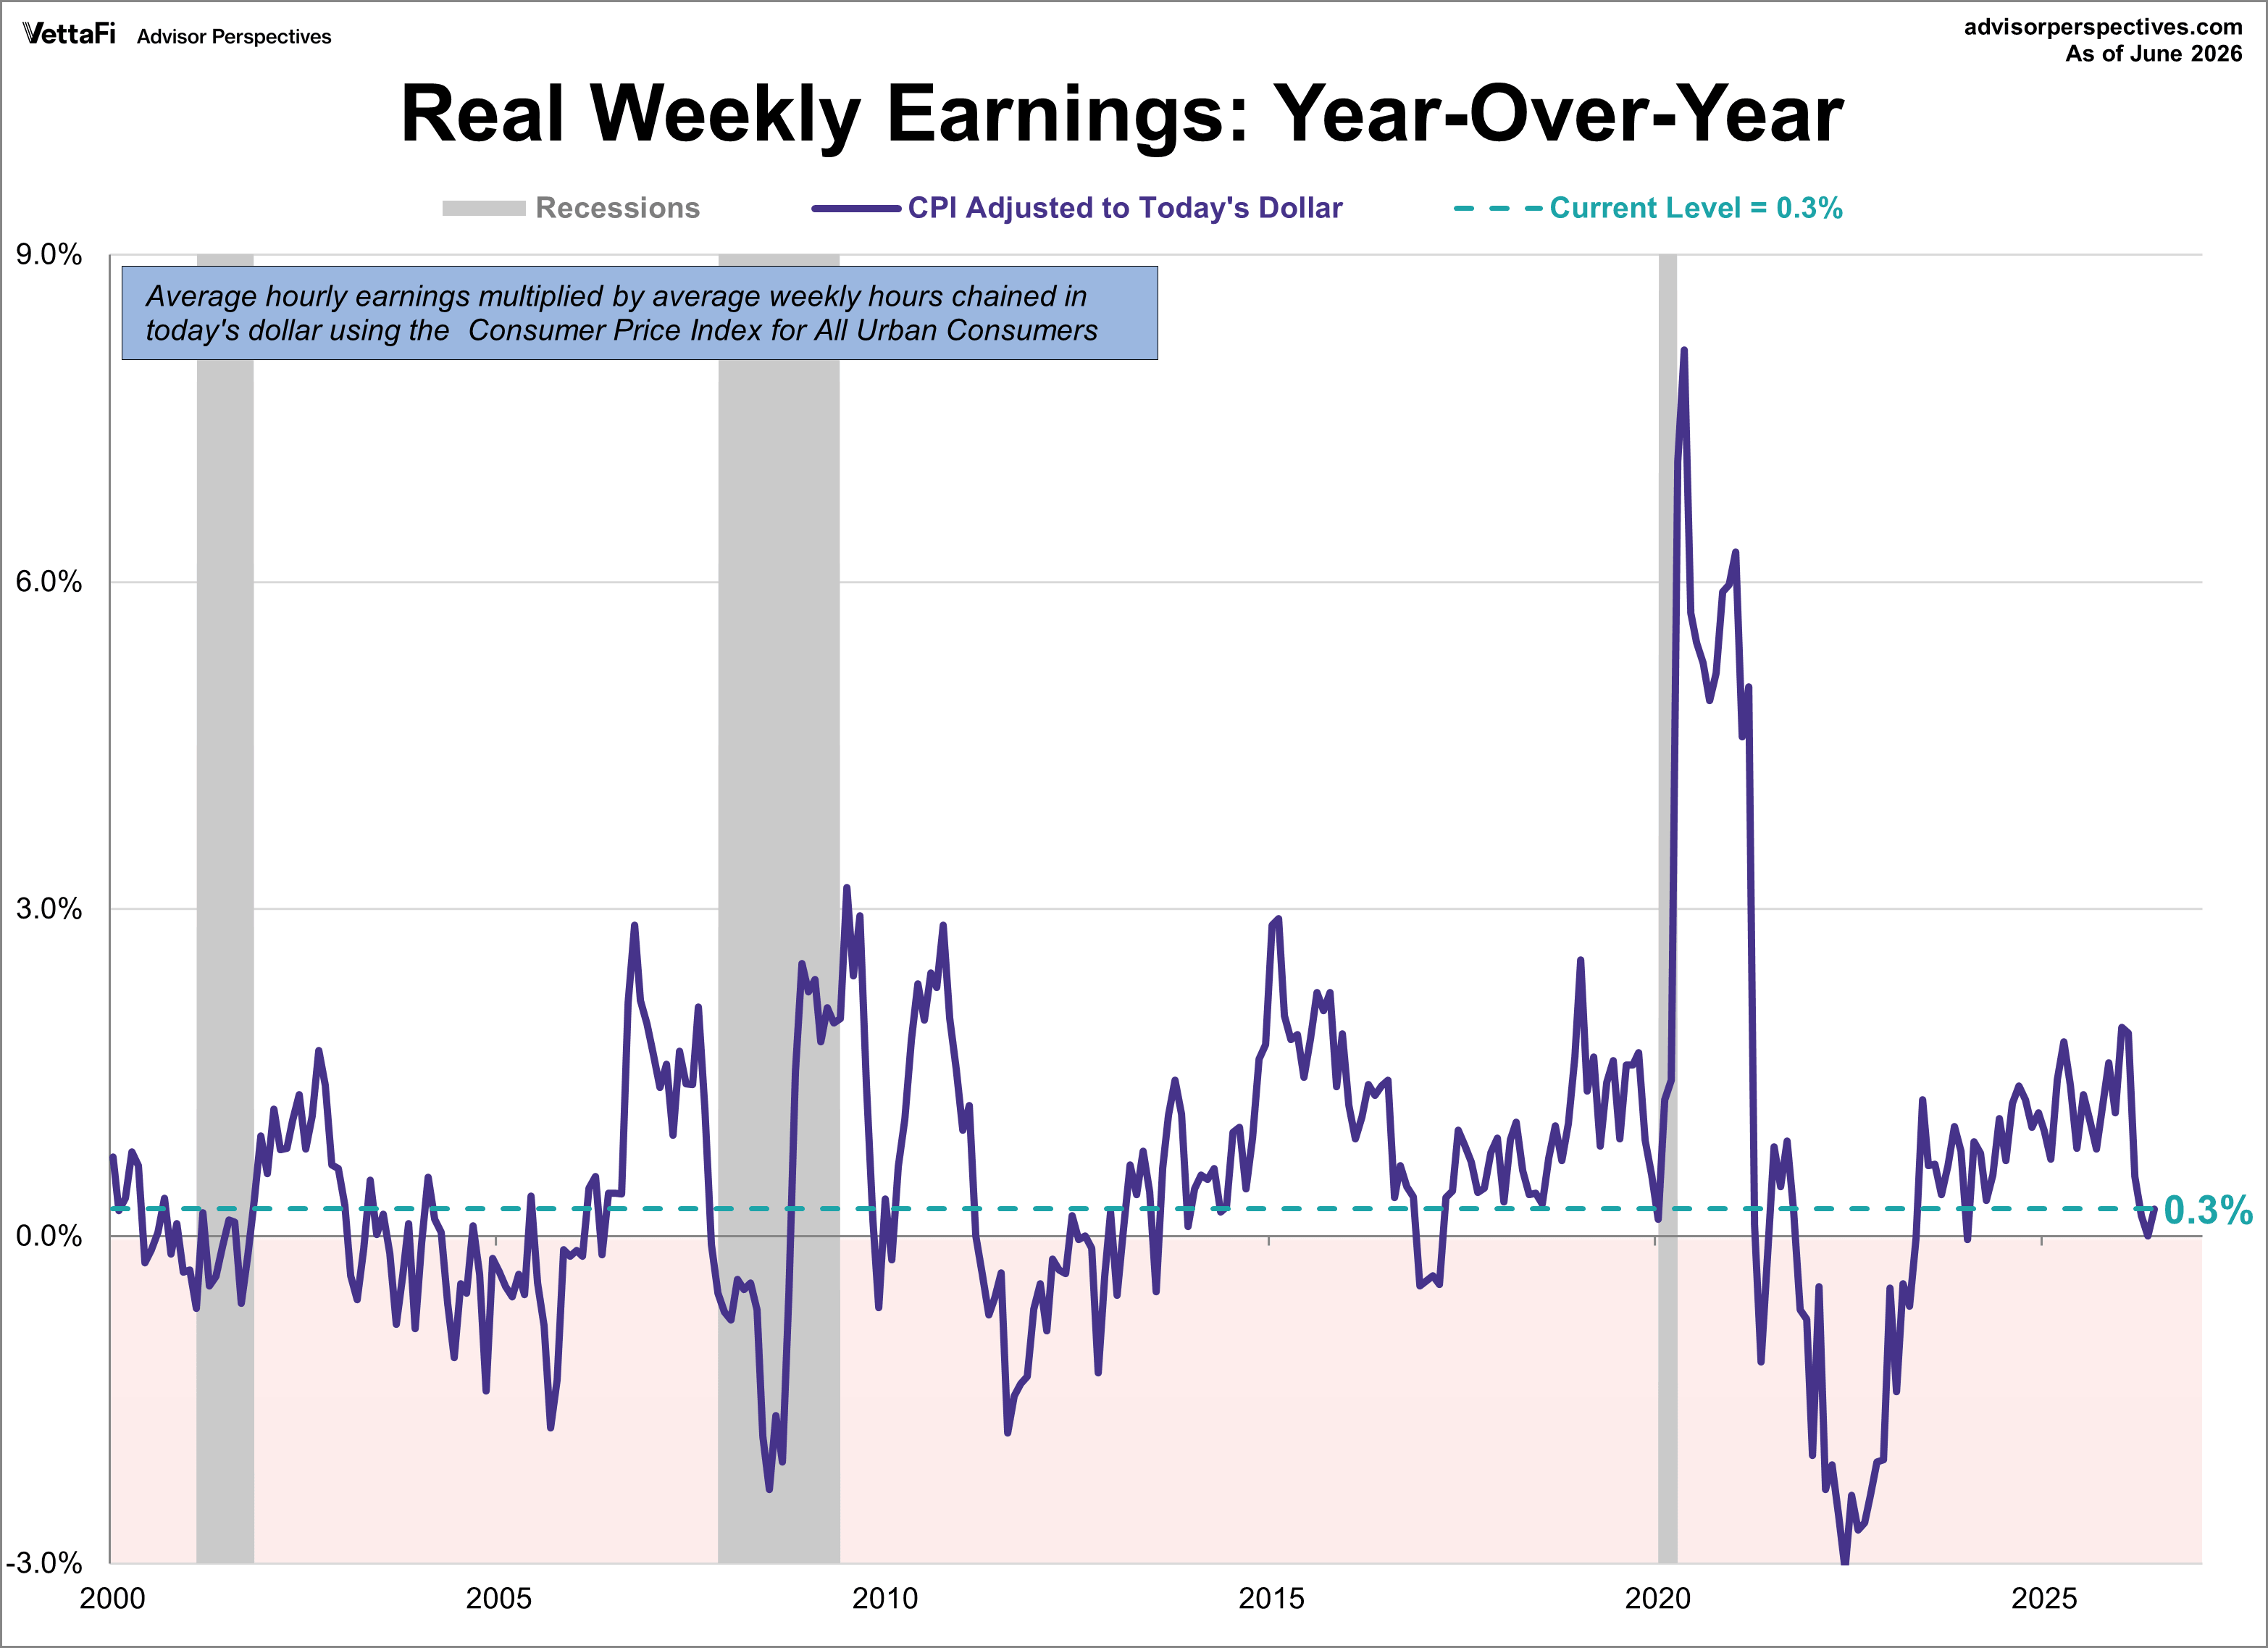
Here's a look at the YoY comparison for the last 20 years.
Latest Hypothetical Annual Earnings
If we multiply the hypothetical weekly earnings by 50, we get an annual figure of $54,560. That's a 5.7% decline from the similarly calculated real peak in October 1972.
Footnote: Here is a slightly different look at the data. I've adjusted using the less familiar CPI for urban wage earners and clerical workers, the CPI-W, which is theoretically a better match for the production and nonsupervisory cohort. The index, among other things, assigns a slightly higher weighting for gasoline (e.g., longer drives to work and the grocery store). Also, this is the series the government uses to calculate the Social Security Cost of Living Adjustments (COLAs).
Here is the real hourly history with this deflator.
Here is the real hourly data multiplied by the average weekly hours. The latest data point is 3.1% below the 1972 peak.
For additional perspectives on earnings, see our commentaries on household income.
Read more updates by Jen Nash