The economic mover and shaker this week is Friday's employment report from the Bureau of Labor Statistics. This monthly report contains a wealth of data for economists, the most publicized being the month-over-month change in Total Nonfarm Employment. However, each month a few days before we receive the highly anticipated jobs report, ADP releases their data on new nonfarm private jobs.
Key Takeaways
-
The ADP employment report showed nonfarm private jobs increased by 98,000 in June.
-
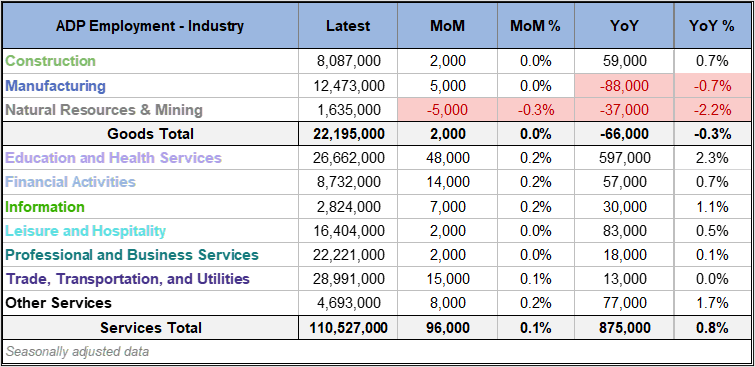
Education and Health Services gained 48,000 jobs in June, representing the largest sector growth.
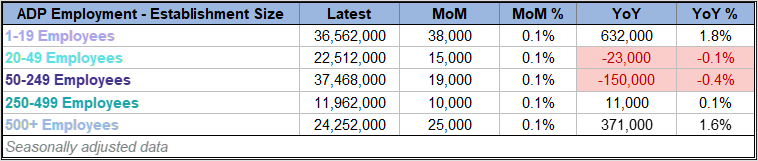
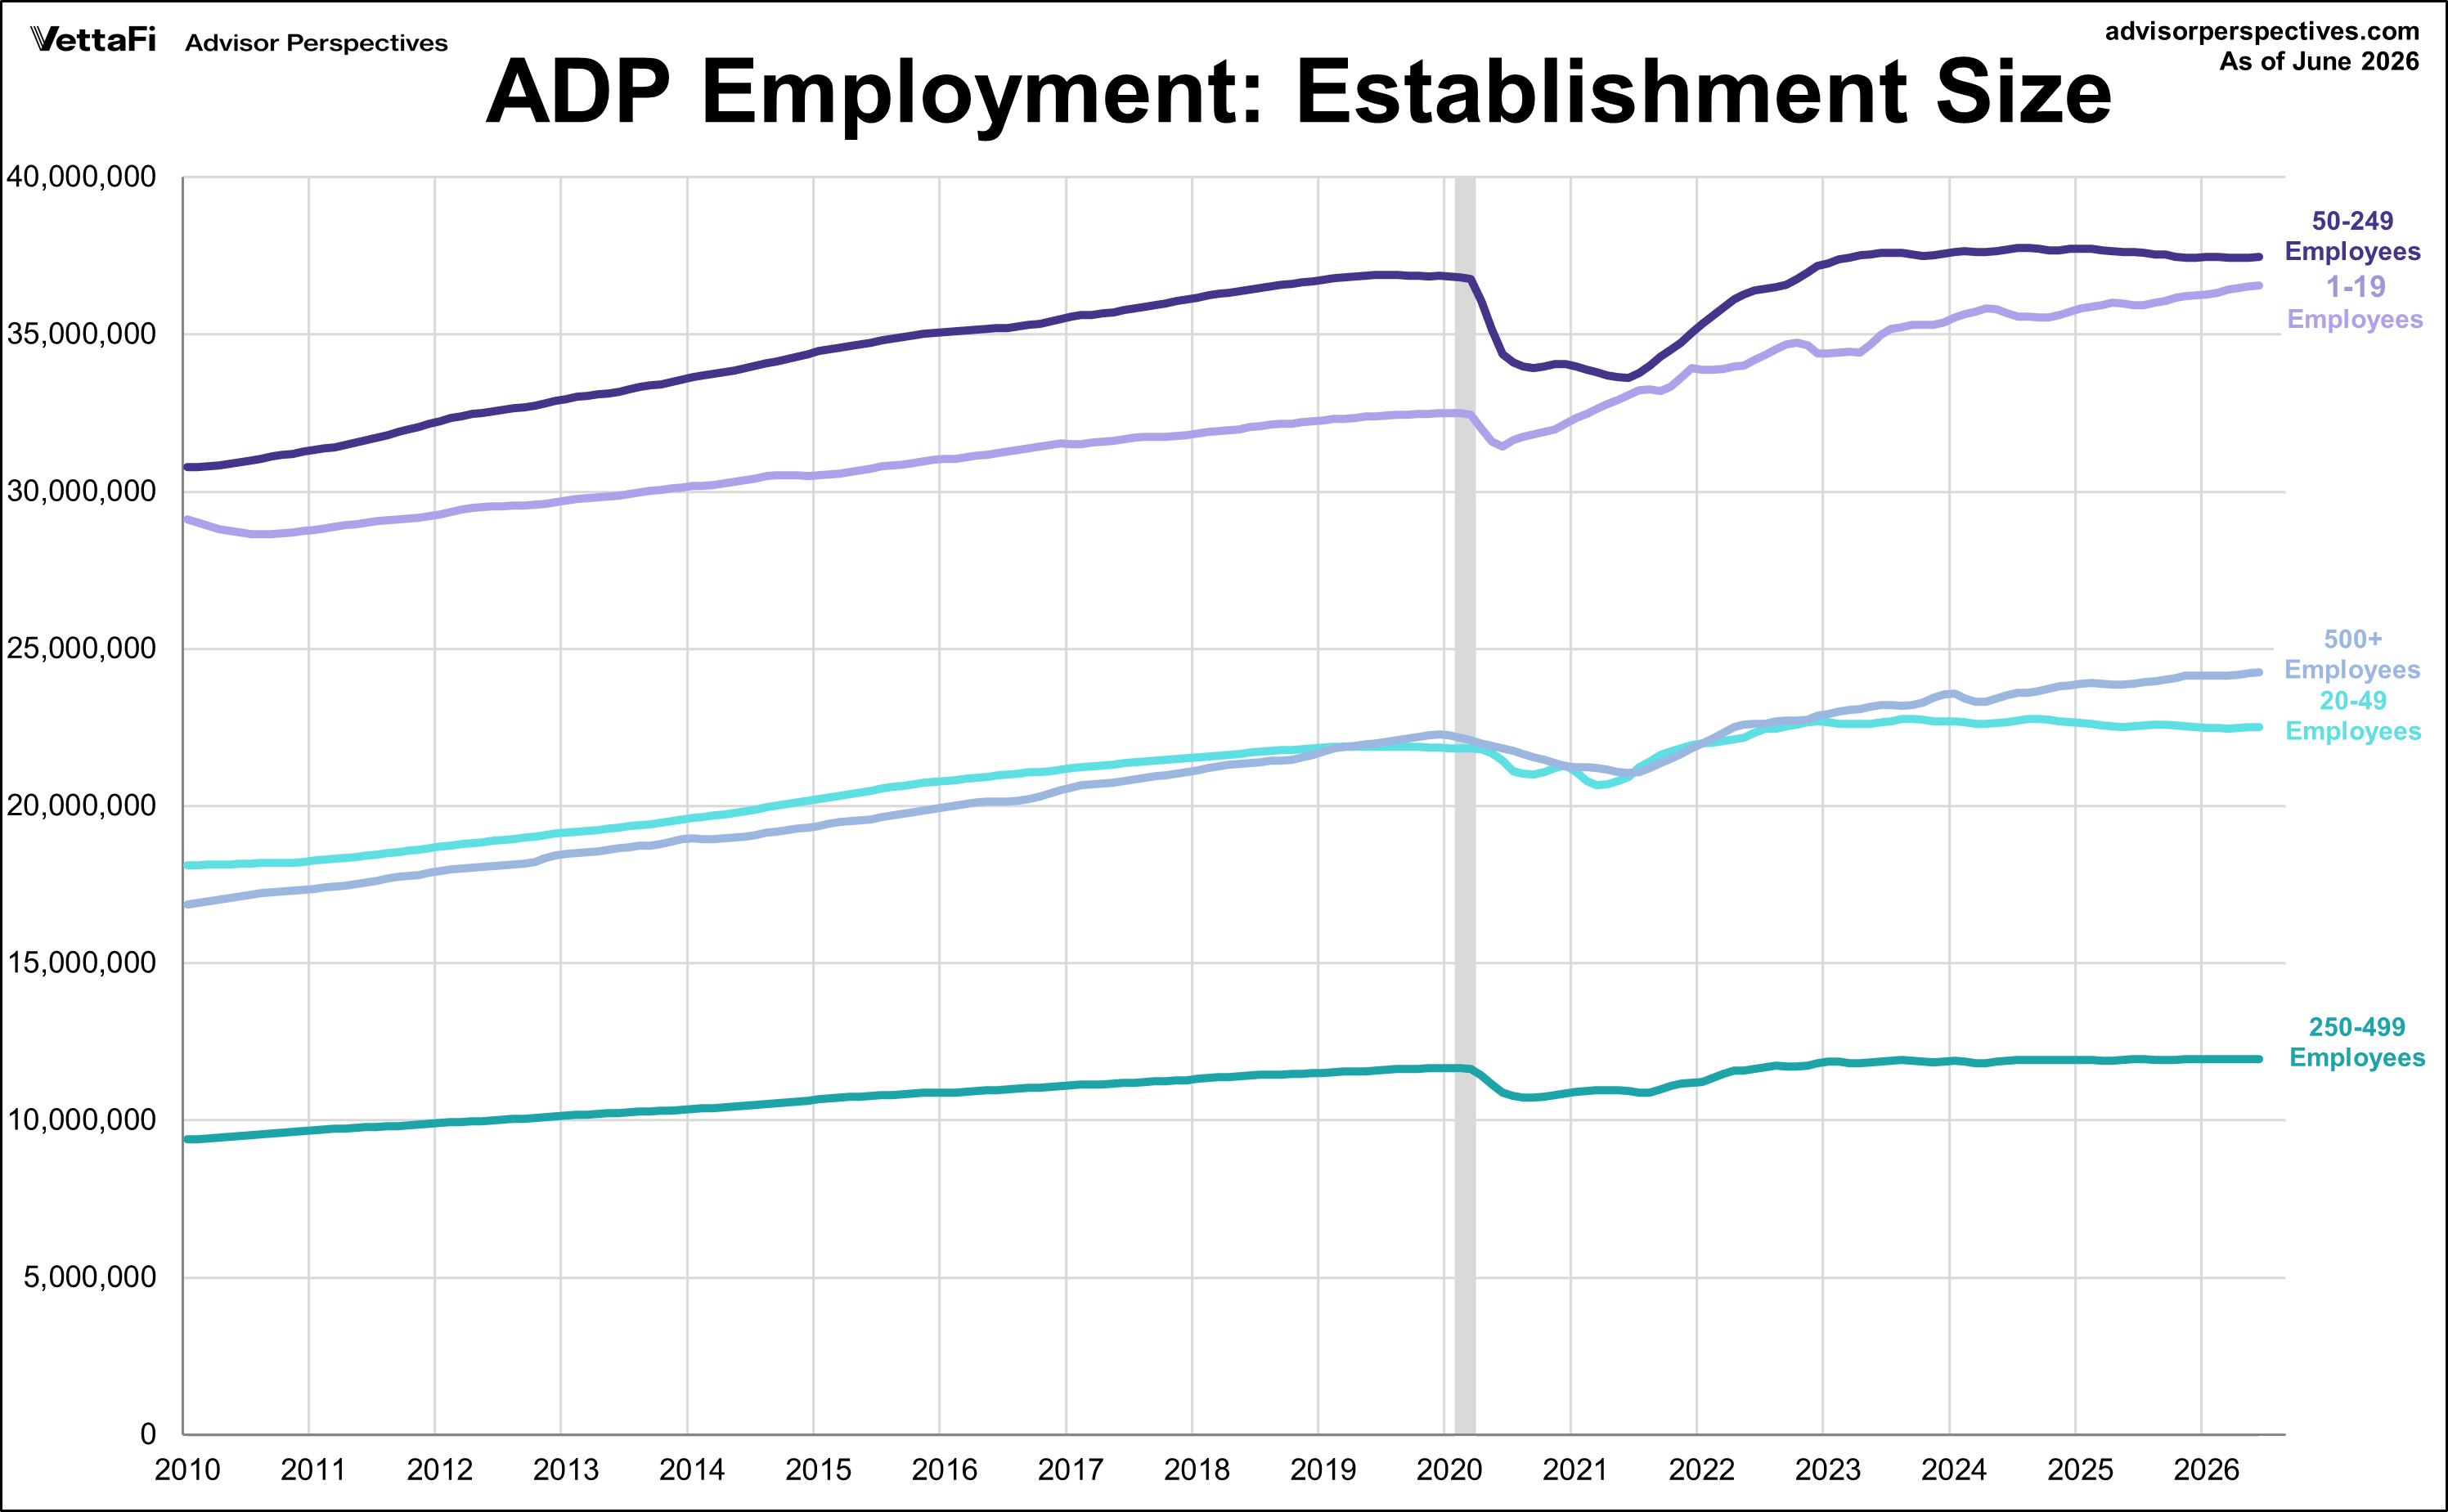
- Small establishments with 1-19 employees added 38,000 private jobs, the highest growth among all company sizes.
The ADP employment report revealed that 98,000 nonfarm private jobs were added in June, the twelfth straight month of growth. However, the latest figure was below the projected 118,000 addition.
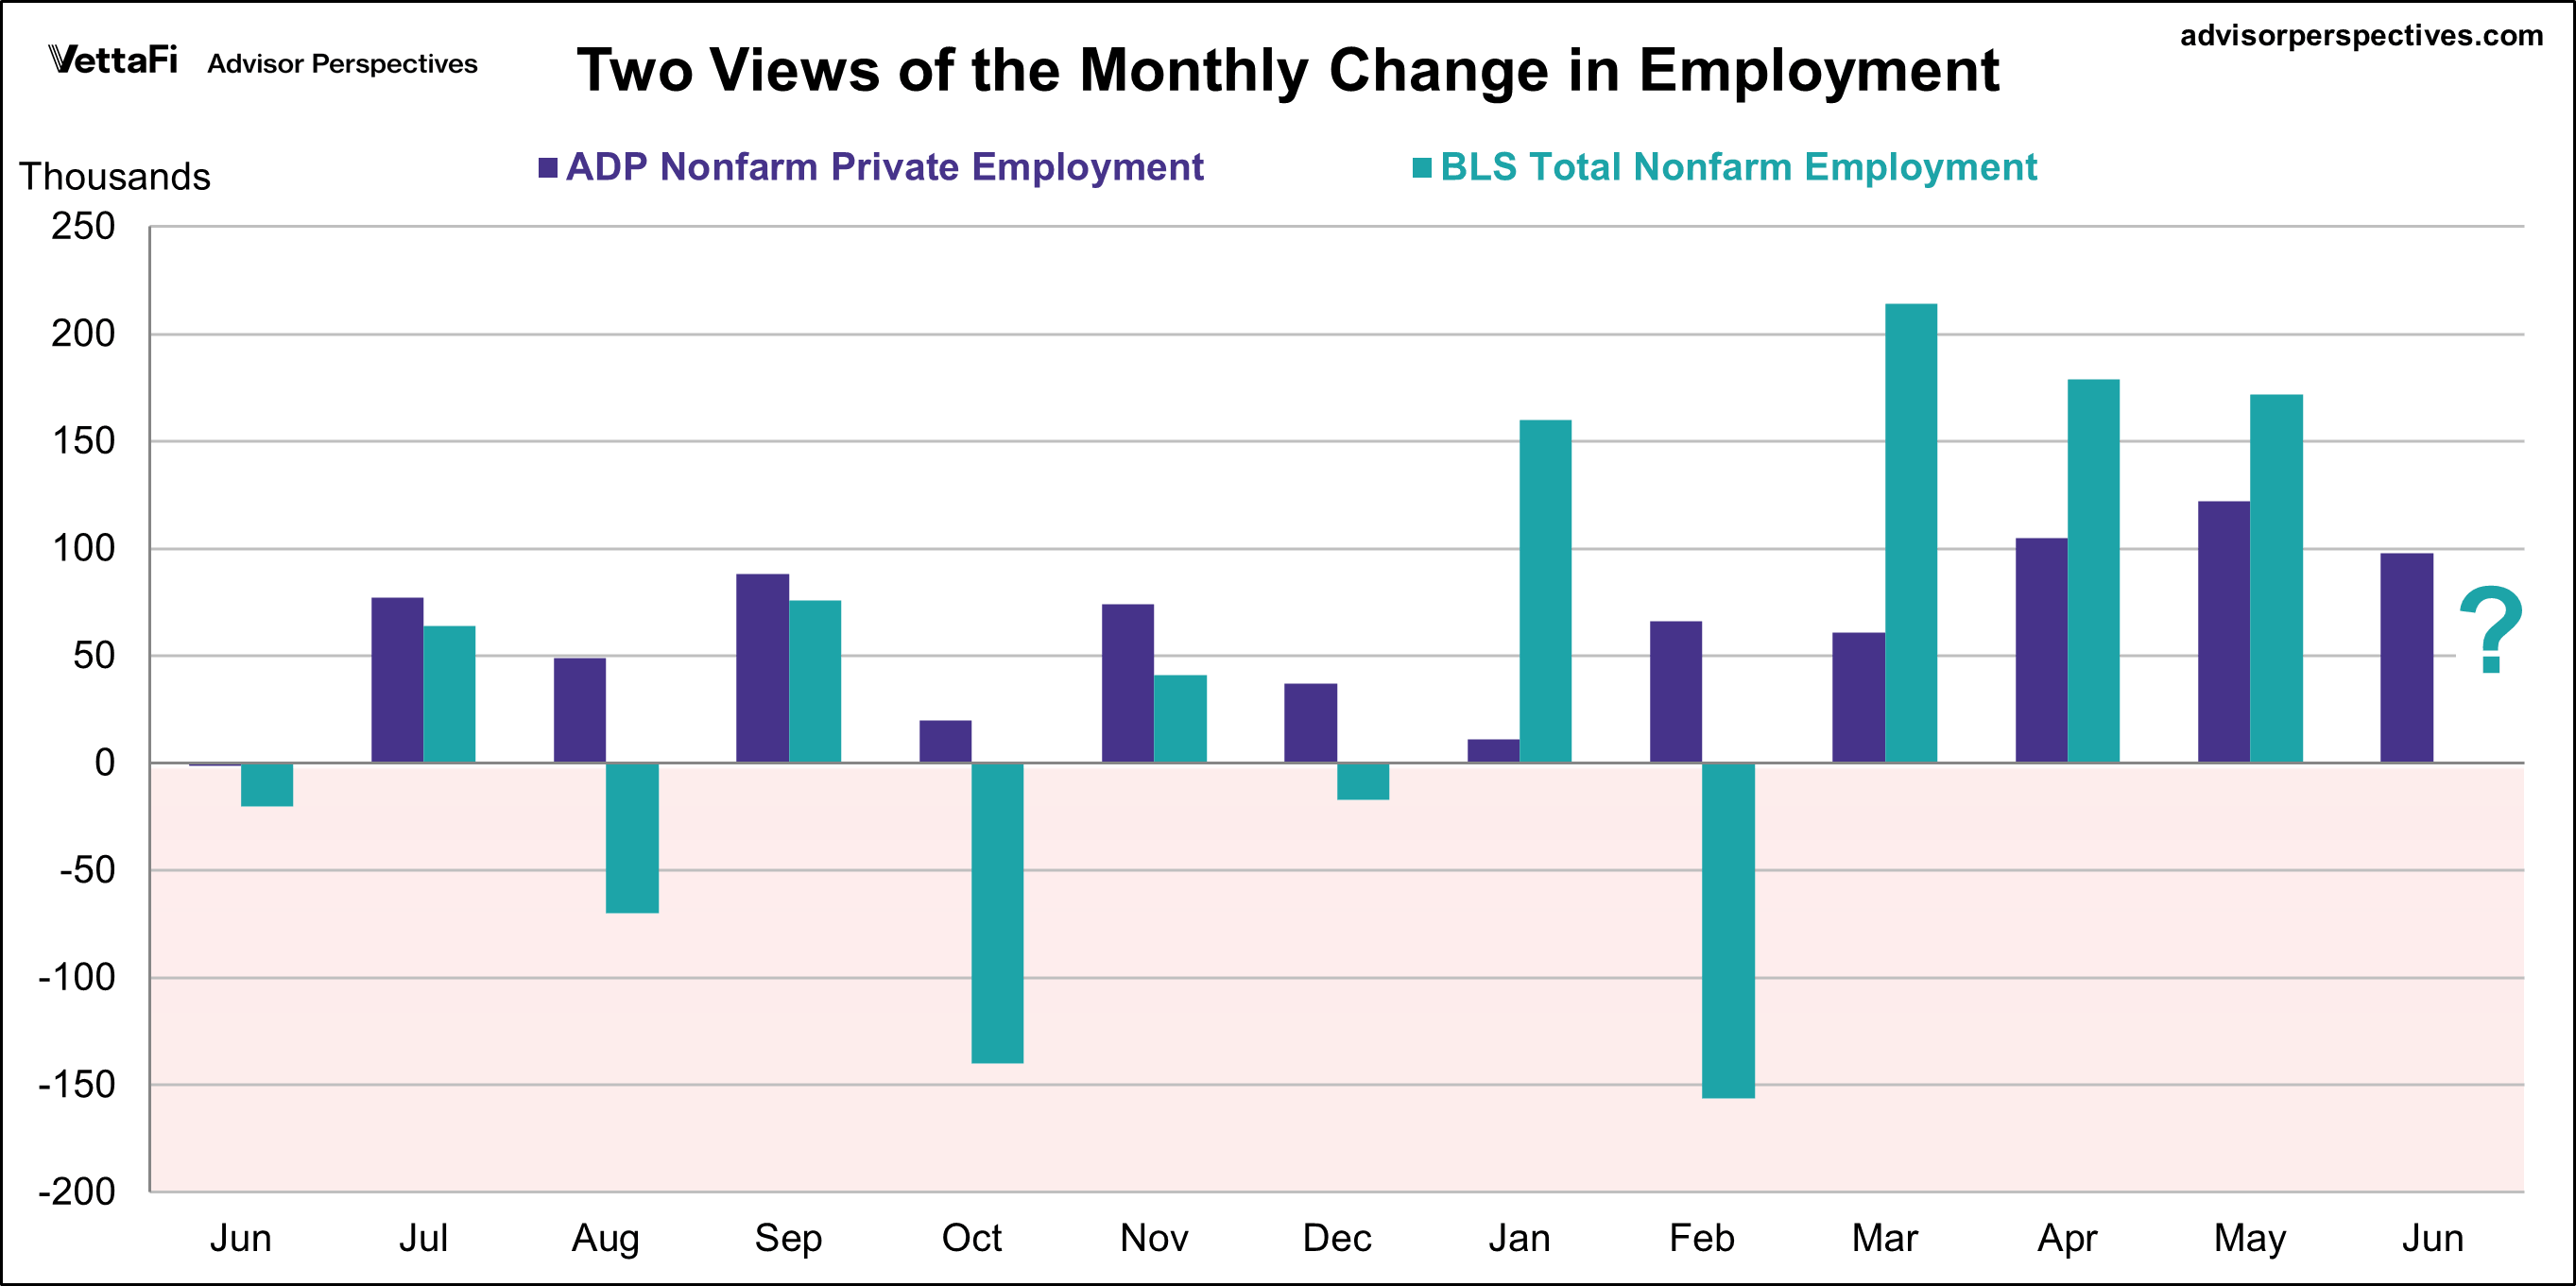
Here is a visualization of the two series over the past twelve months. There is no correlation between the ADP and BLS employment report.
Here is an excerpt from today's ADP report press release:
Job creation was uneven in June. Financial activities and information were among the gainers, while leisure and hospitality delivered a sixth month of weak hiring.
"The pace of hiring is telling a story of both supply and demand. We know it's taking people longer to find work, but there also are signs of labor supply constraints in certain industries. For now, the overall effect is a slowdown in job creation."
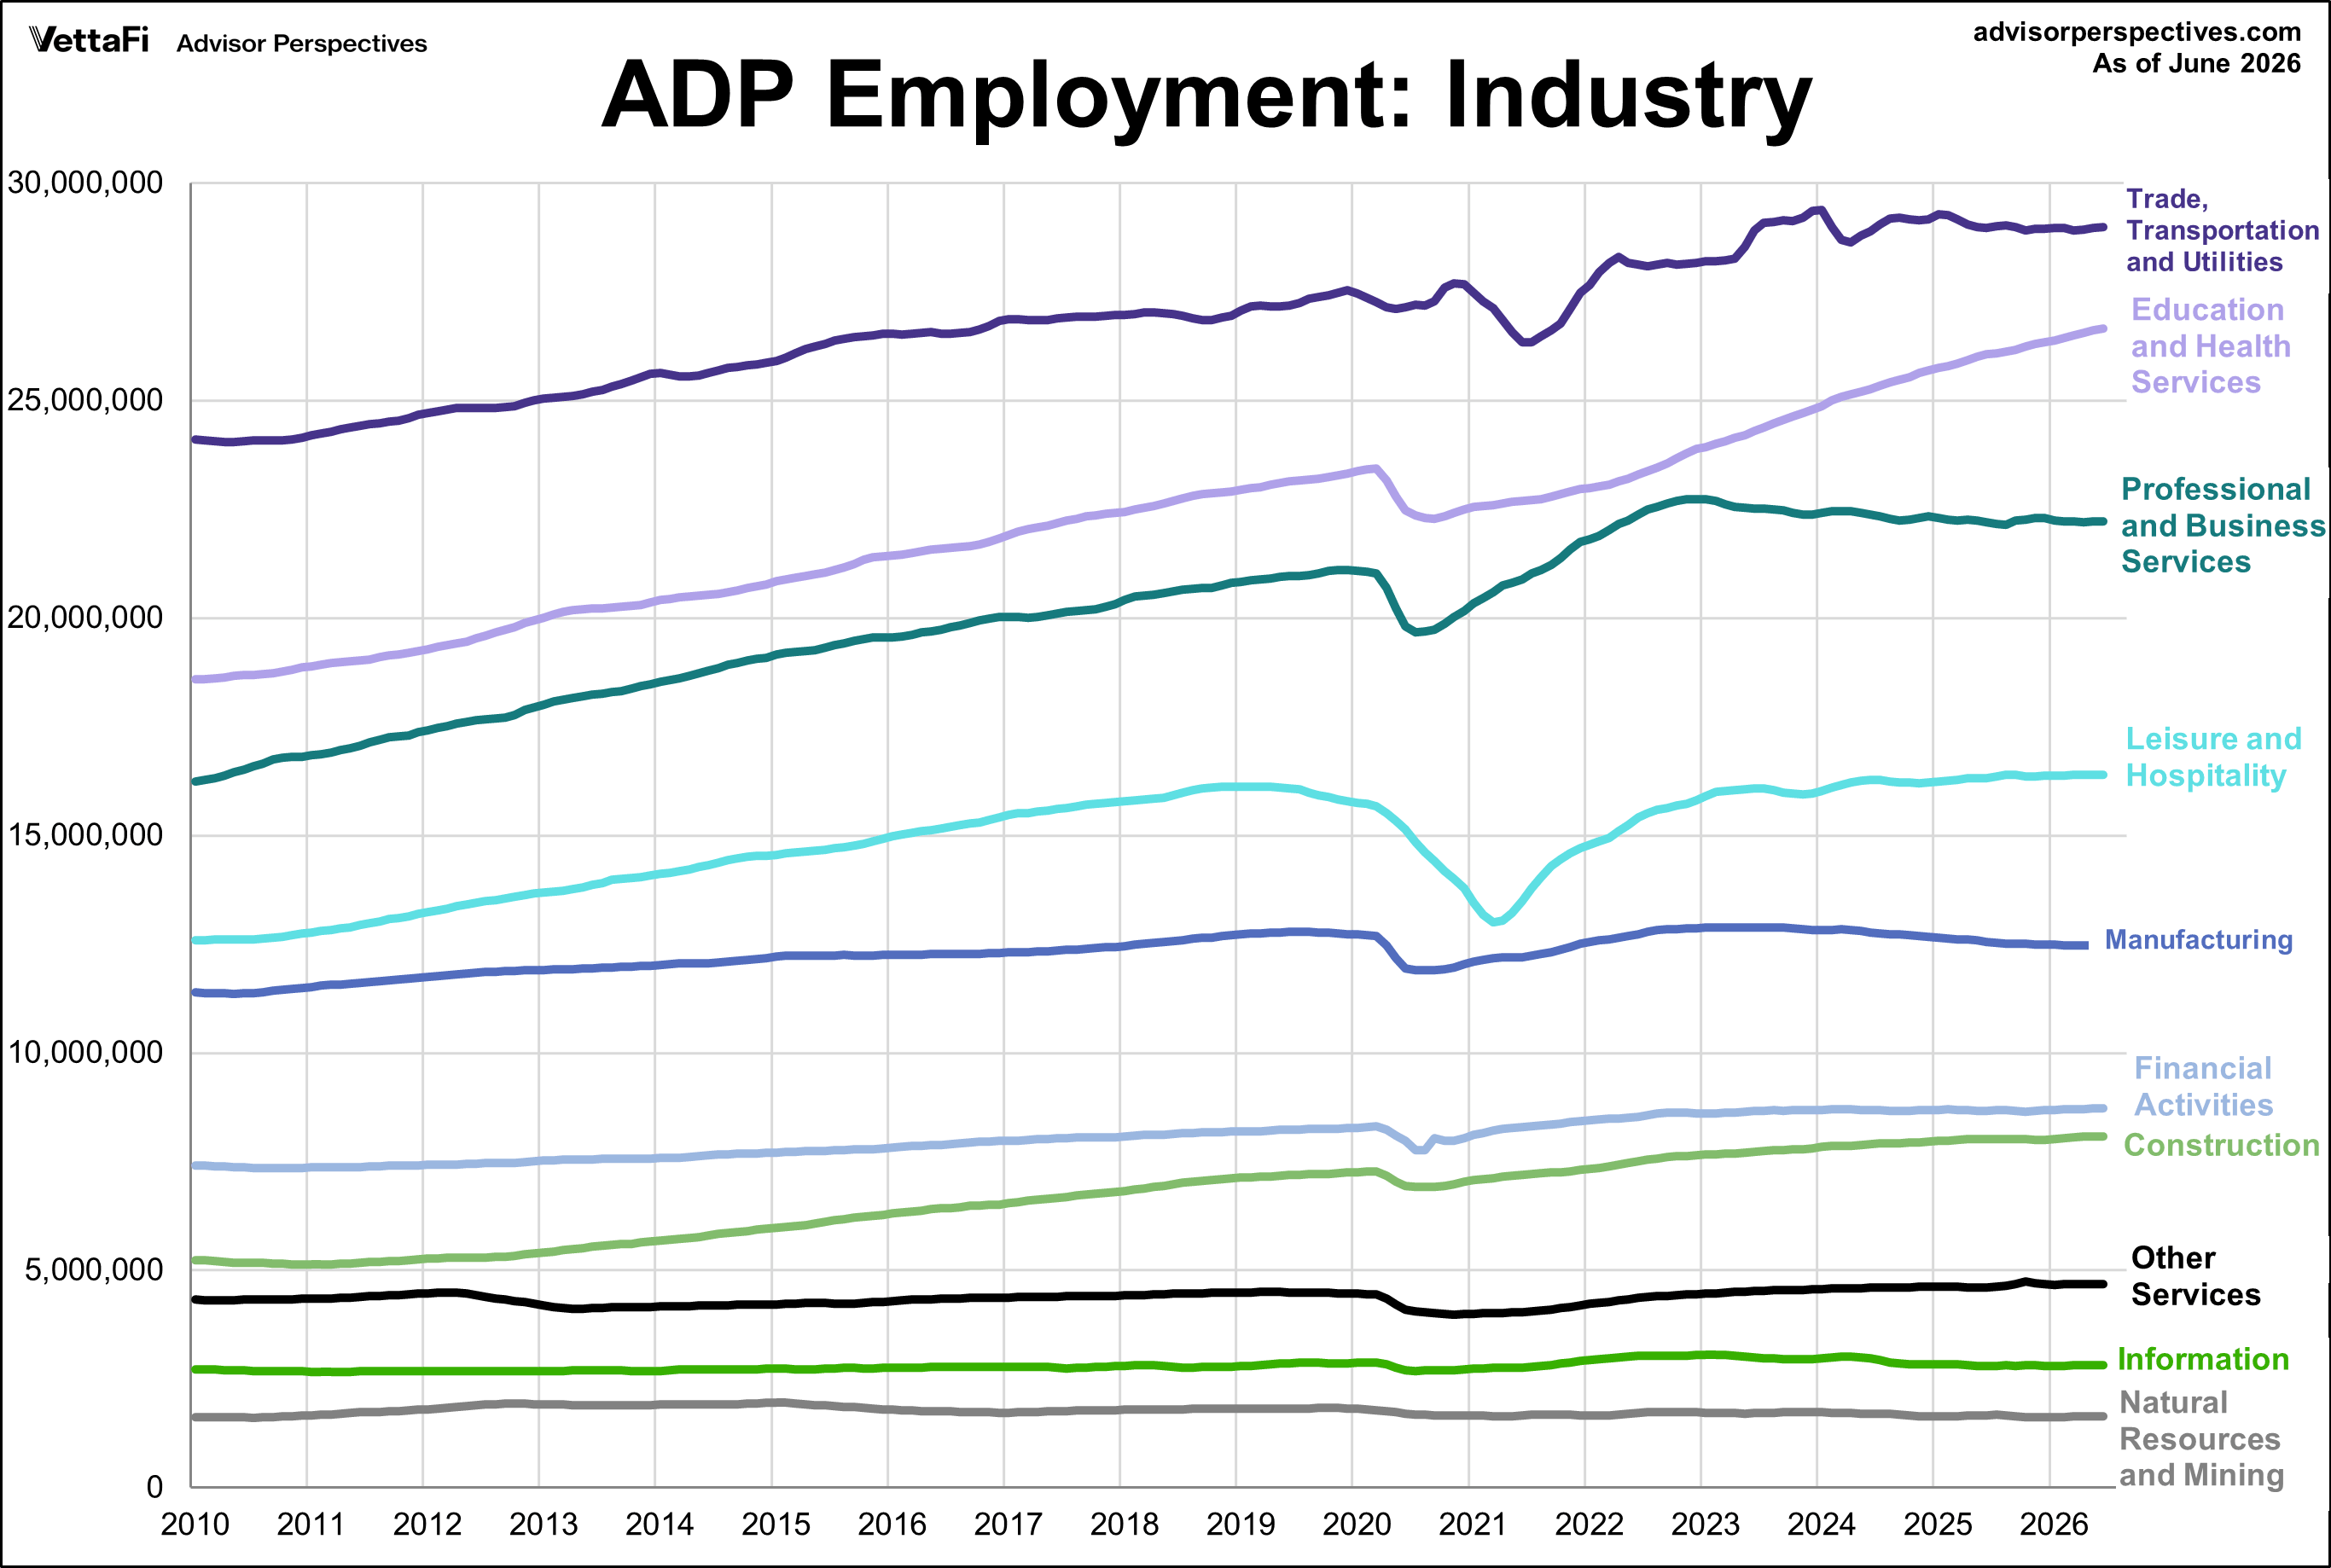
Here is a snapshot of the monthly change in the ADP headline number since the company's earliest published data with the new methodology in 2010. This is quite a volatile series, so we've plotted the monthly data points as dots along with a six-month moving average, which gives us a clearer sense of the trend. The six-month moving average currently sits at 77,000, the highest level since late 2024.
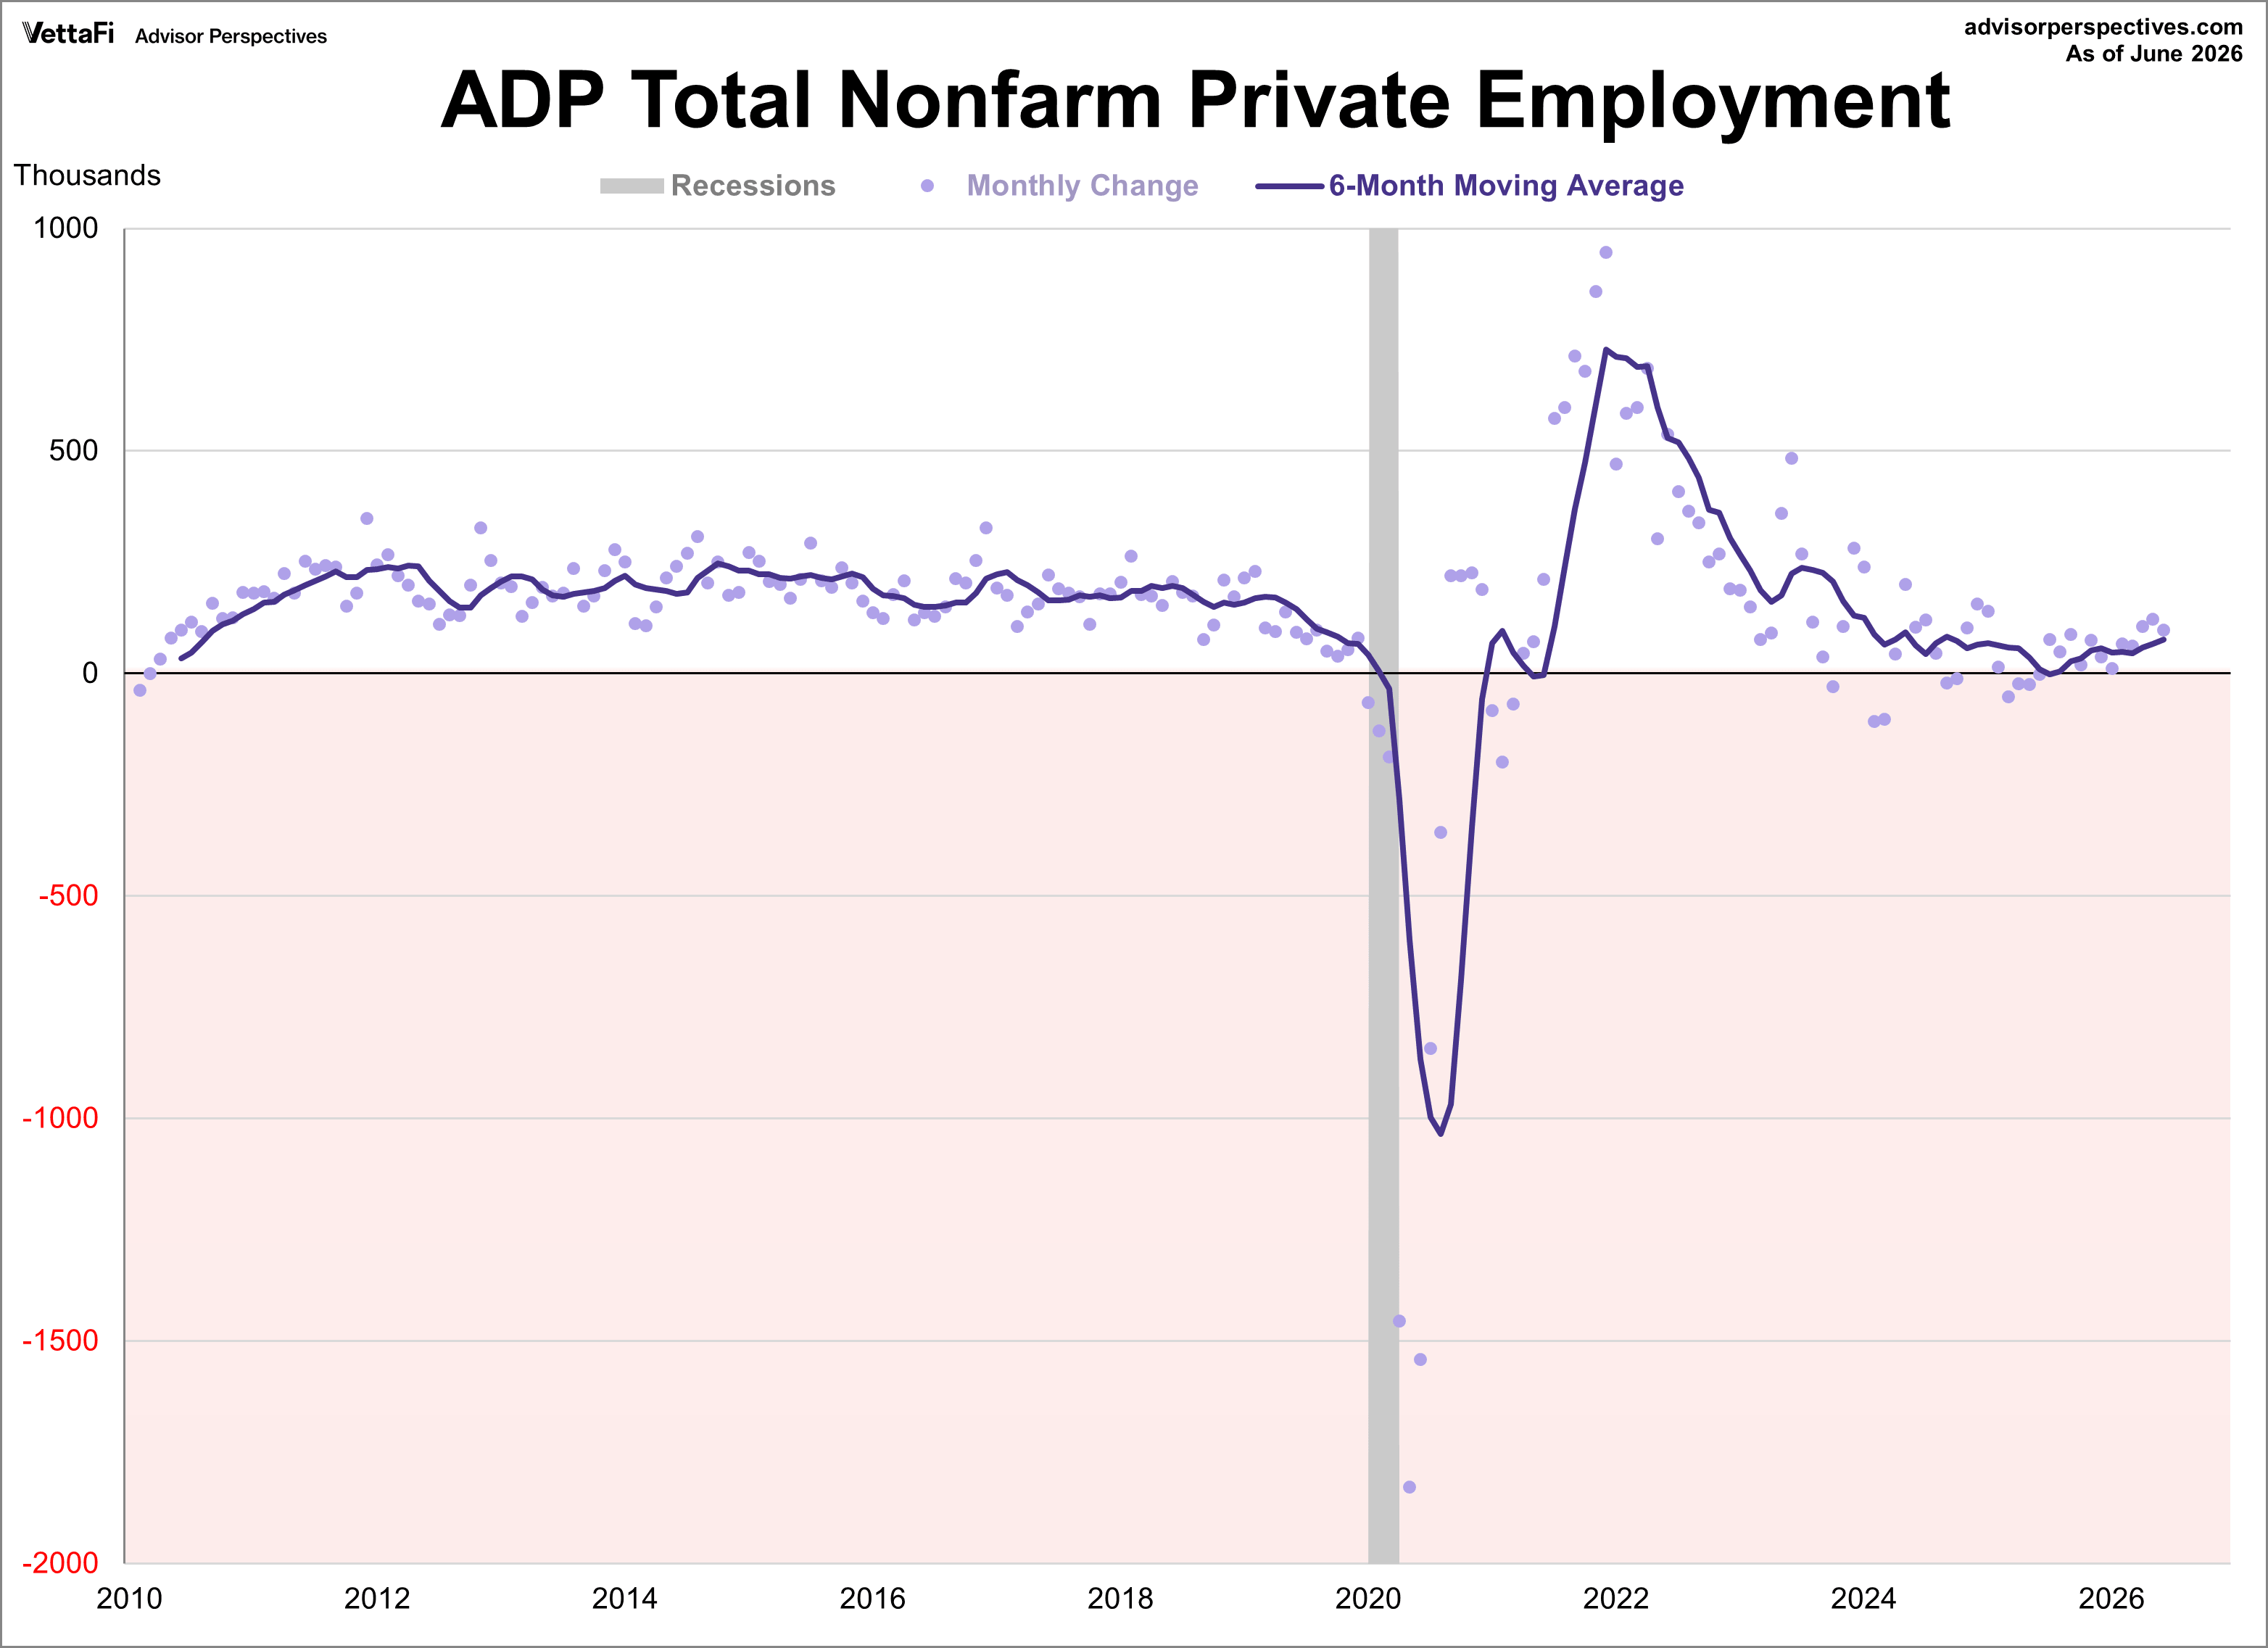 As we see in the chart above, the trend peaked in September 2015 and then went negative for the first time in late 2019, just before the NBER declared a recession start. The COVID-19 pandemic has brought employment numbers down to levels we have never seen this century. The trend reached a new high in 2021 at 728,000 but has dropped below pre-pandemic levels over the last few years.