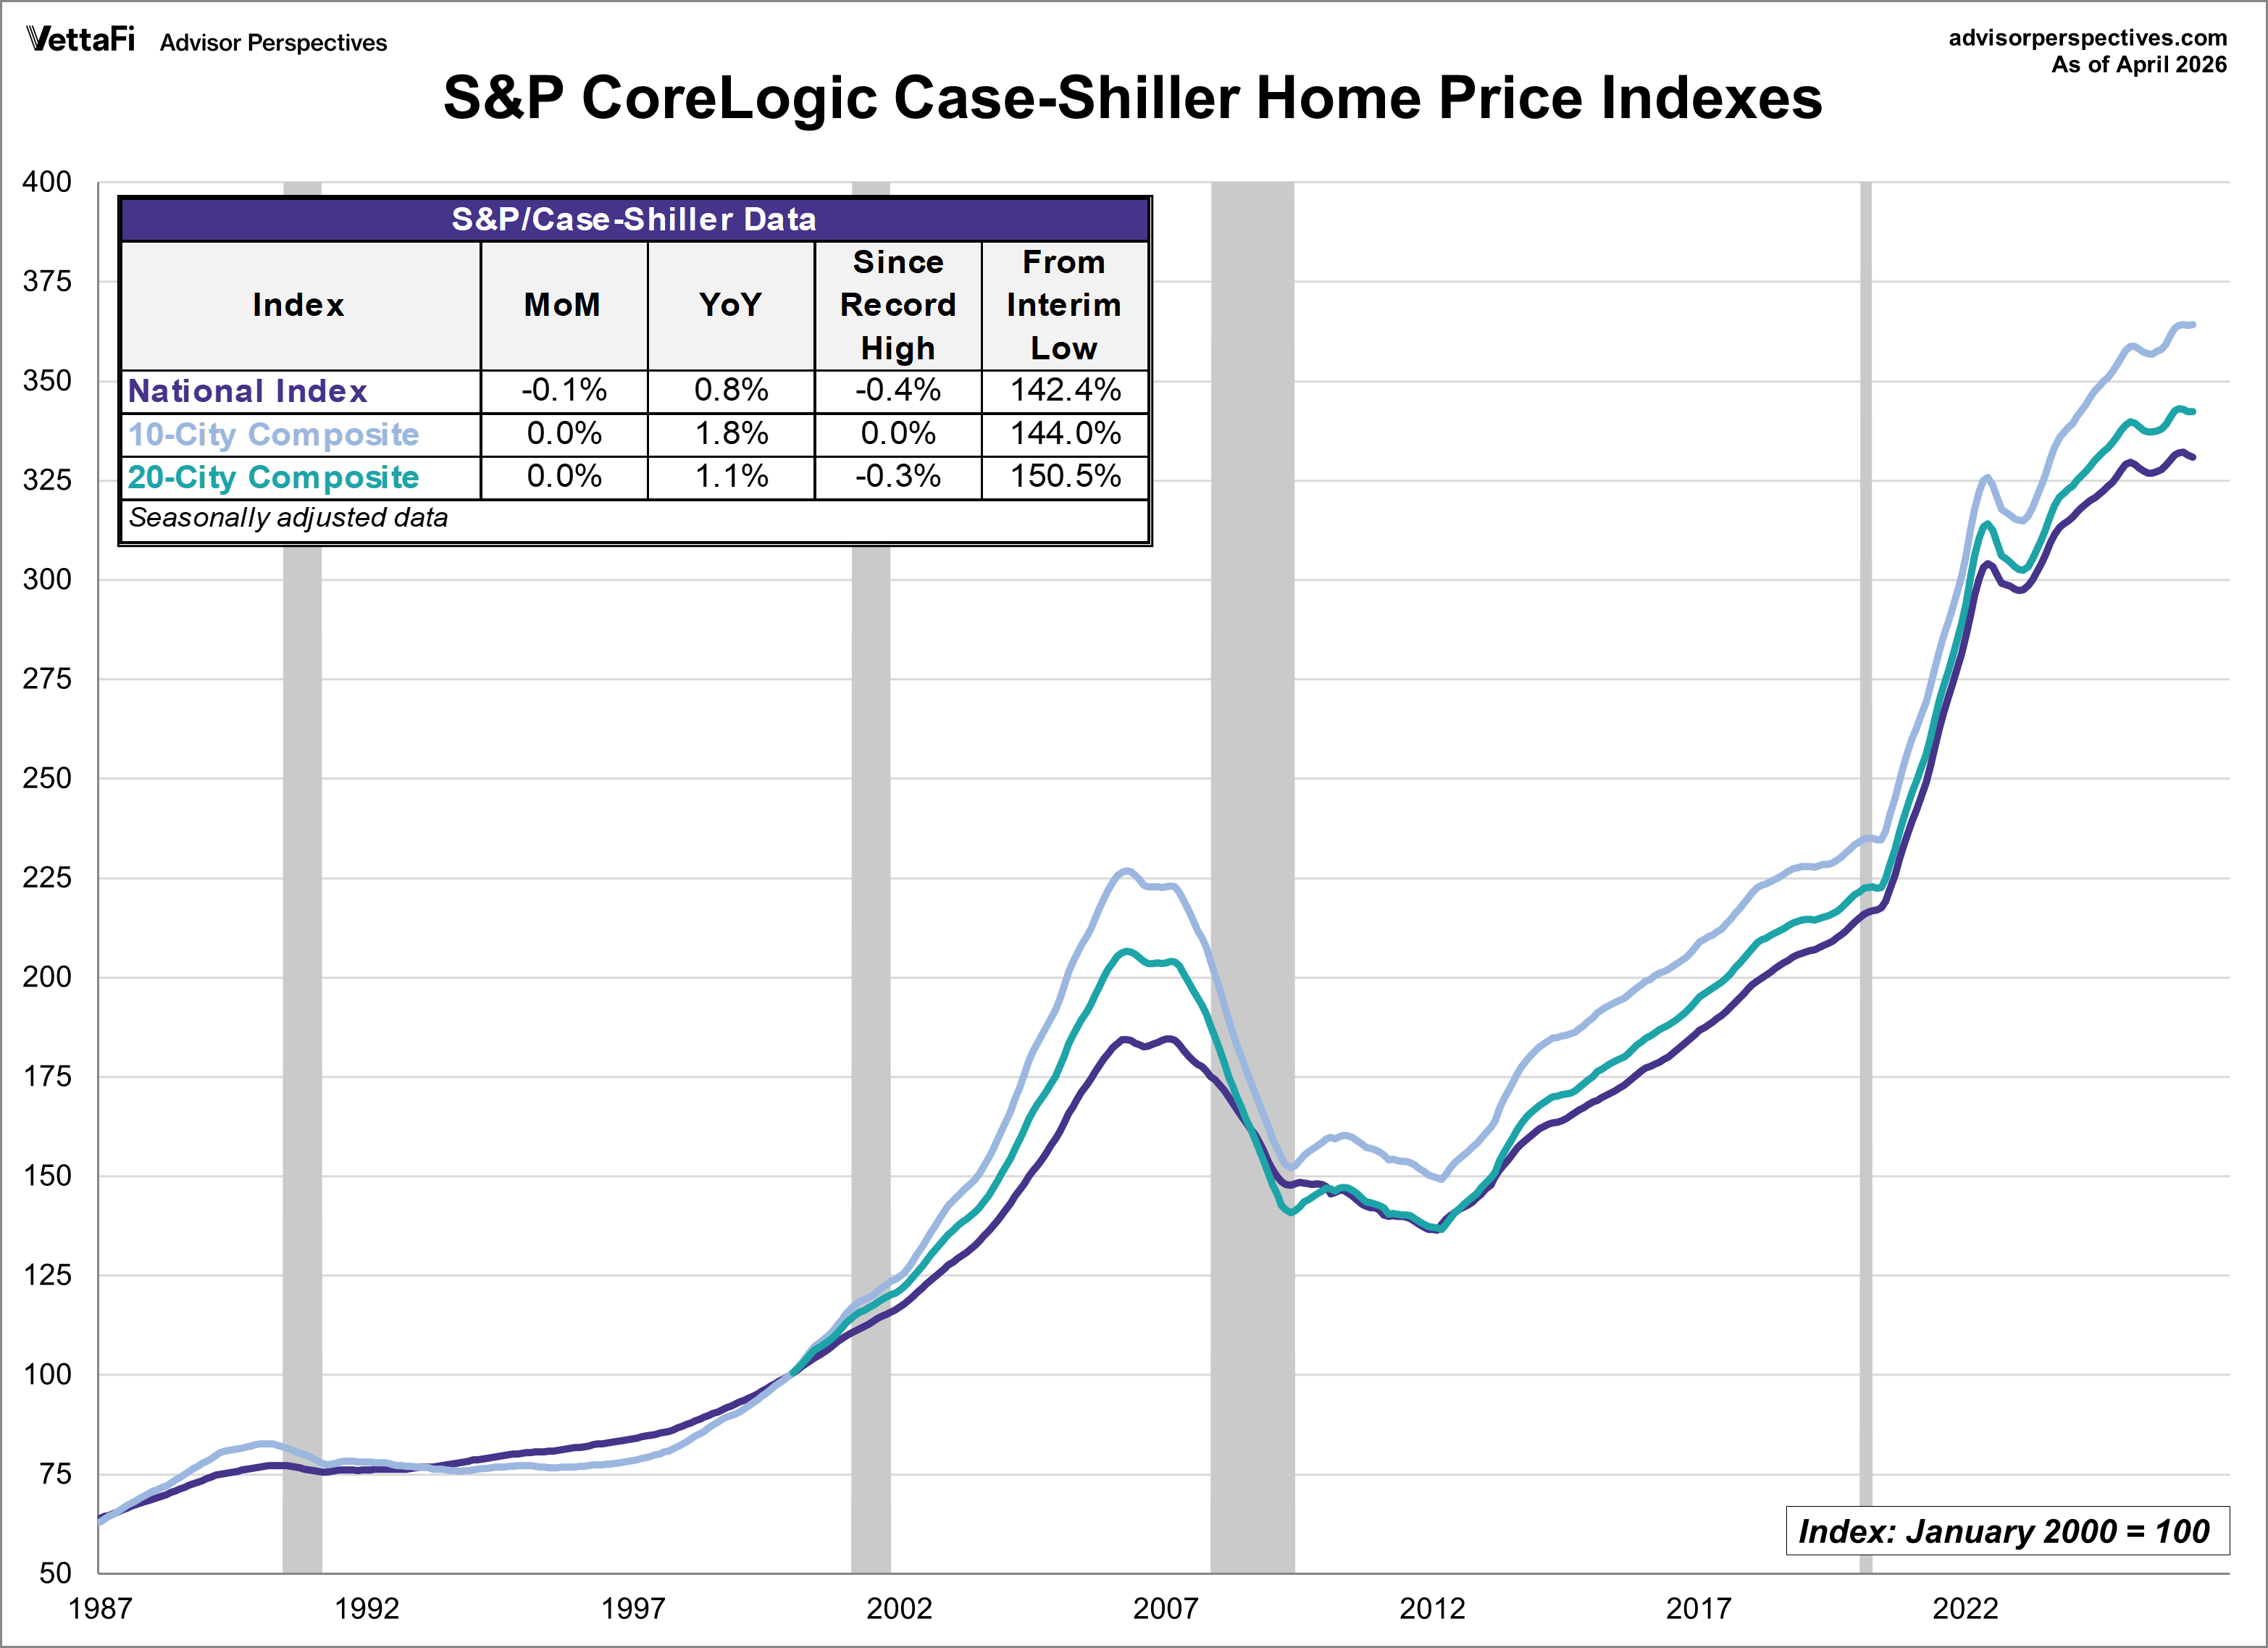
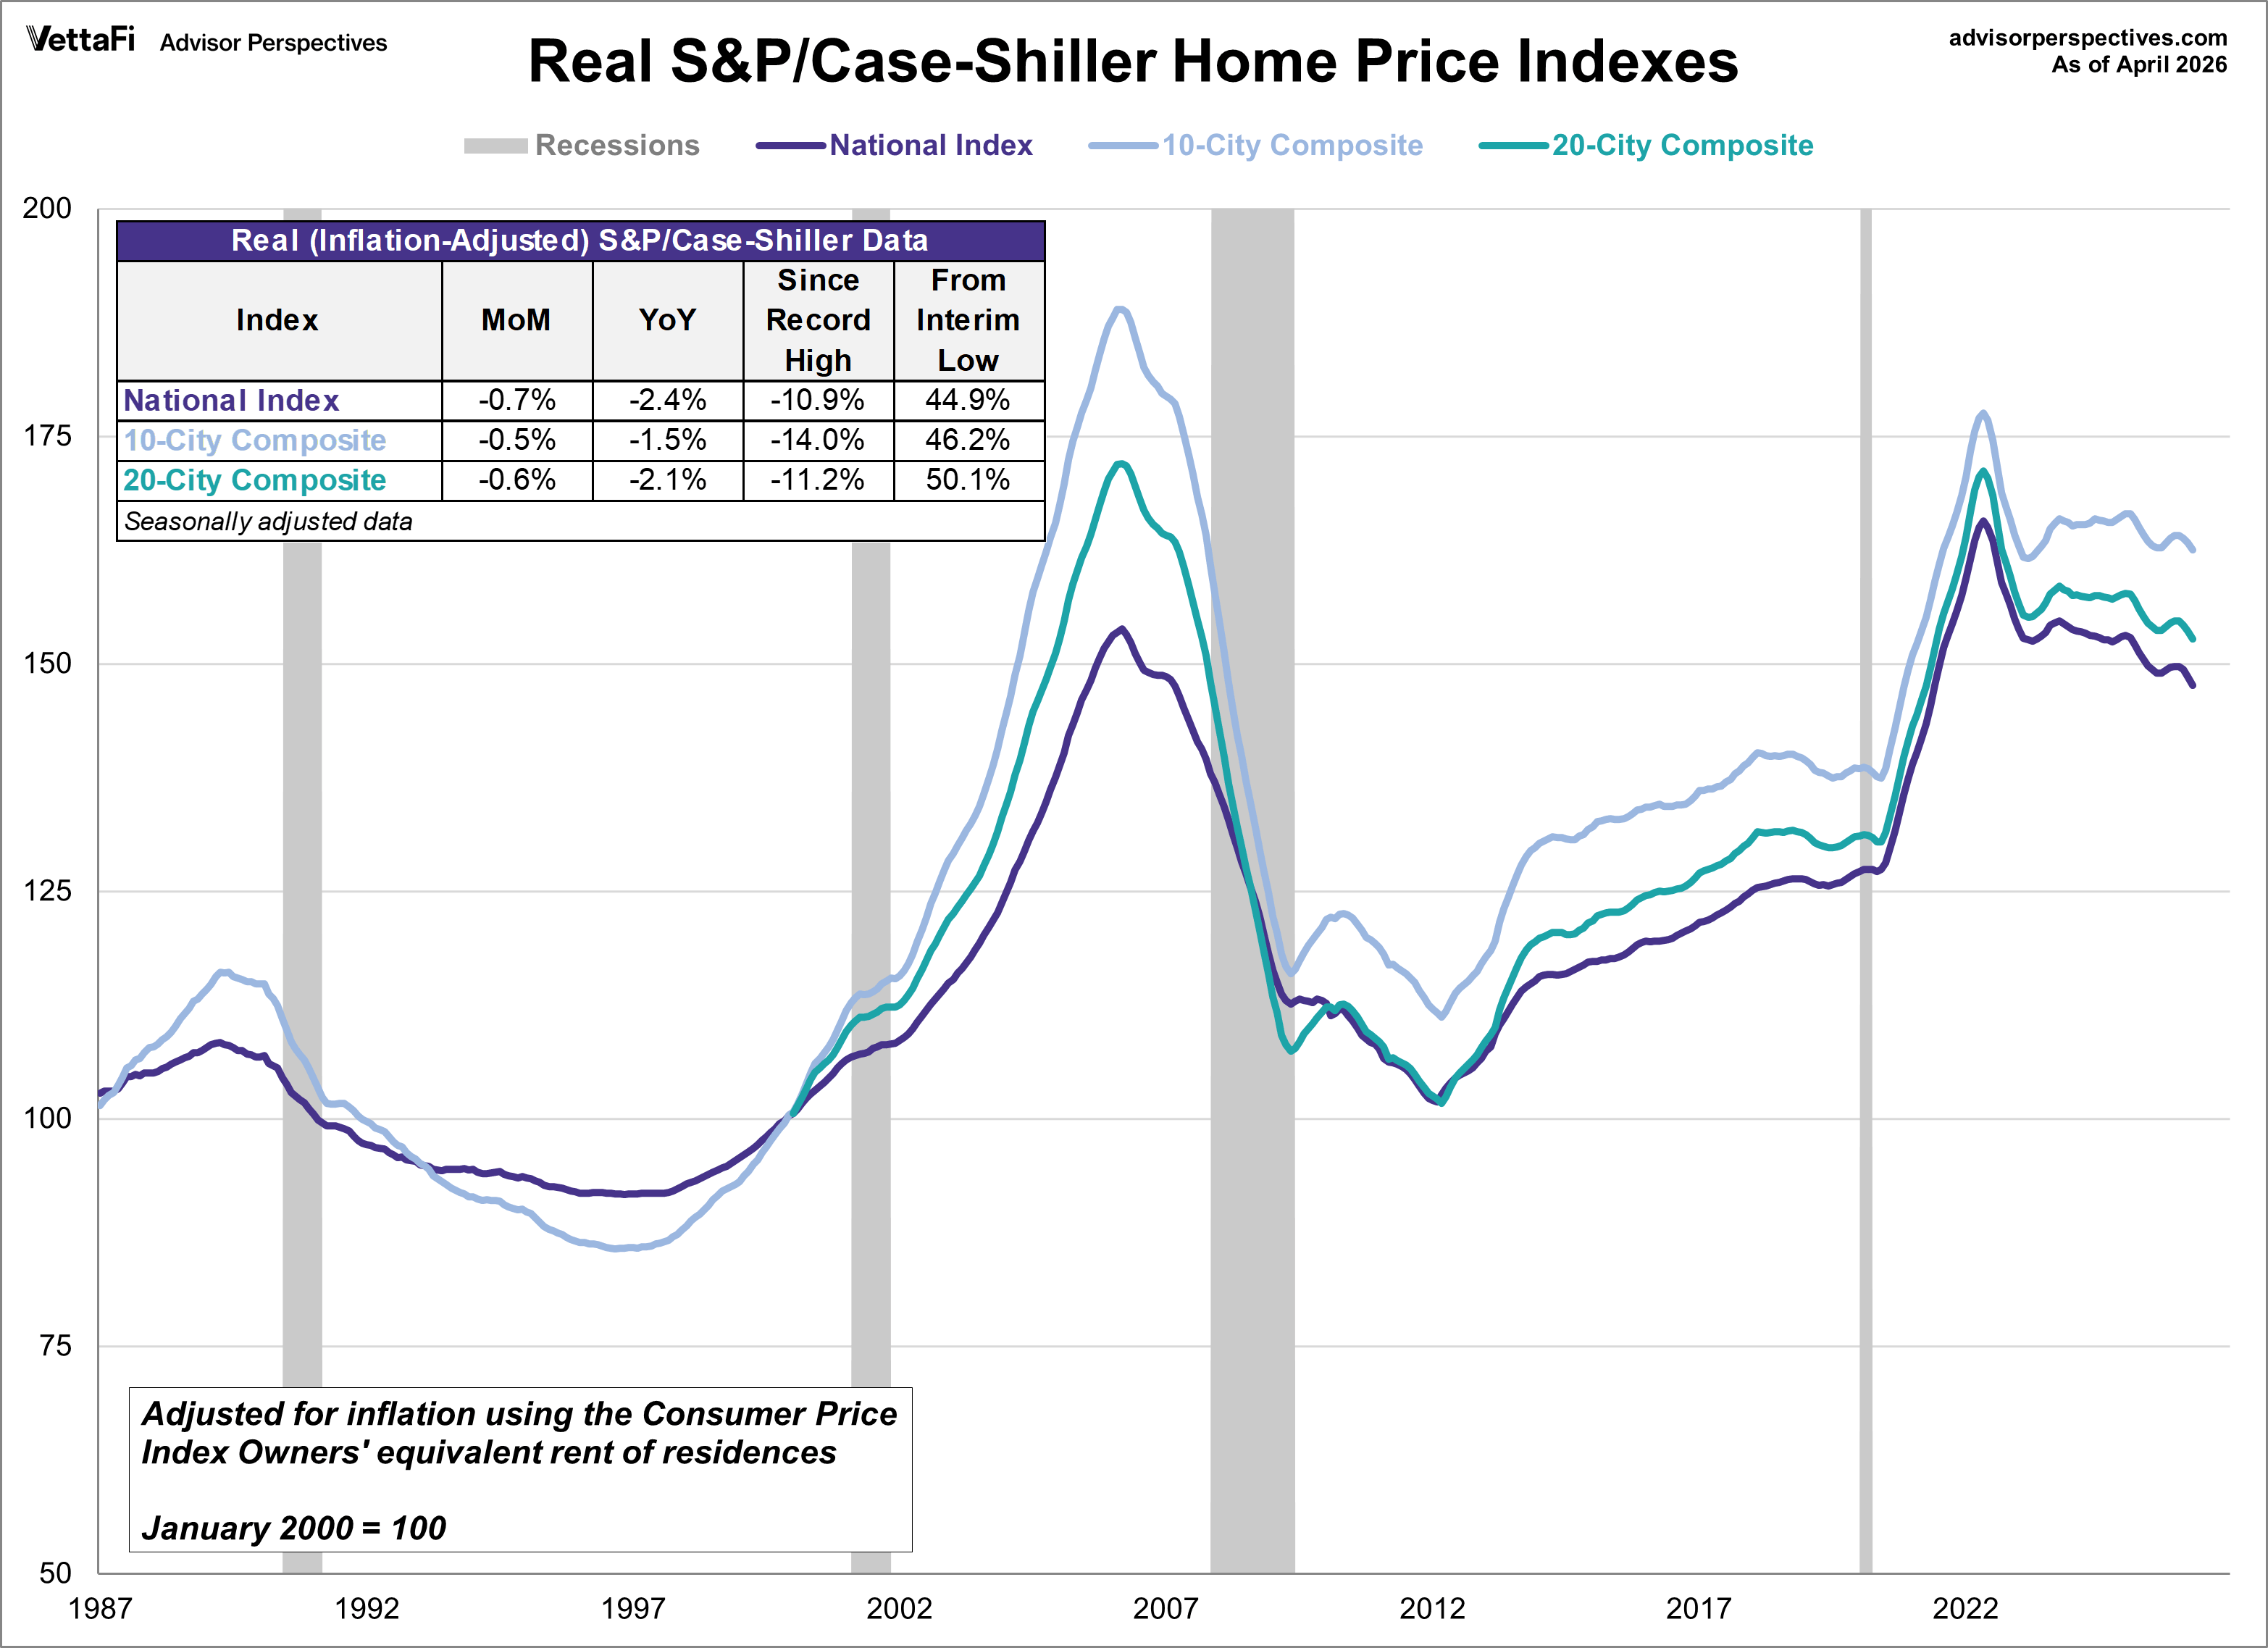
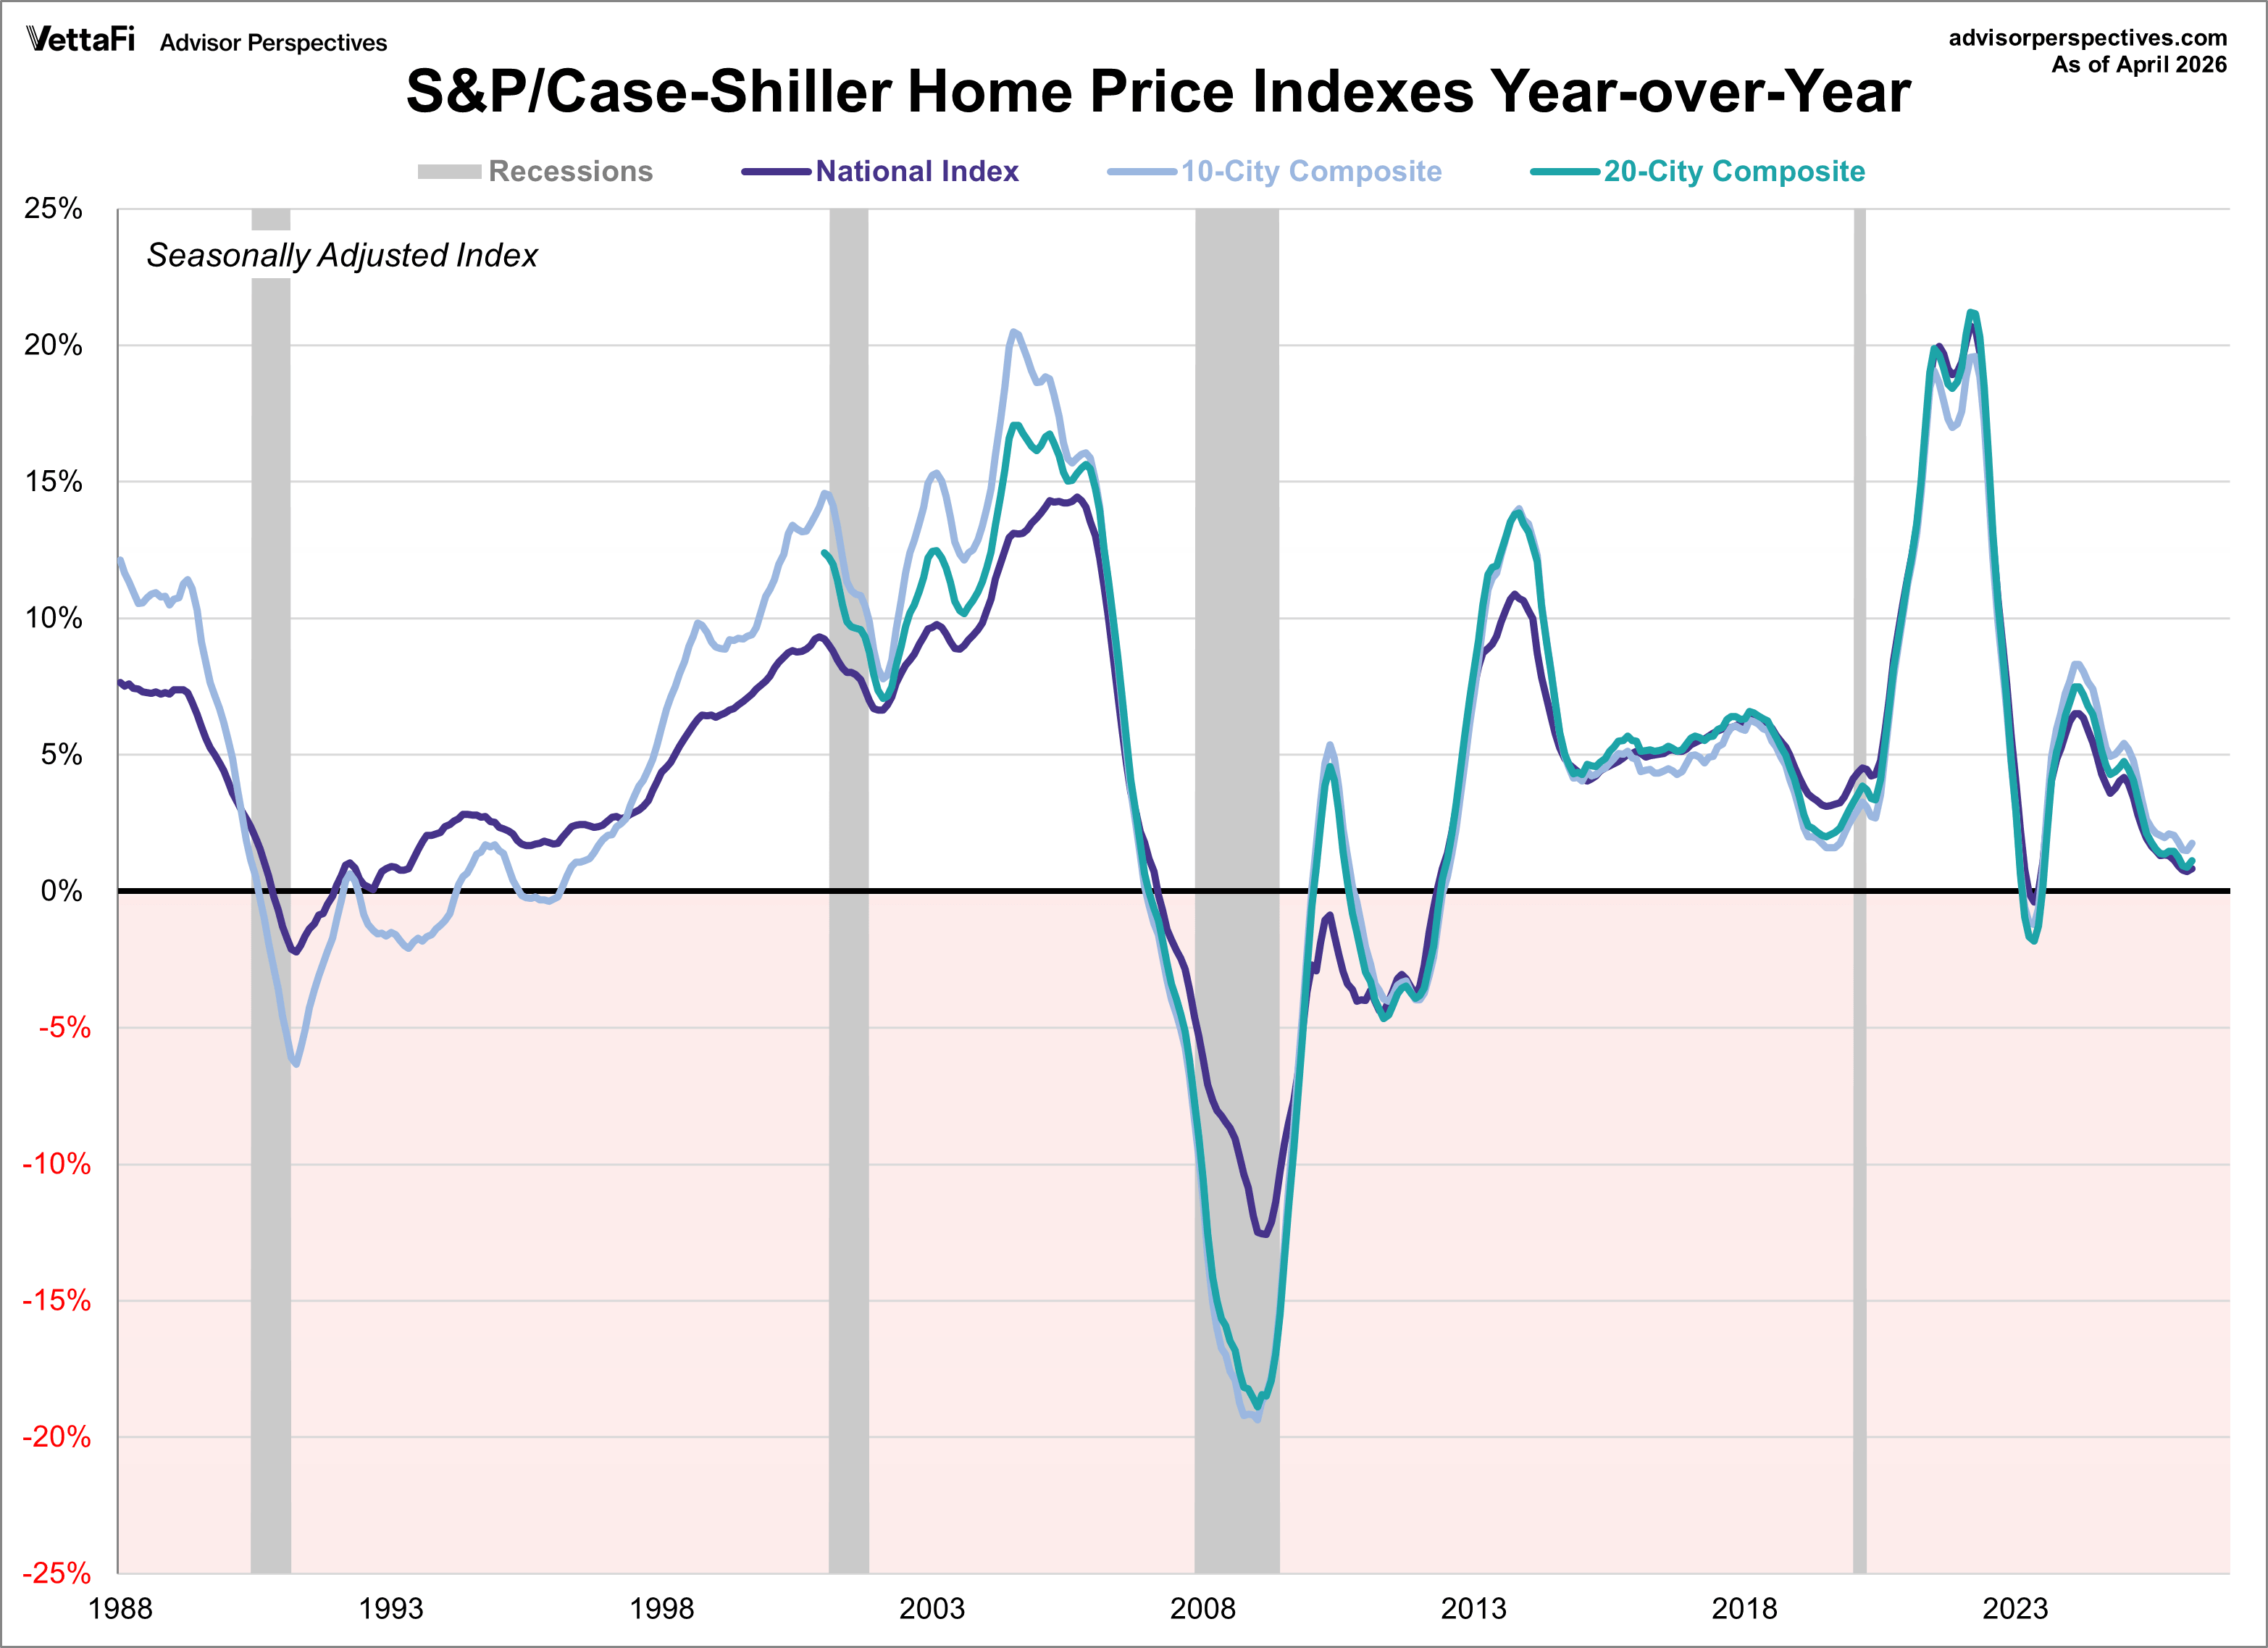
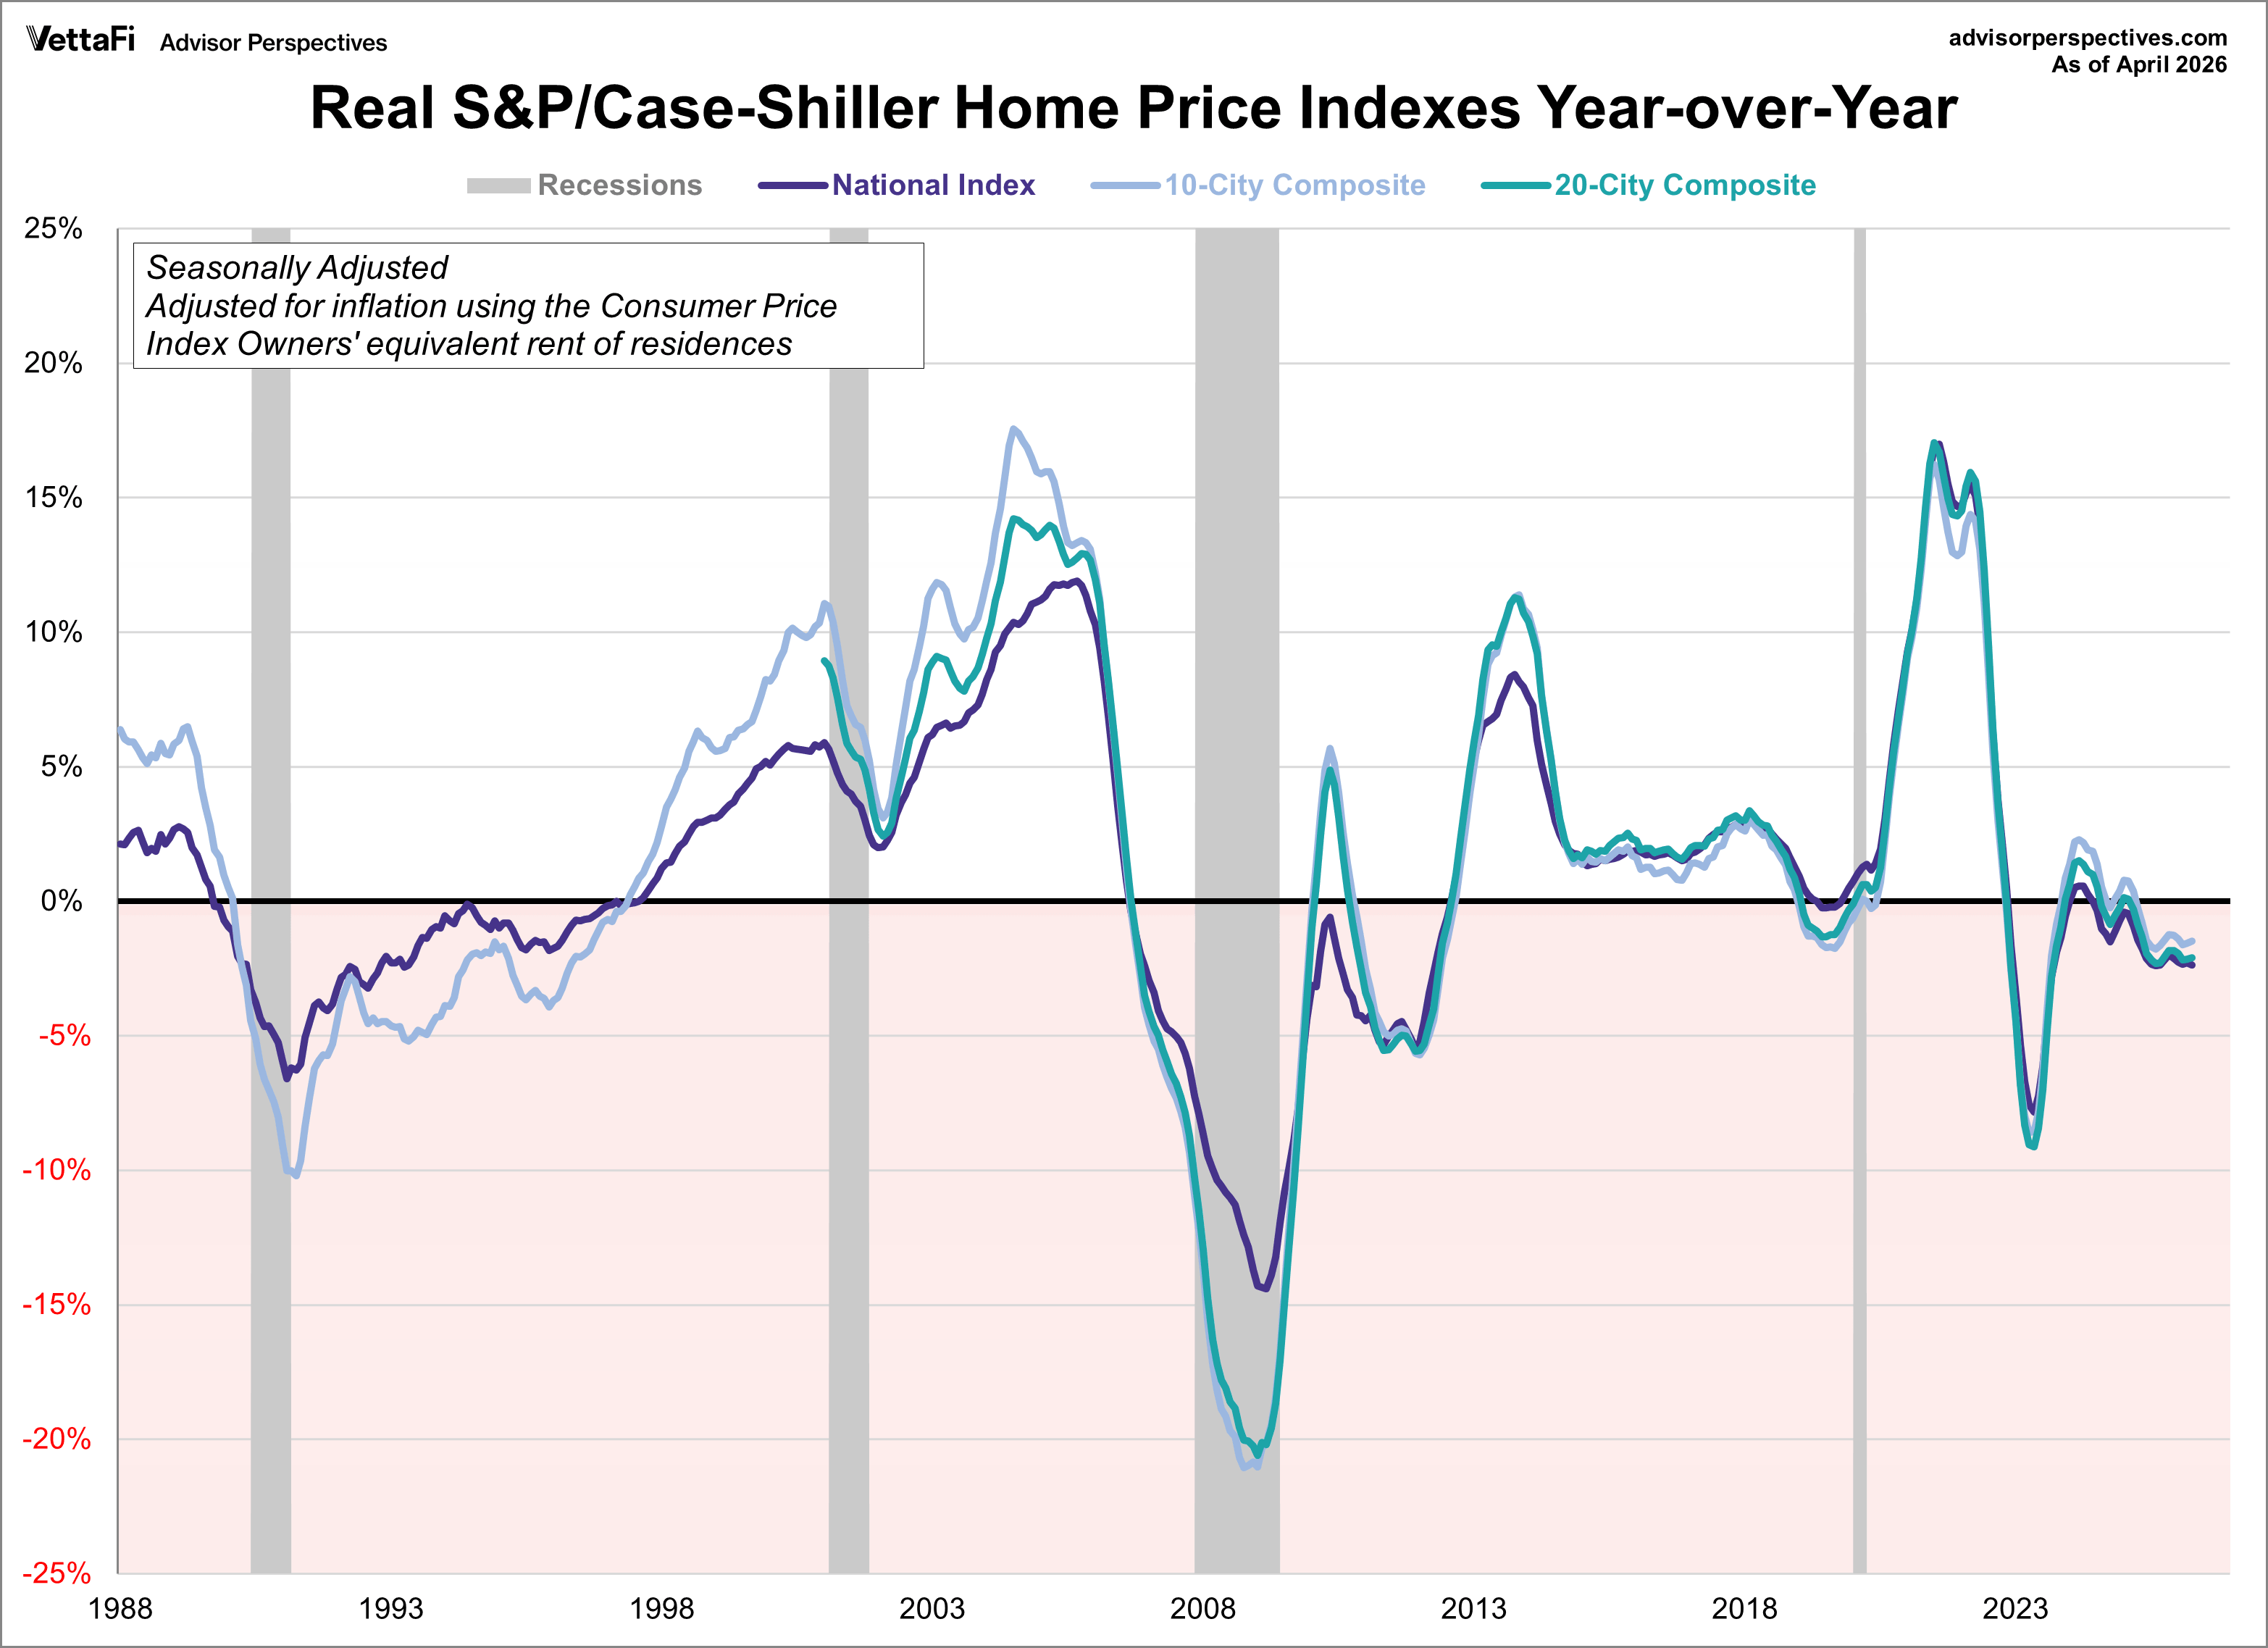
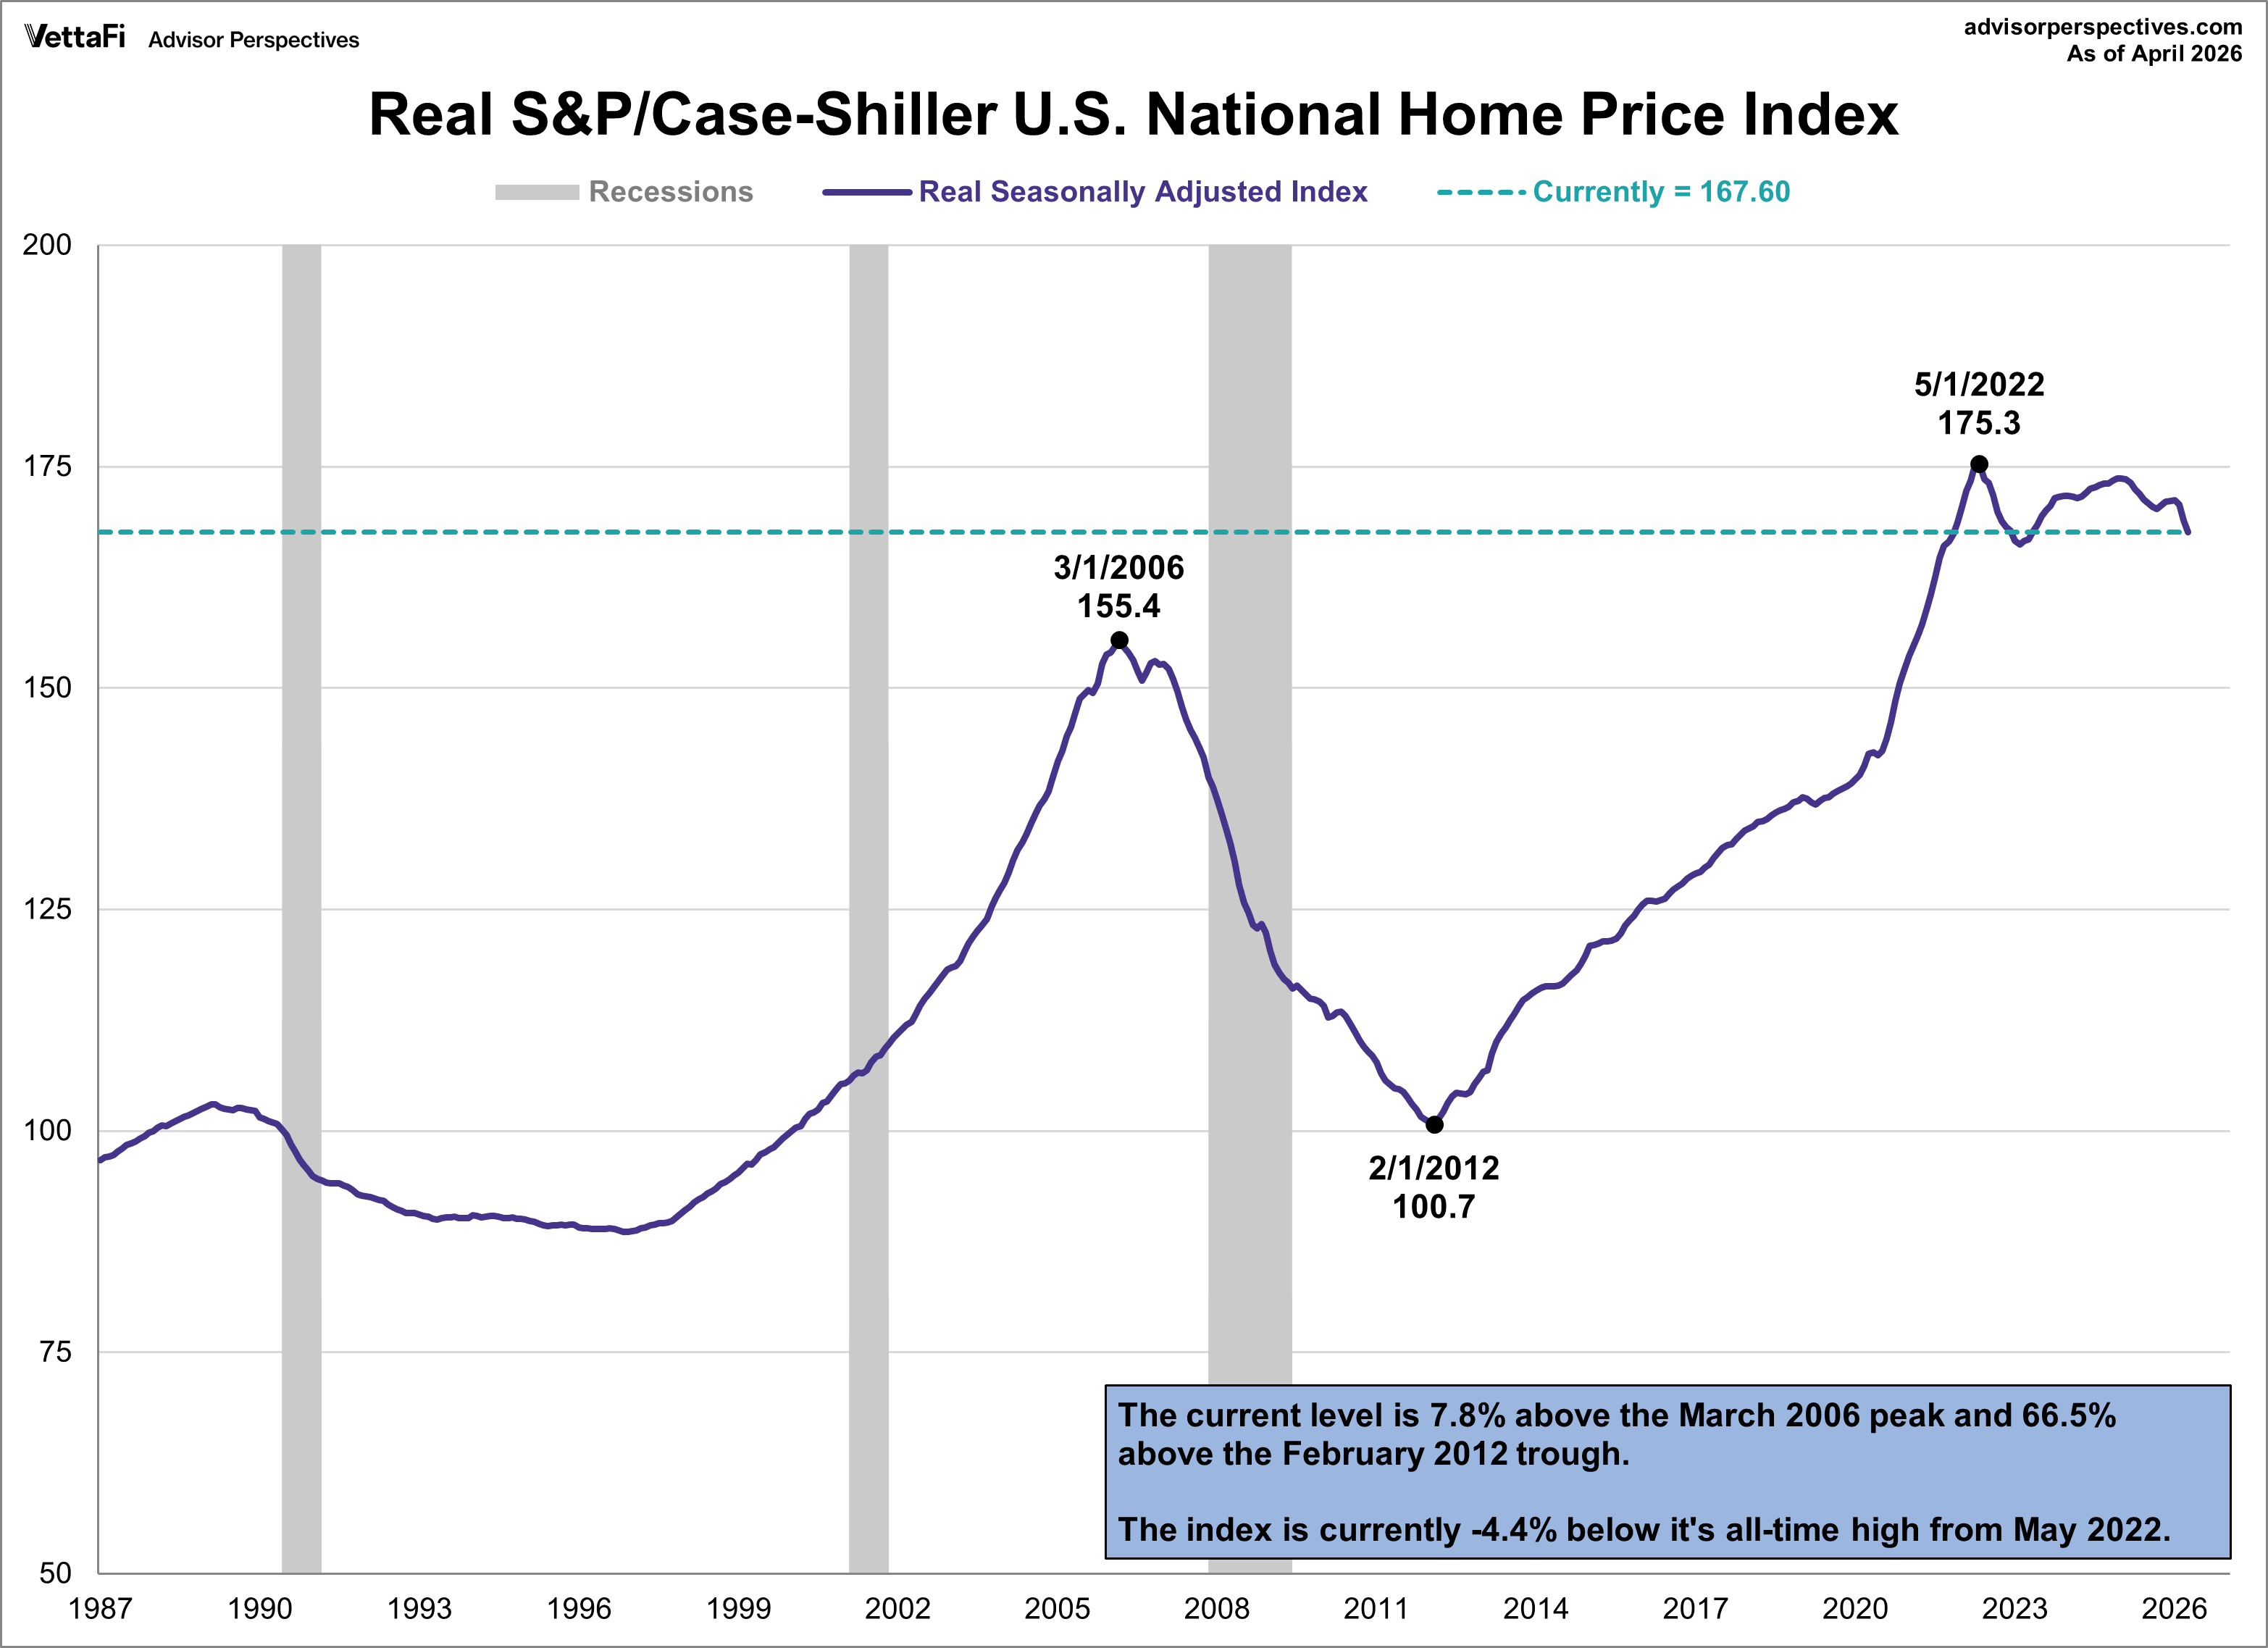
Home prices fell for a second straight month in April according to the S&P Cotality Case-Shiller index, as the housing slowdown intensifies. On a seasonally adjusted basis, the national index dropped 0.1% month-over-month and was up 0.8% year-over-year. After adjusting for inflation, the monthly change fell to -0.7% and the annual change fell to -2.4%.
Key Takeaways
-
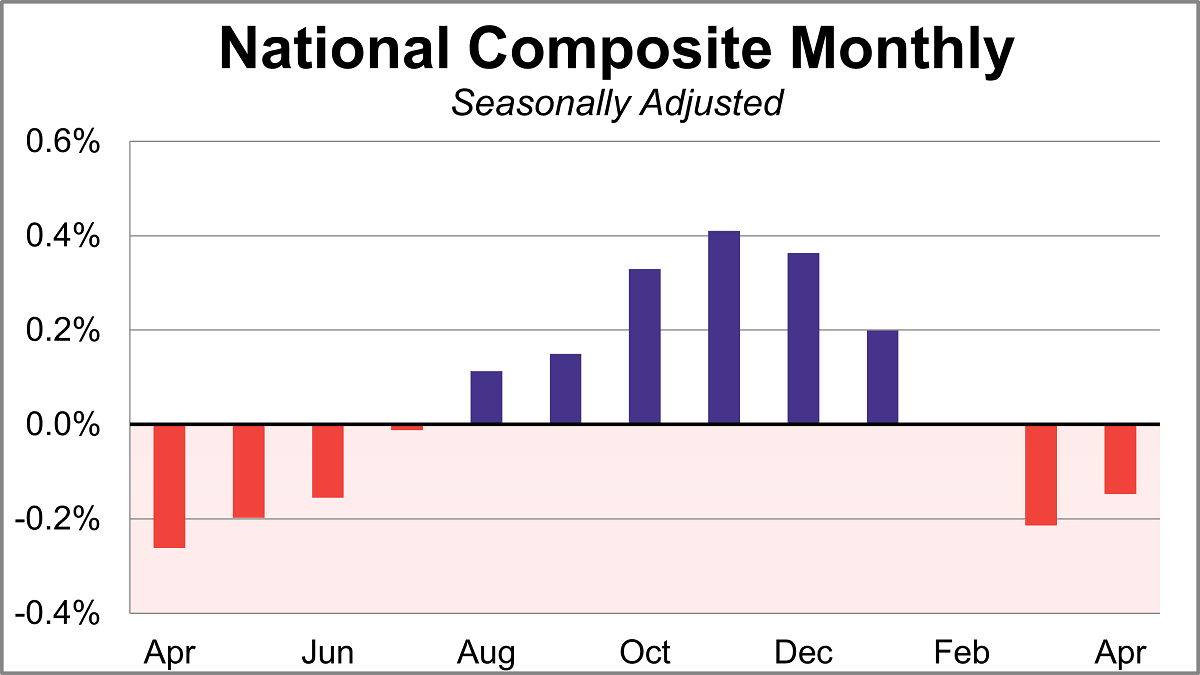
The S&P Case-Shiller National Home Price Index dropped 0.1% in April on a seasonally adjusted basis.
-
Chicago home prices led major cities with a 6.5% annual gain, while Seattle saw the steepest decline at 2.3%.
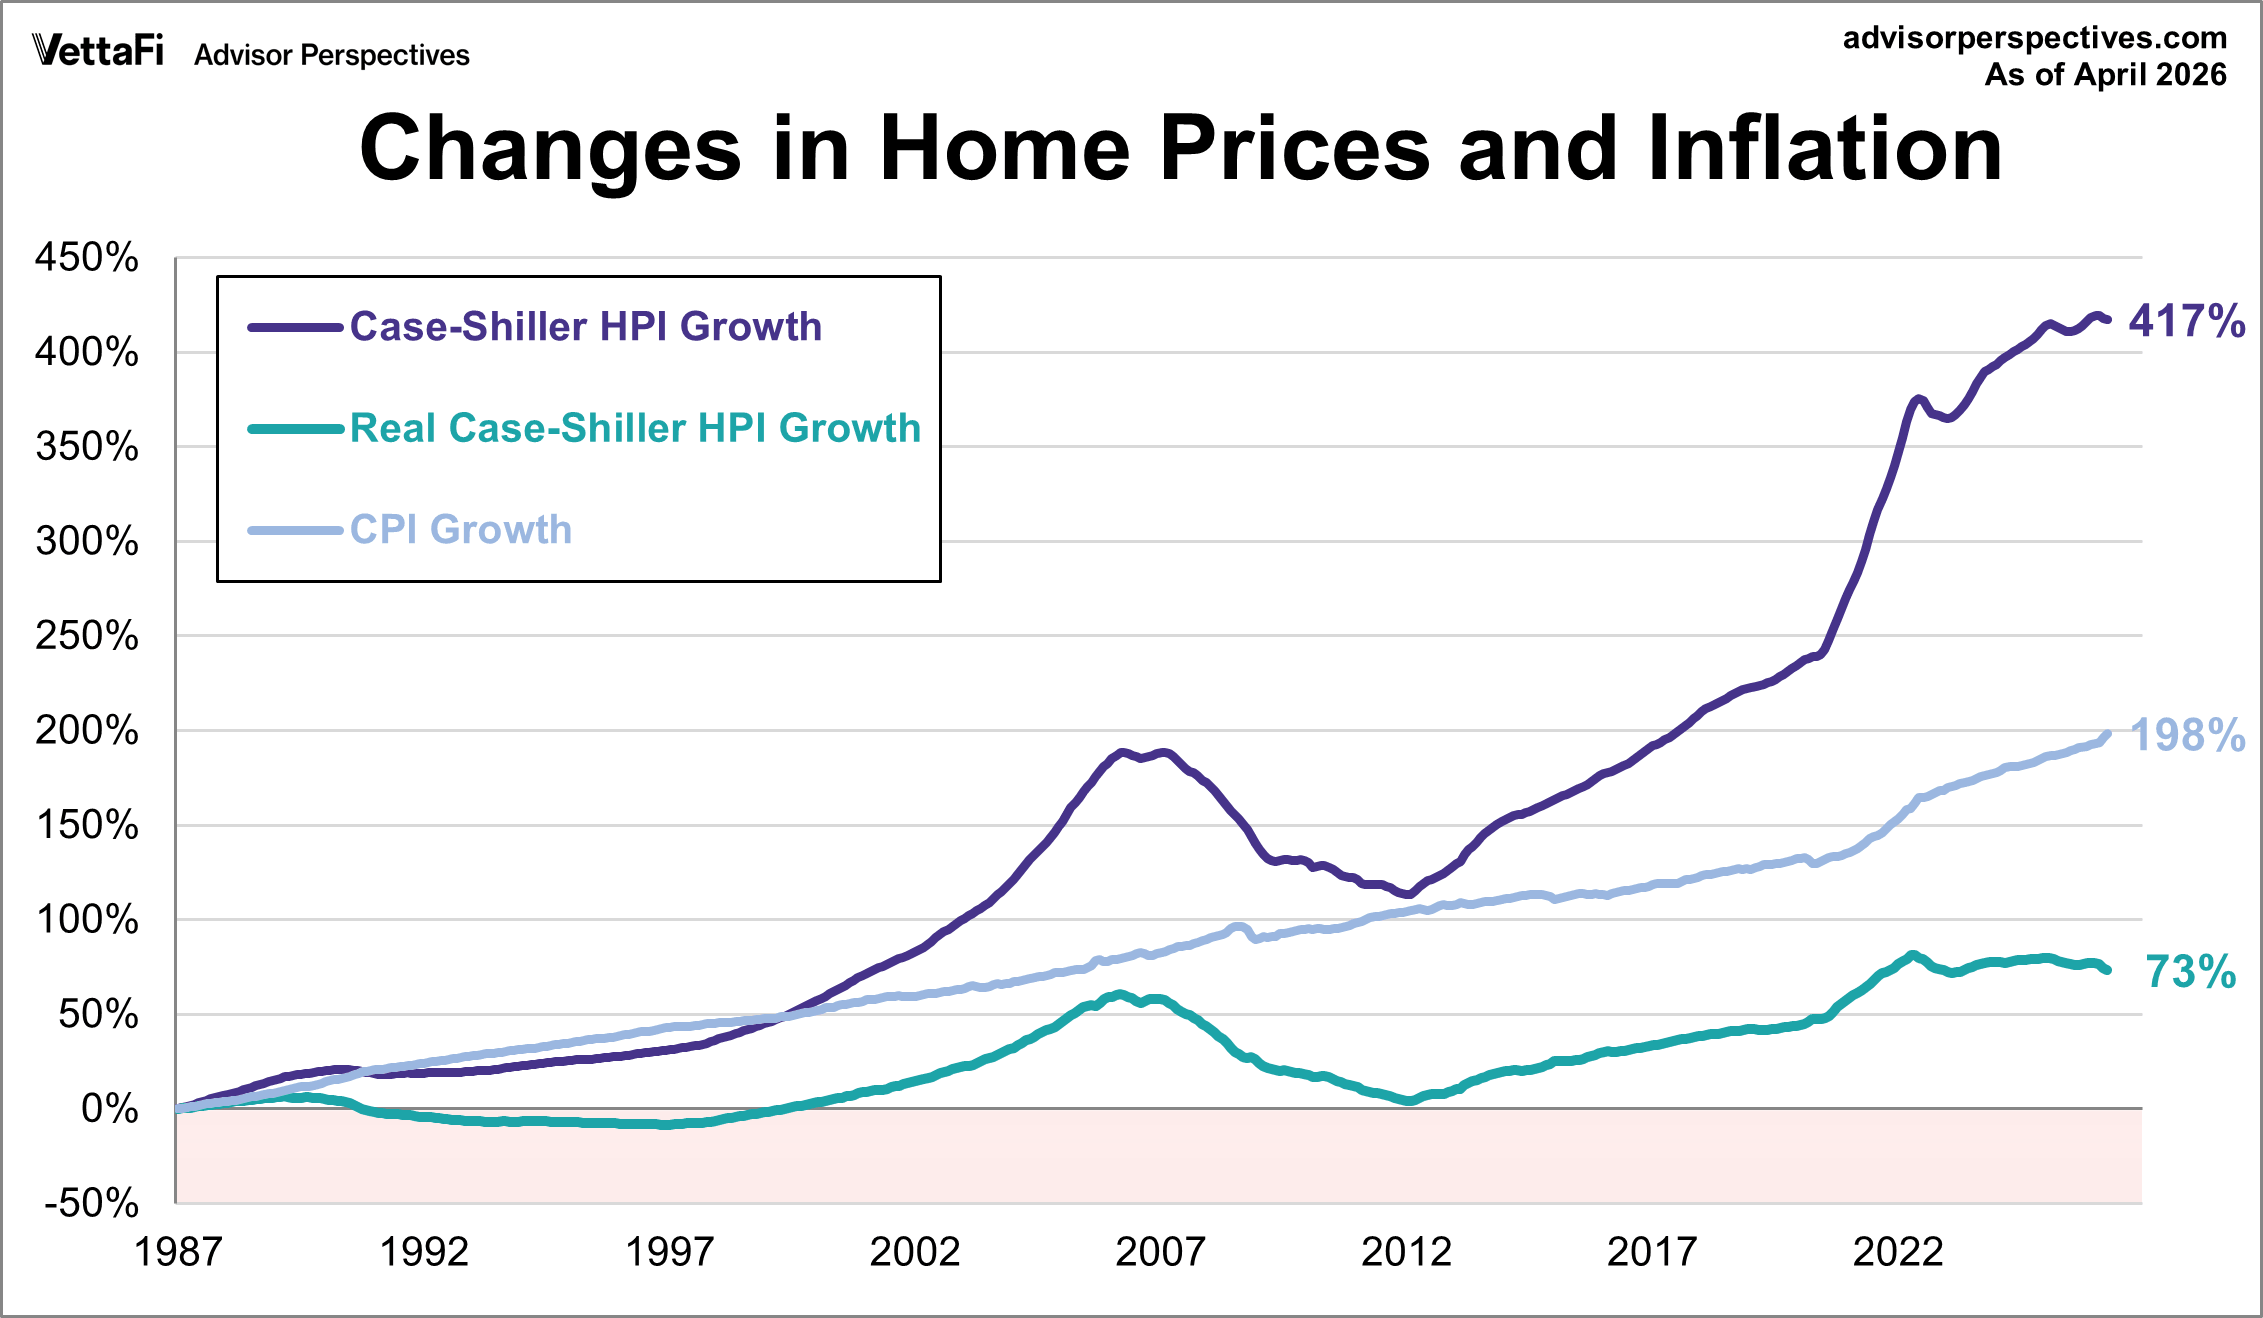
- U.S. home prices have grown 417% since 1987, but only 73% when adjusted for inflation.
The S&P Case-Shiller benchmark 20-City composite aims to measure the value of residential real estate in the following 20 major U.S. cities: Atlanta, Boston, Charlotte, Chicago, Cleveland, Dallas, Denver, Detroit, Las Vegas, Los Angeles, Miami, Minneapolis, New York, Phoenix, Portland, San Diego, San Francisco, Seattle, Tampa, and Washington D.C.
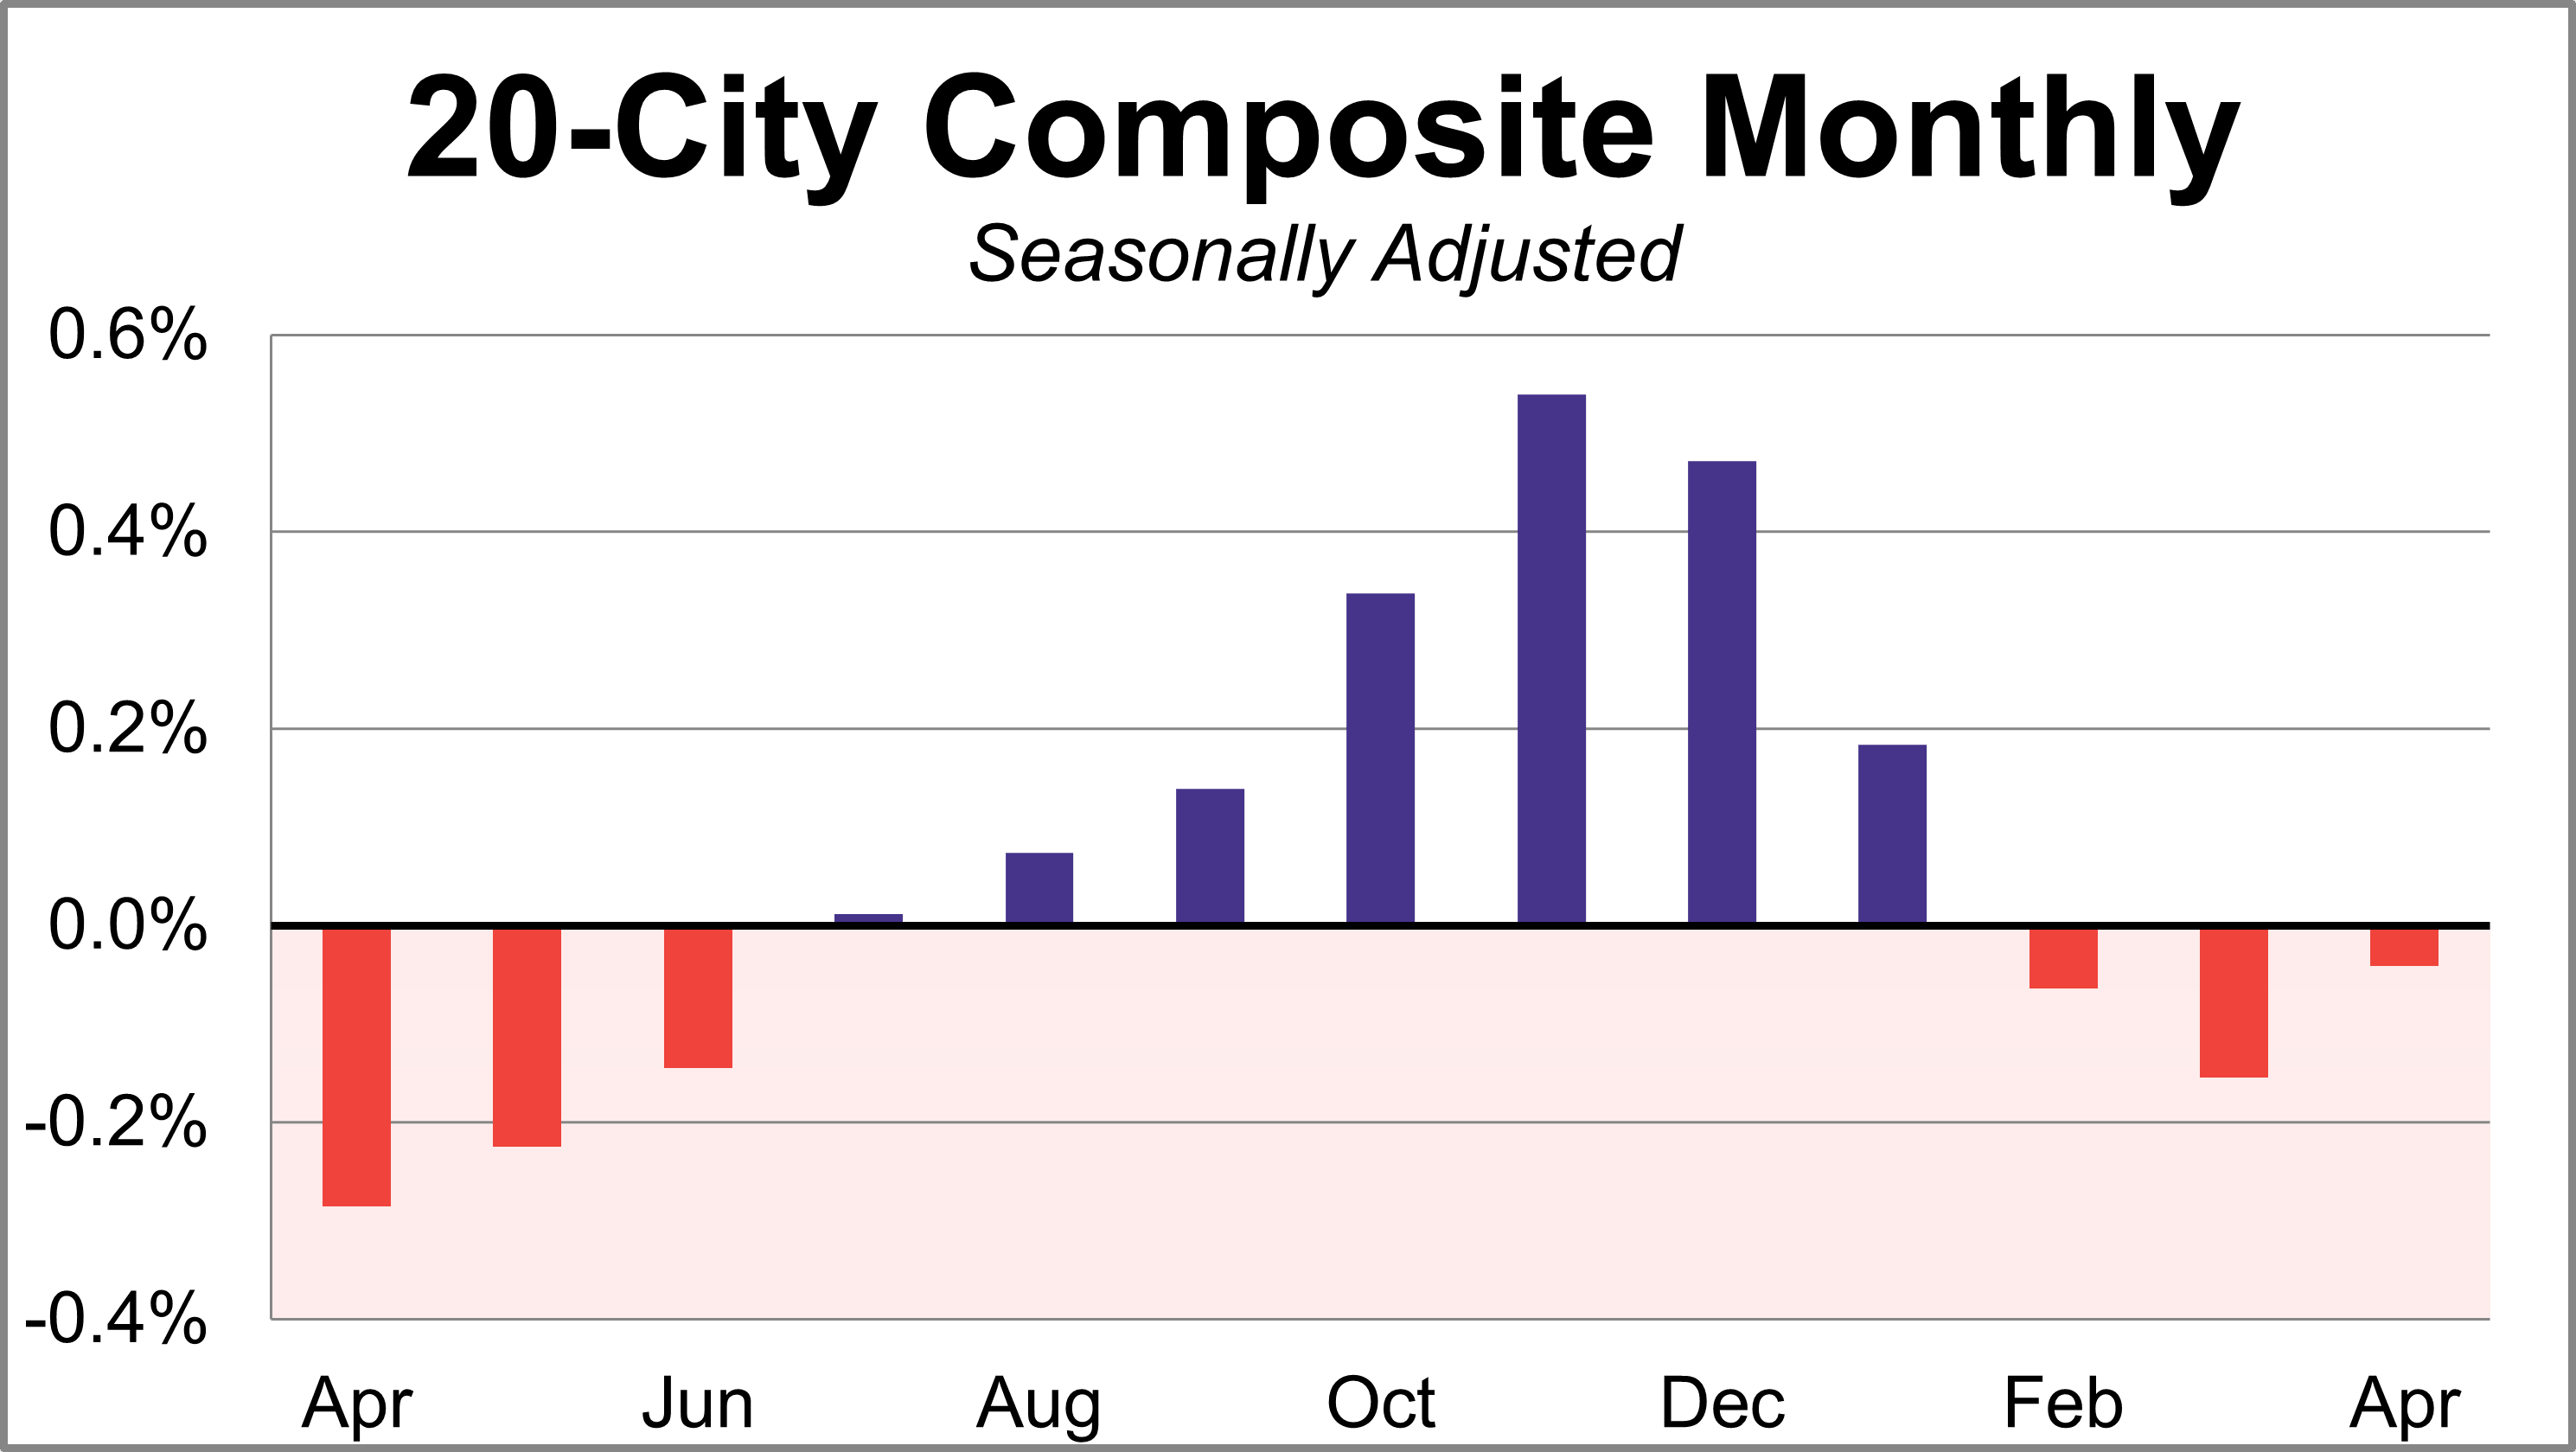
The benchmark 20-city index fell for a third straight month in April. The seasonally adjusted home prices for the 20-city index were practically unchanged (-0.04% month-over-month) and saw a 1.1% increase year-over-year. After adjusting for inflation, the monthly change was reduced to -0.6% and the annual change fell to -2.1%.
The S&P Case-Shiller benchmark 10-City composite, a subset of the 20-city index, aims to measure the change in value of residential real estate in the following 10 major U.S. cities: Boston, Chicago, Denver, Las Vegas, Los Angeles, Miami, New York, San Diego, San Francisco, and Washington D.C.
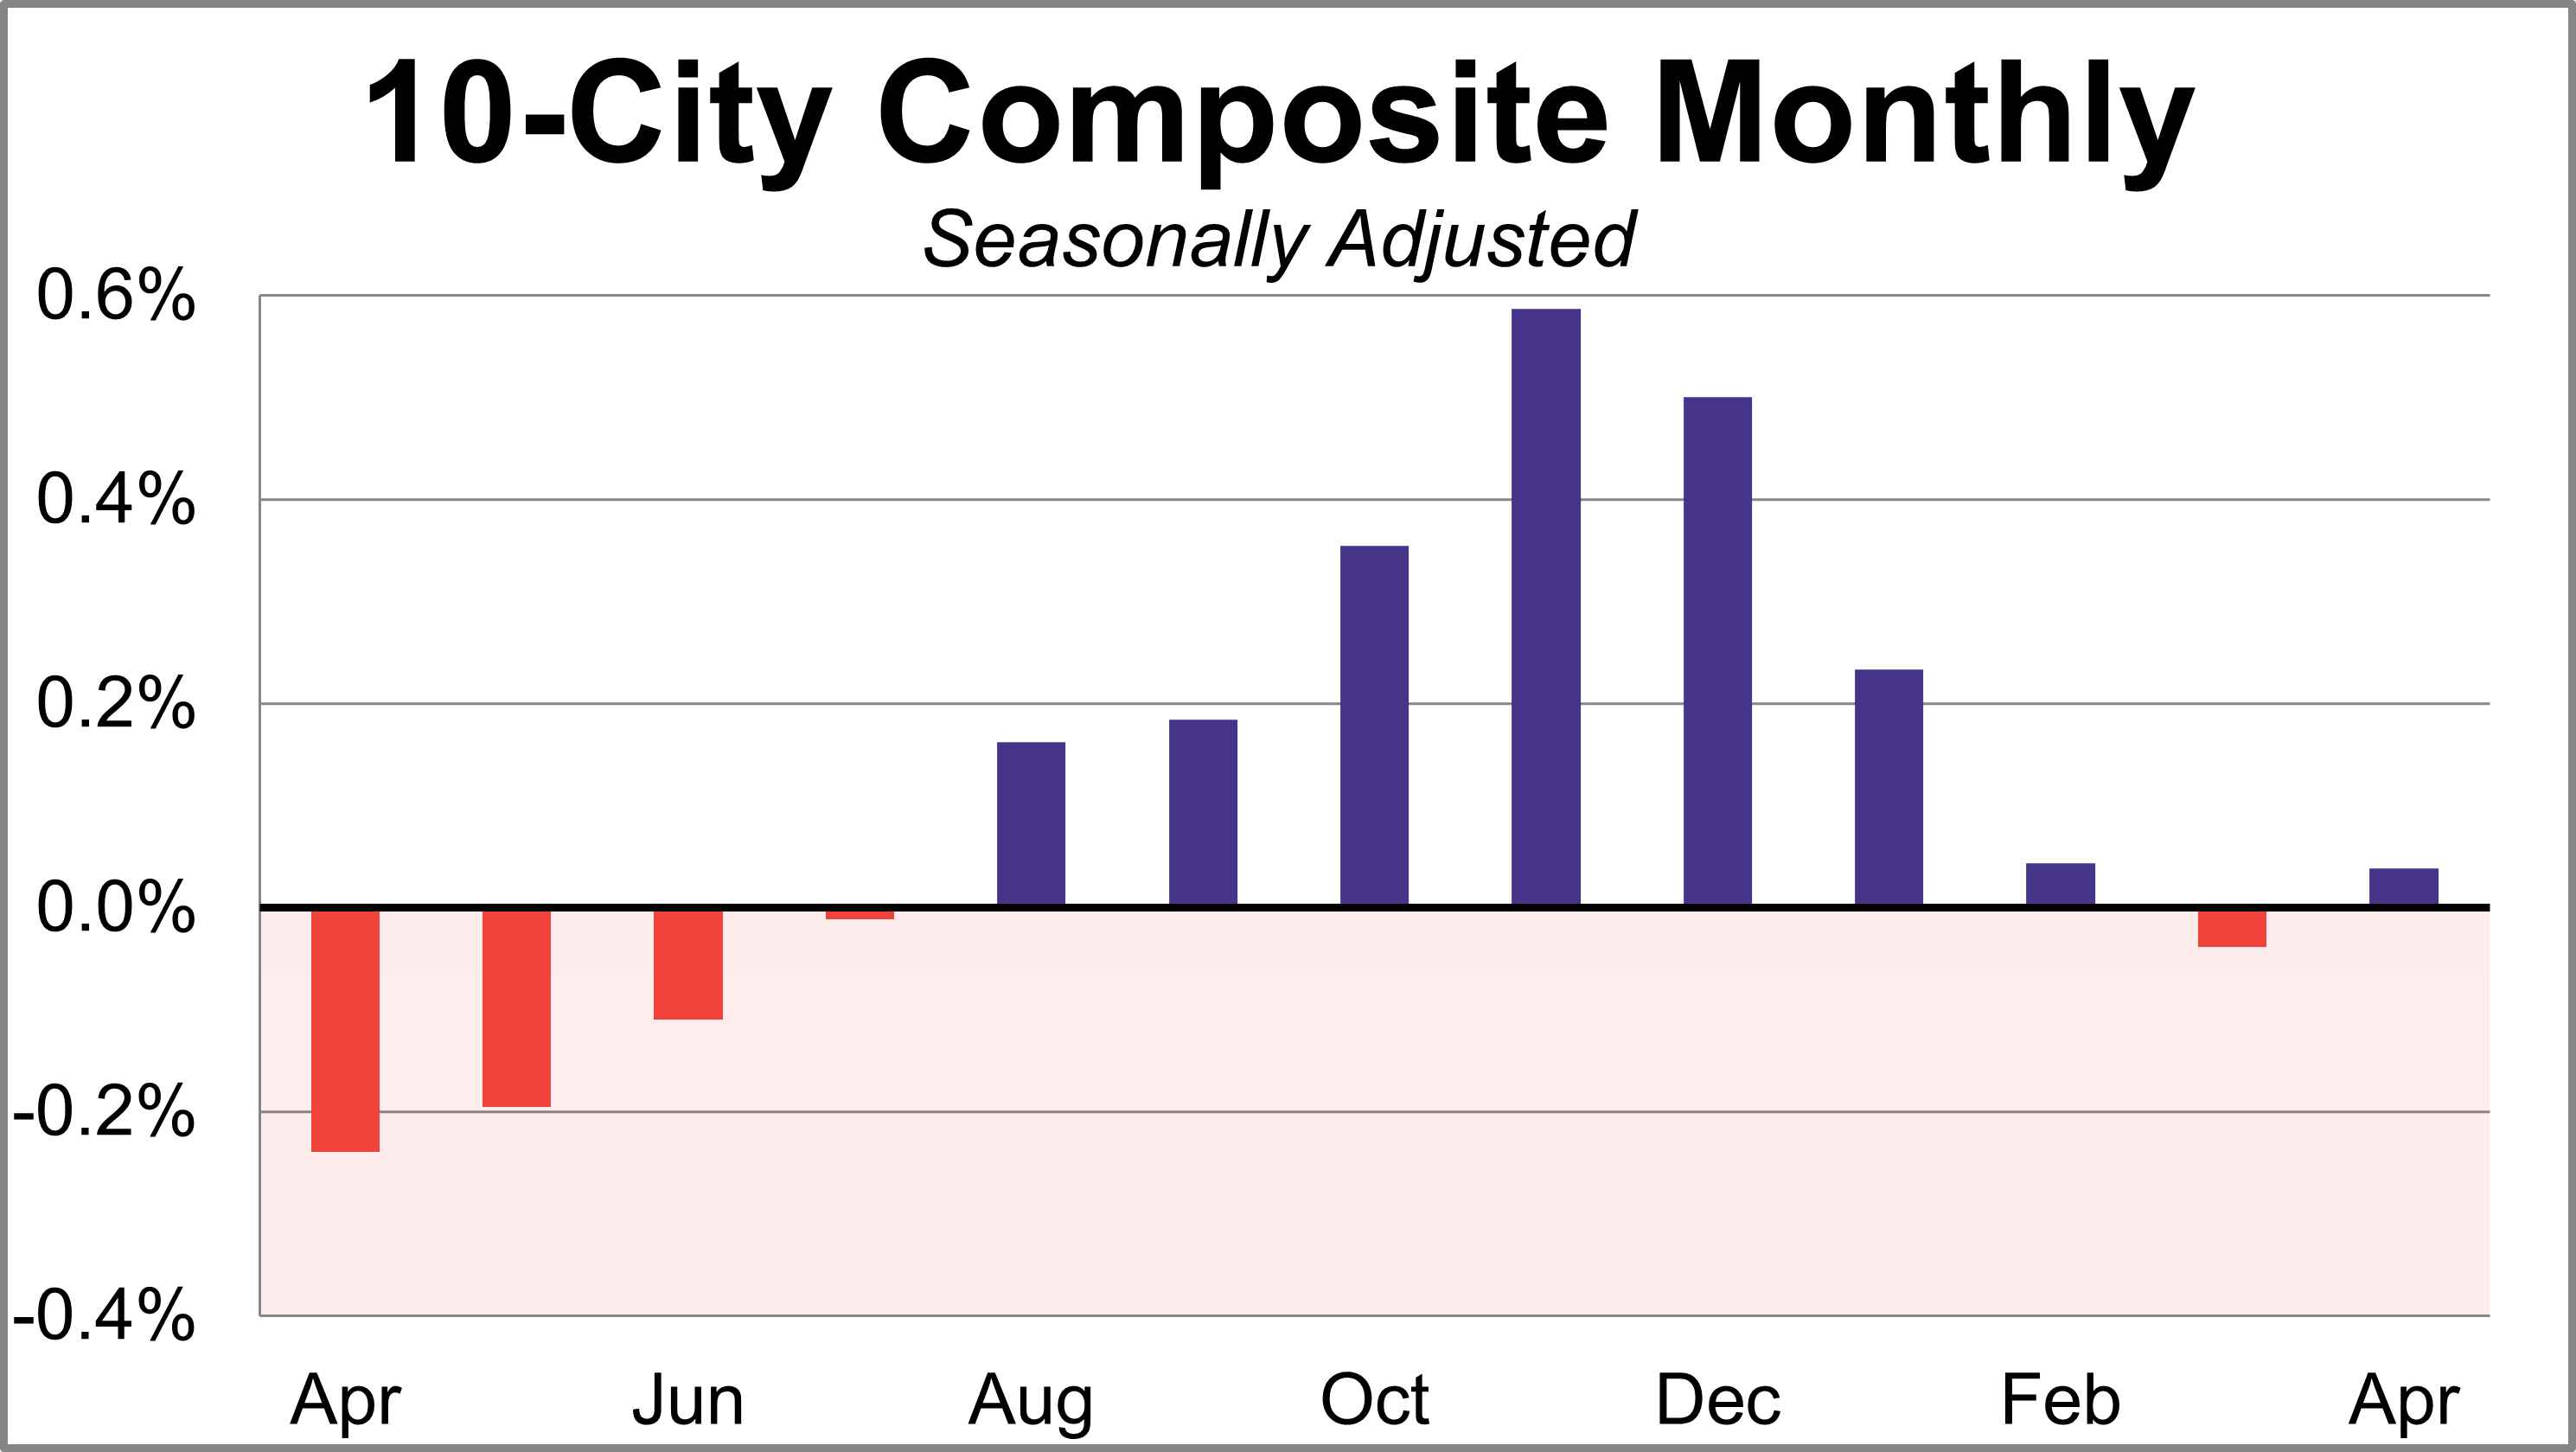
The benchmark 10-city index inched up in April. The seasonally adjusted home prices for the 10-city index were essentially flat (+0.04% month-over-month) and saw a 1.8% increase year-over-yea. After adjusting for inflation, the monthly change was reduced to -0.5% and the annual change fell to -1.5%.
Here is the analysis from today's Standard & Poor's press release:
ANALYSIS
"April's figures confirm that U.S. home prices remain essentially flat, with the S&P Cotality Case-Shiller National Home Price Index up a scant 0.8% year over year, just above March's 0.7% pace," said Nicholas Godec, CFA, CAIA, CIPM, Head of Fixed Income Tradables & Commodities at S&P Dow Jones Indices. "With inflation accelerating to 3.8% in April, U.S. home values have now declined in real terms for an 11th straight month, further eroding inflation-adjusted housing wealth.
"Geographic dispersion remains pronounced," Godec continued. "Midwest and Northeast markets are still leading moderate growth, while many Sun Belt and Western metros see ongoing declines. Chicago was again the strongest market with a 6.5% annual gain, trailed by New York (3.8%) and Cleveland (3.2%). Seattle’s 2.3% year-over-year drop was the steepest in April, with Denver (-1.8%), Tampa (-1.8%), Dallas (-1.6%), and Phoenix (-1.7%) also among the notable decliners. The nearly 9 percent performance spread between Chicago and Seattle highlights how localized housing trends remain.
"Monthly price movements show seasonal strength masking underlying softness," Godec observed. "On a non-seasonally adjusted basis, the National Index rose 0.8% from March (with the 10-City and 20-City Composites up 1.1% and 1.0%, respectively), reflecting typical spring gains. Yet after seasonal adjustment, the National Index dipped 0.1%, while the 20-City Composite was essentially flat (-0.04%). The latest six months saw a 1.35% national increase, offsetting a -0.5% decline in the prior six months. This represents a modest shift in direction, but remains limited in the context of rising costs.
"The affordability pinch remains a key headwind," Godec concluded. "After dipping below 6% earlier this year, 30-year mortgage rates climbed back to 6.3% in April, keeping financing costs elevated. In this higher-rate environment, home price growth remains constrained, with housing largely treading water in nominal terms and falling in real terms."