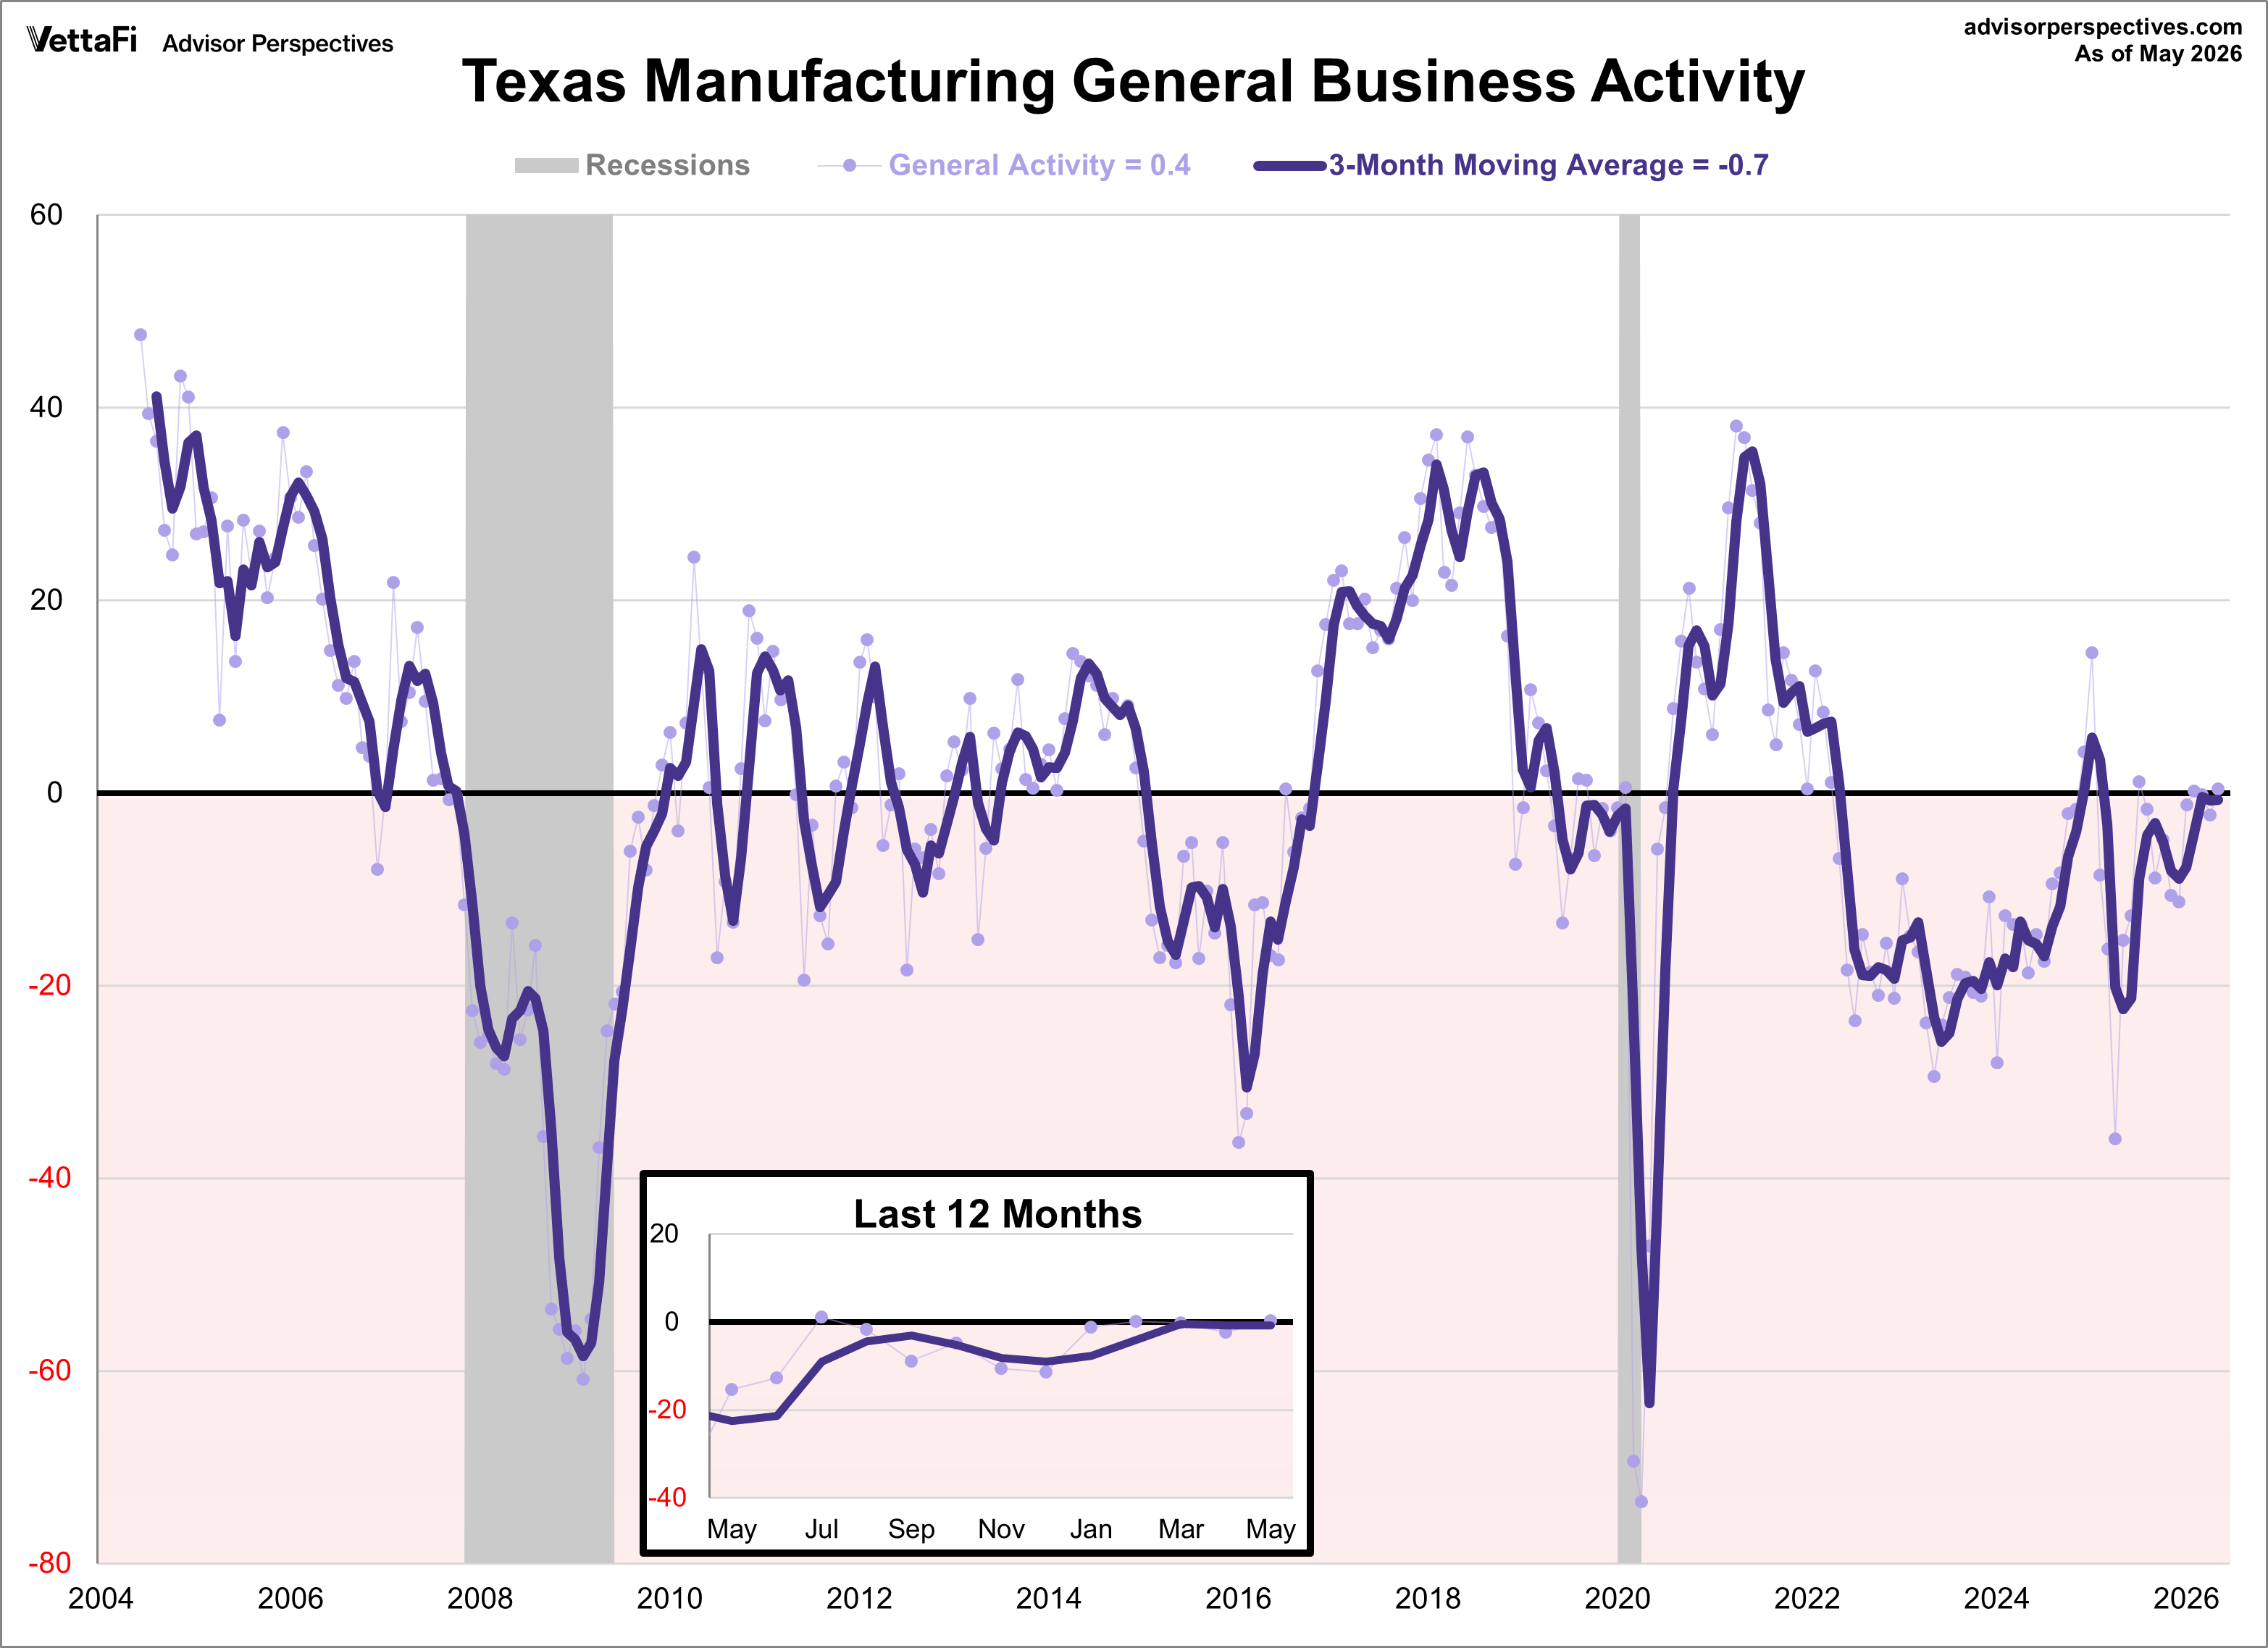
The Dallas Fed released its Texas Manufacturing Outlook Survey (TMOS) for May. The general business activity index rose 2.7 points to 0.4, indicating slower growth of manufacturing activity and stable business conditions perceptions.
Texas manufacturing output growth decelerated in May, according to business executives responding to the Texas Manufacturing Outlook Survey. The production index, a key measure of state manufacturing conditions, fell 10 points to 9.4, a reading suggestive of an average pace of output expansion.
Other measures of manufacturing activity also remained positive but showed signs of slower growth this month. The capacity utilization index plunged 15 points to 5.2, the new orders index dipped four points to 6.4, and the shipments index fell eight points to 7.4.
Perceptions of broader business conditions were stable in May. The general business activity index edged up three points to 0.4, with the near-zero reading indicating no change in activity from April. Similarly, the company outlook index came in at 0.3, down from 3.0, with the near-zero May reading signaling no change in outlooks. The outlook uncertainty index was little changed at 19.2, remaining above the series average of 16.9.
Employment continued to be flat, and workweeks held steady in May. The employment index was unchanged at 0.2, indicating no change in payrolls from April. The hours worked index moved down to 1.8 from 4.0.
Input price pressures increased, selling price pressures eased, and wage pressures held steady this month. The raw materials prices index rose six points to 42.7, its highest level in eight months, while the finished goods prices index fell nine points to 18.9. The wages and benefits index was relatively unchanged at 23.6.
Press release
Background on the Texas Manufacturing Outlook Survey (TMOS)
Monthly data for this indicator only dates back to 2004, so it is difficult to see the full potential of this indicator without several business cycles of data. Nevertheless, it is an interesting and important regional manufacturing indicator. The TMOS is a monthly survey of 100 Texas manufacturers that provides an assessment on the state's factory activity. The survey asks firms to whether output, employment, orders, prices, and other indicators have increased, decreased, or remained unchanged over the previous month. Results are aggregated into balance indexes where negative readings indicator contractions while positive ones indicate expansion.
The Dallas Fed on importance of Texas Manufacturing:
Texas is important to the nation’s manufacturing output. The state produced $296 billion in manufactured goods in 2023, roughly 11 percent of the country’s manufacturing output. Texas ranks second behind California in factory production and first as an exporter of manufactured goods.
Texas turns out a large share of the country’s production of petroleum and coal products, reflecting the significance of the region’s refining industry. Texas also produces over 13 percent of the nation’s chemical products and over 10 percent of nonmetallic mineral products, such as brick, glass and cement.
Here is a snapshot of the complete TMOS.

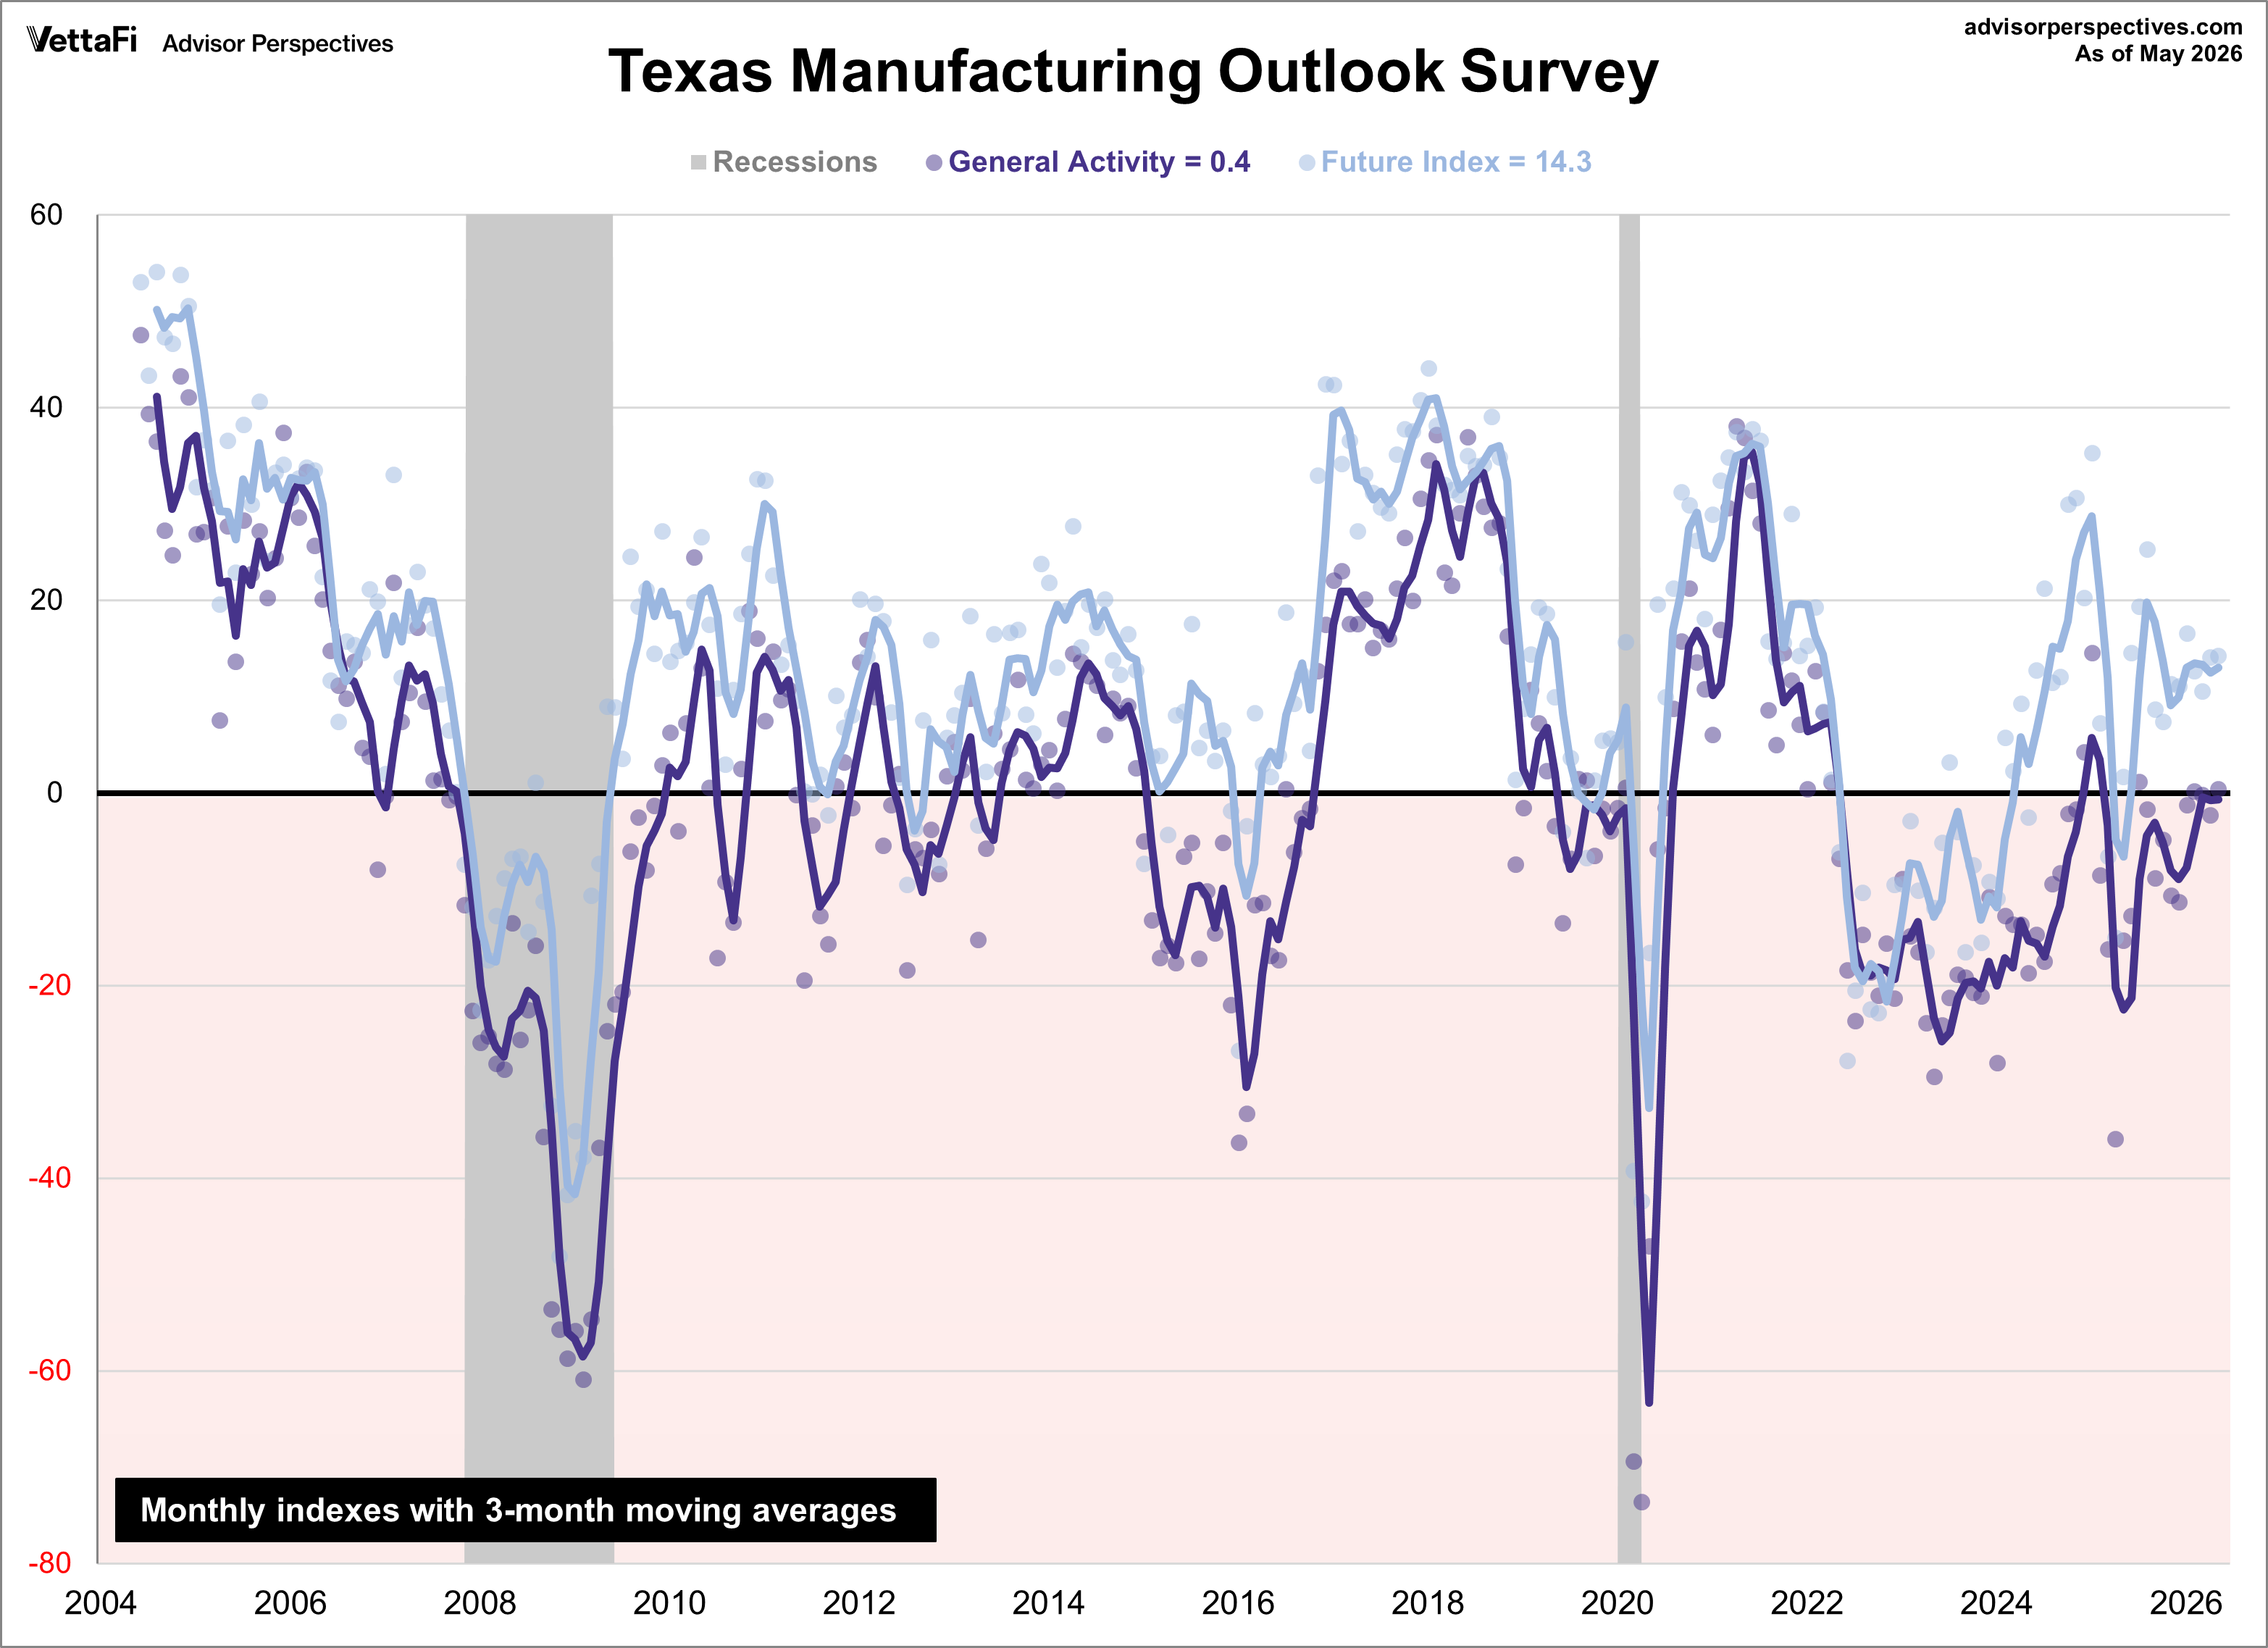
Texas Manufacturing Survey Future Outlook
The next chart is an overlay of the general business activity index and the future outlook index — the outlook six months ahead. Future general business activity expectations rose to 14.3 this month.
Expectations are for increased manufacturing activity six months from now. The future production index was little changed at 36.8, and the future general business activity index came in at 14.3, unchanged from last month. Other indexes of future manufacturing activity remained in positive territory.
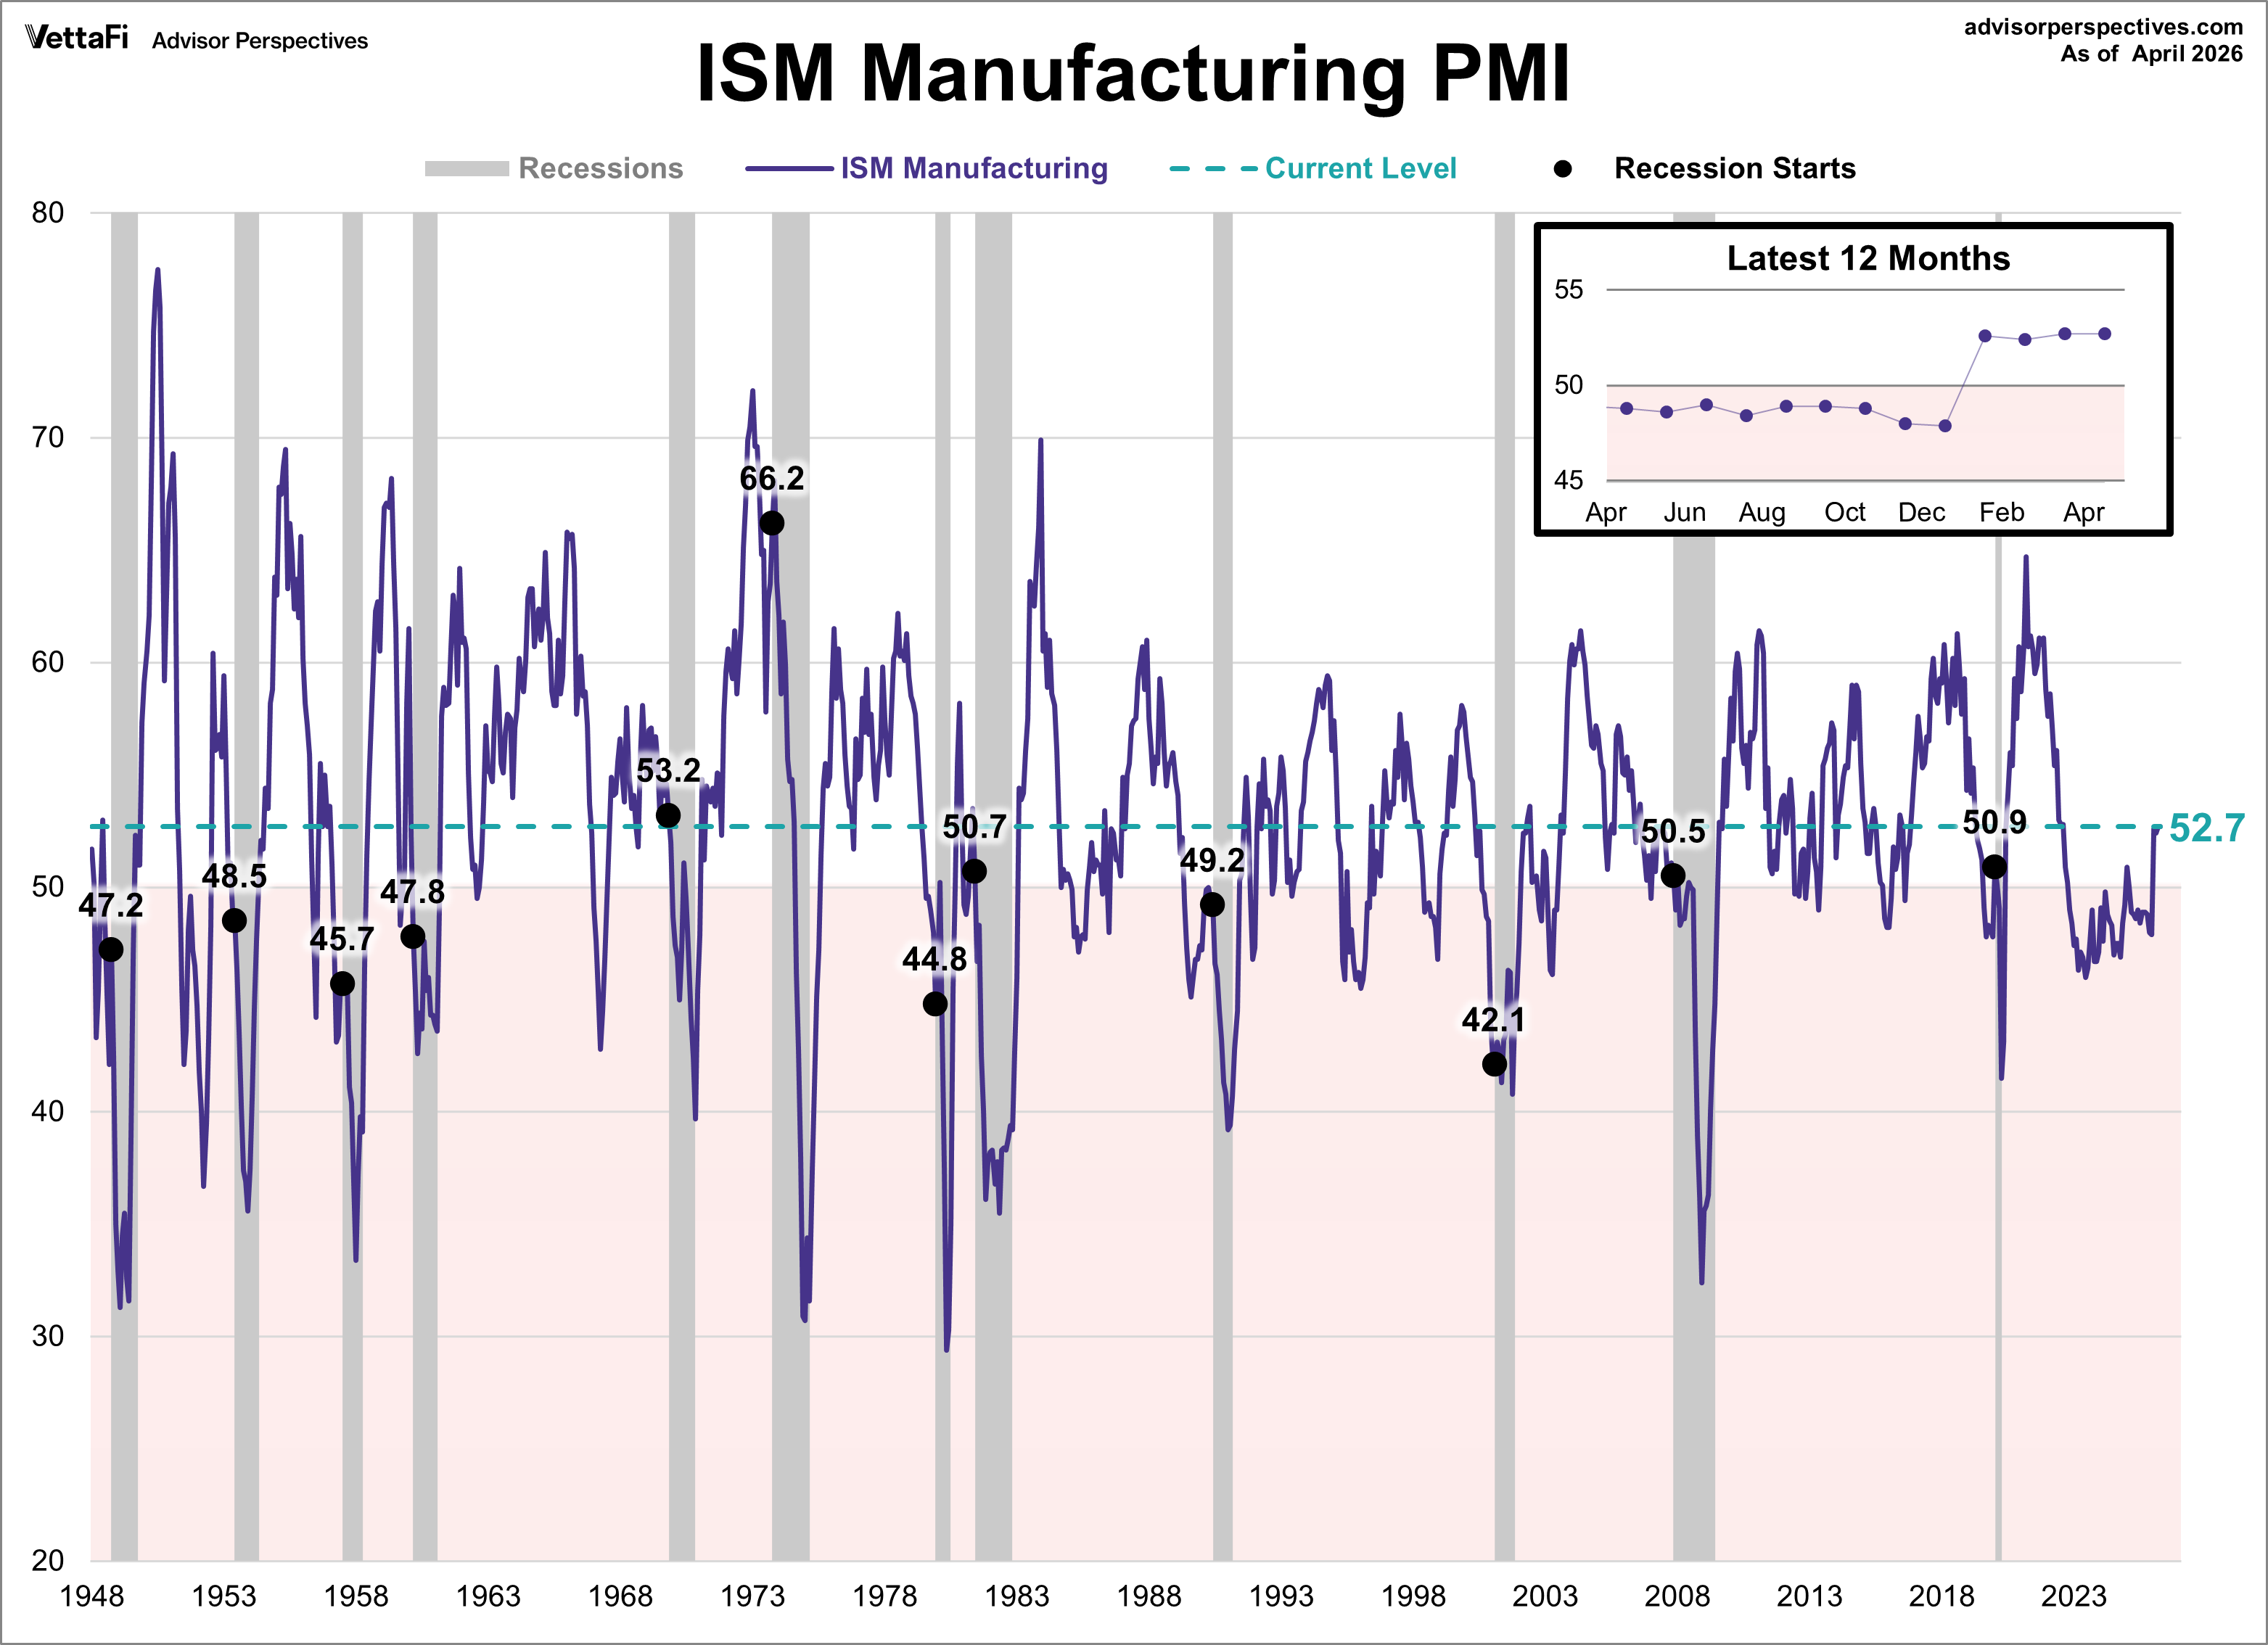
For comparison, here is the latest ISM Manufacturing survey.
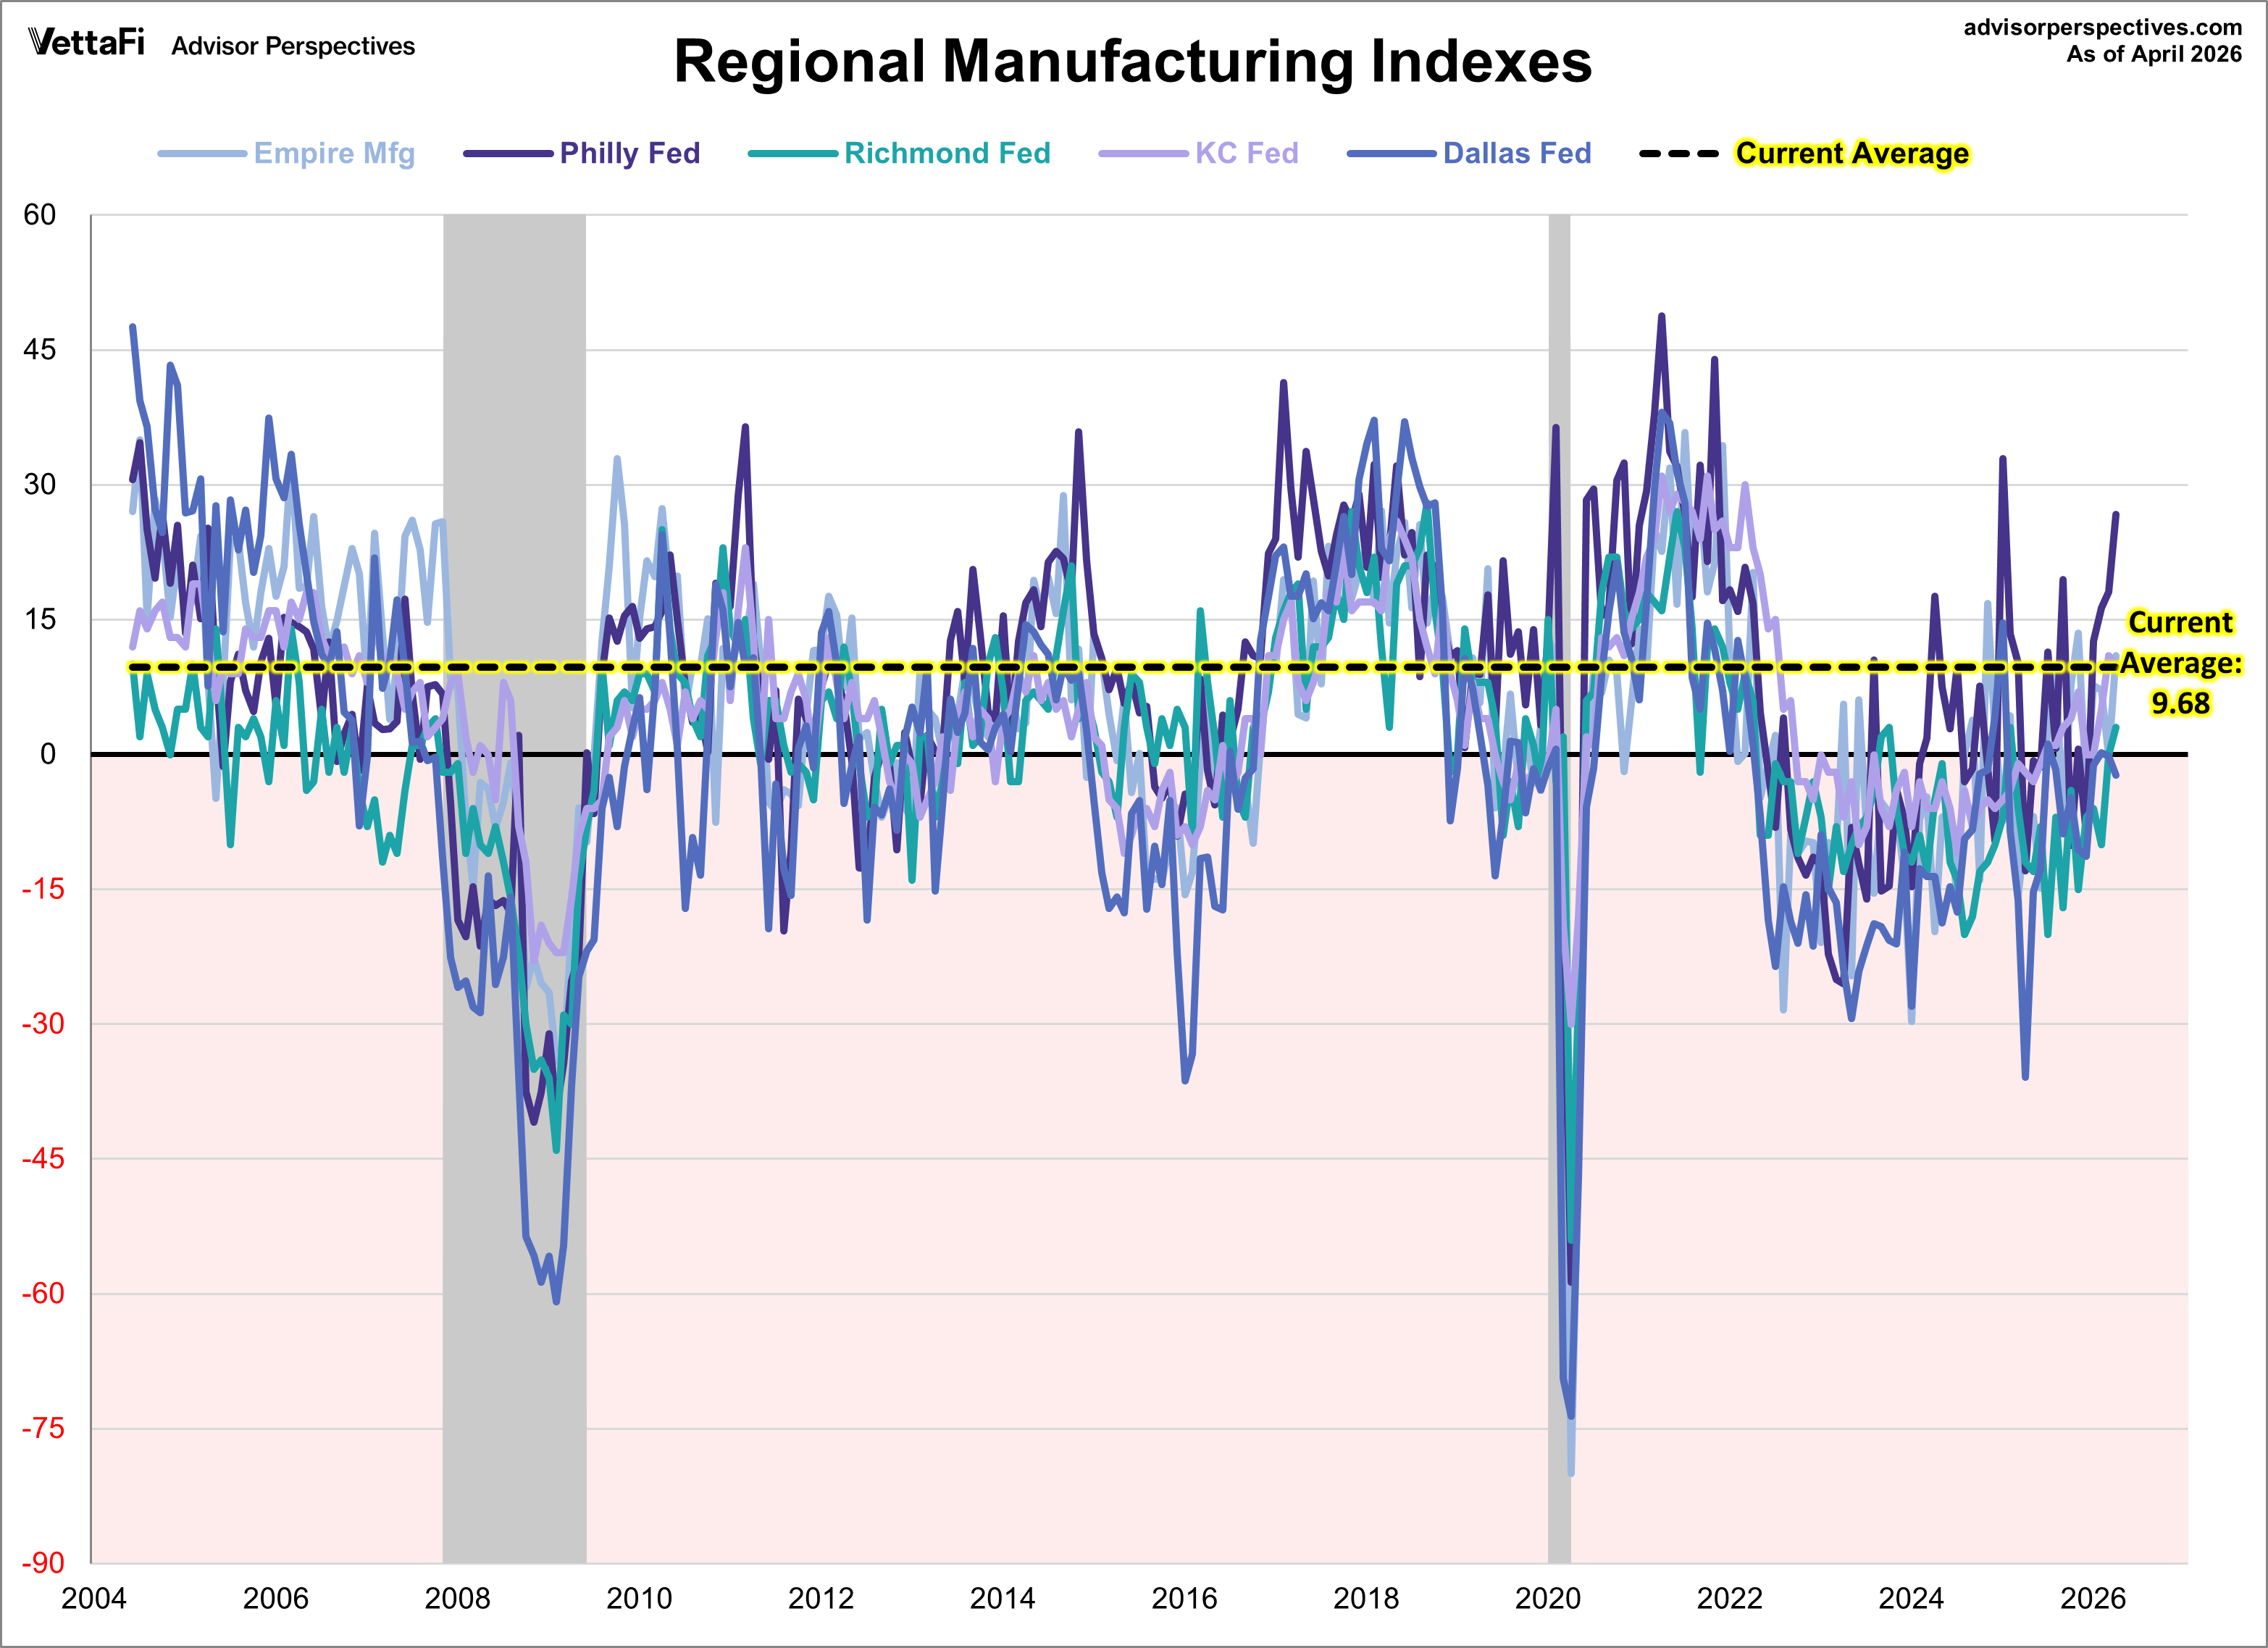
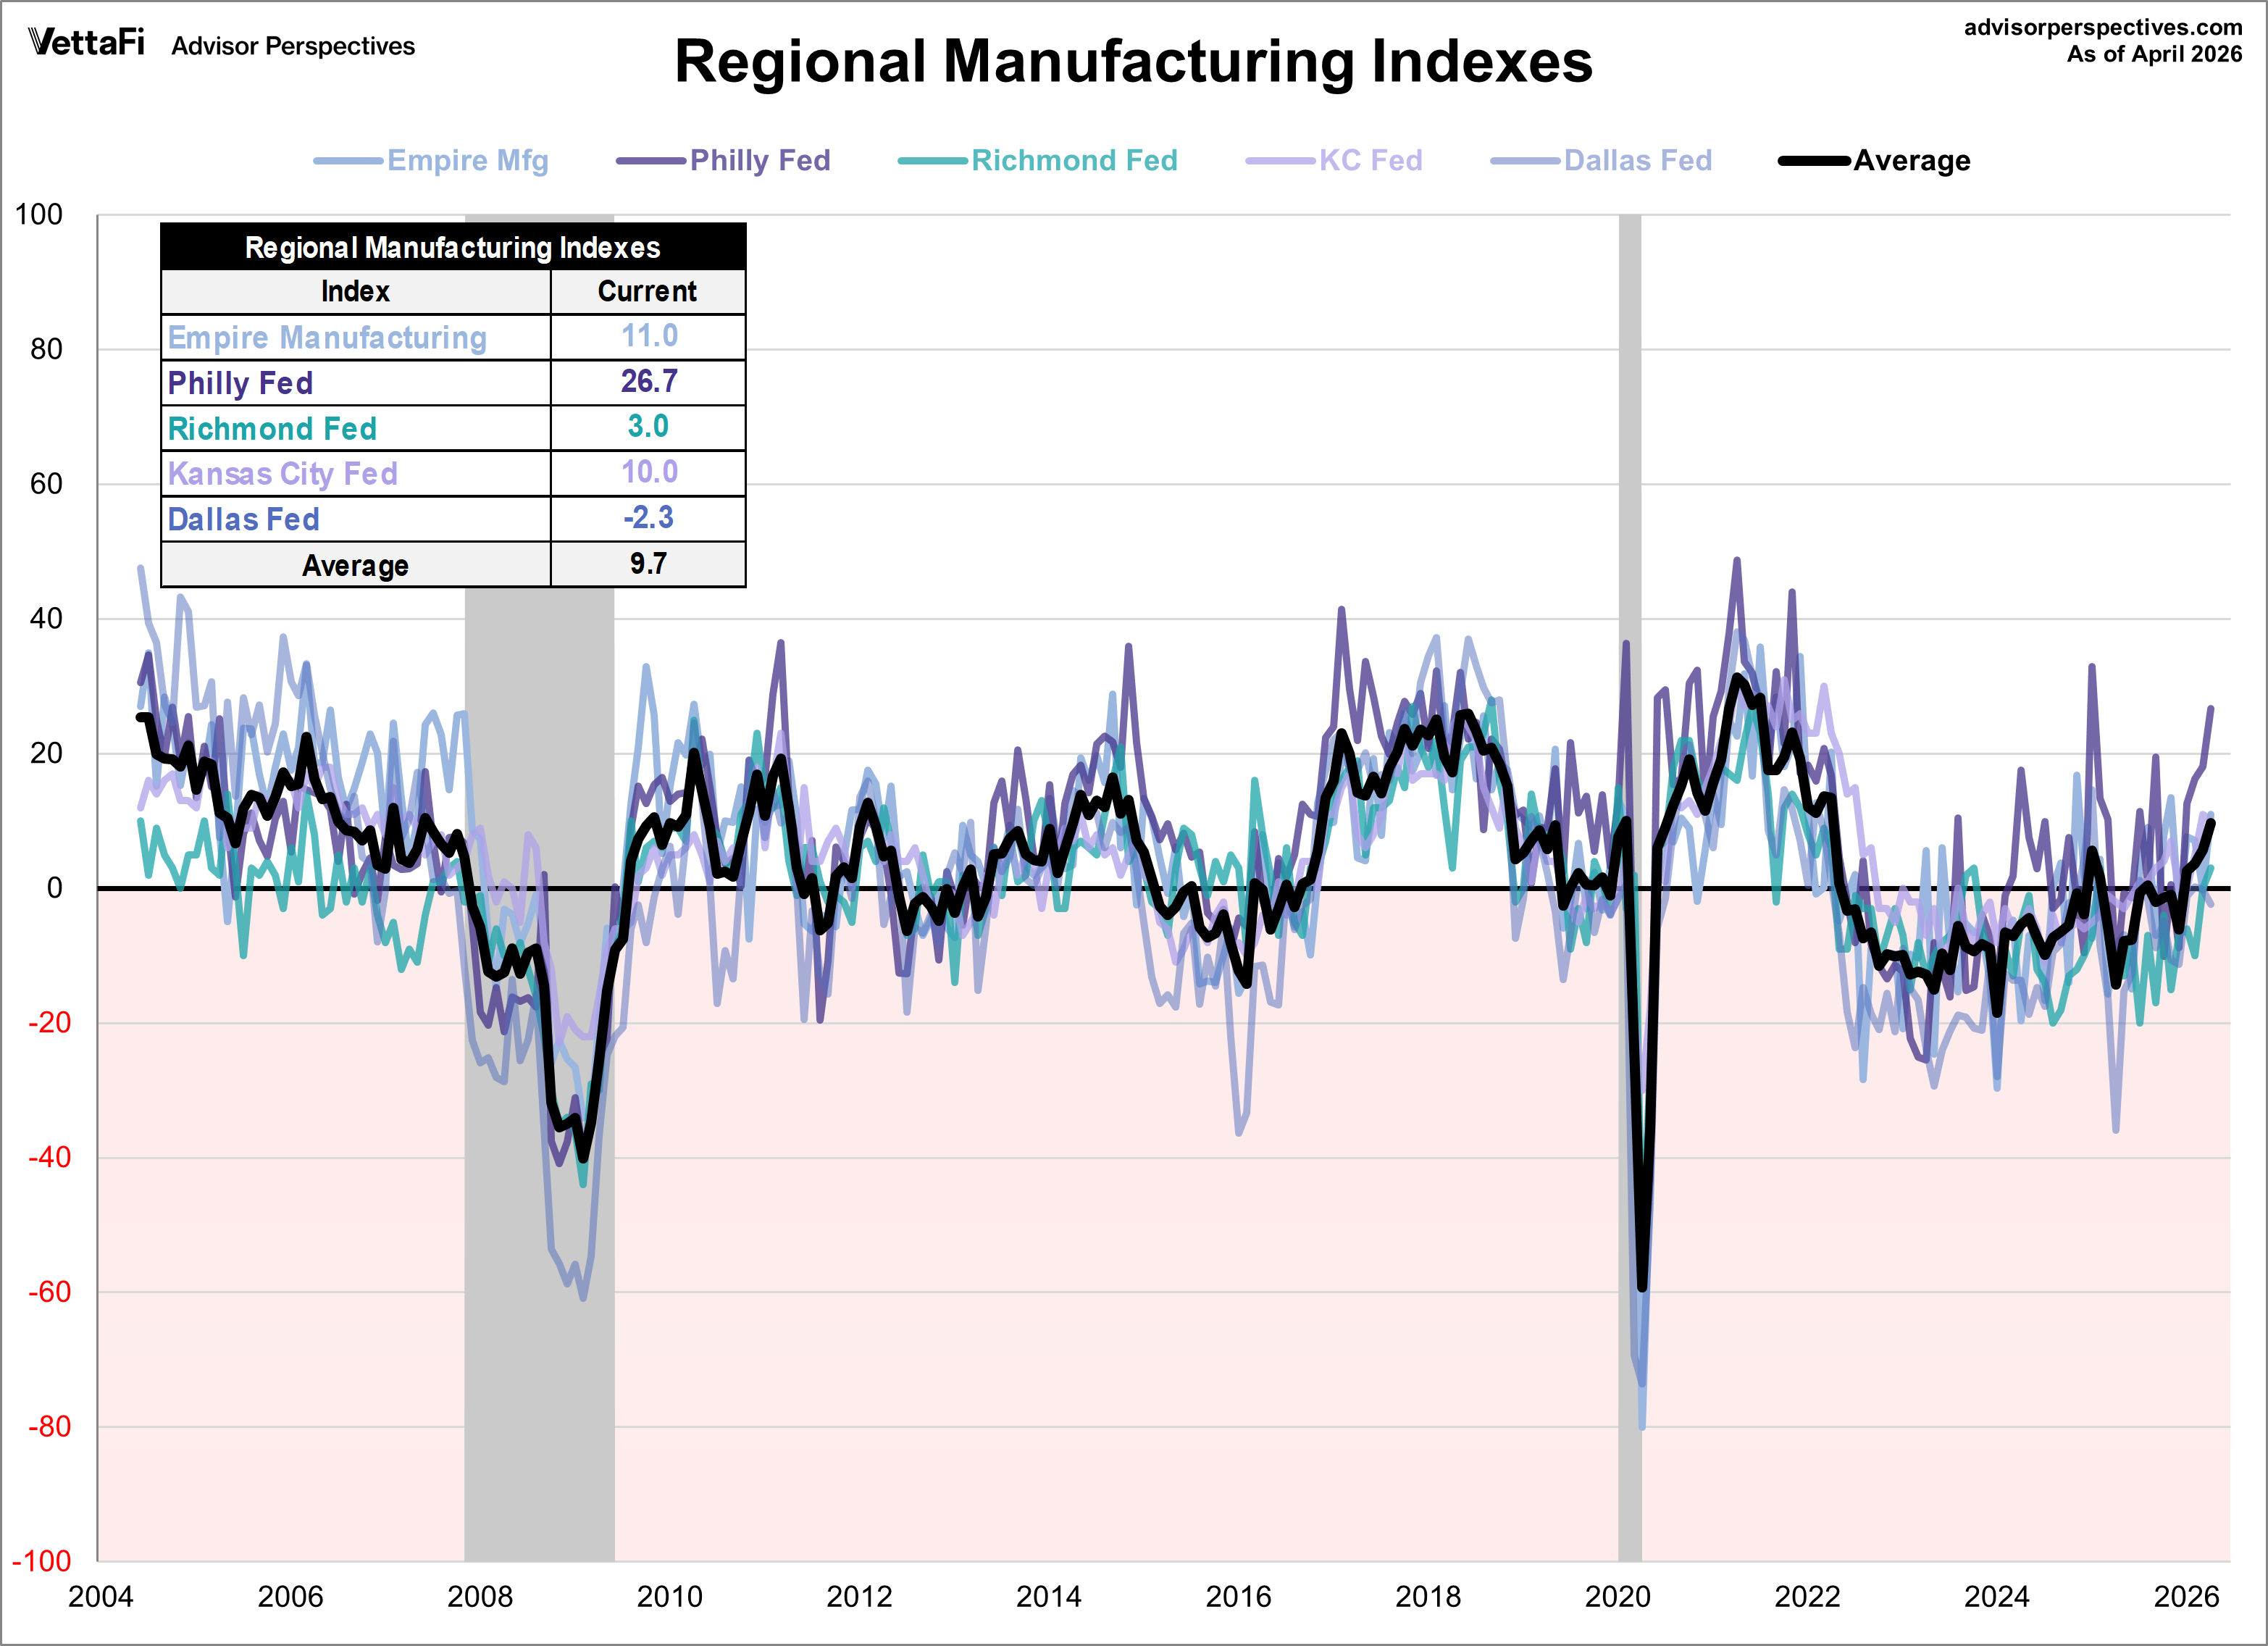
Let's compare all five regional manufacturing indicators. Here is a three-month moving average overlay of each since 2004 (for those with data).
Here is the same chart including the average of the five.
ETFs associated with industrials and manufacturing include: First Trust Industrials/Producer Durables AlphaDEX Fund (FXR), Industrial Select Sector SPDR Fund (XLI), Vanguard Industrials ETF (VIS), and iShares U.S. Industrials ETF (IYJ).
Here are the remaining four monthly manufacturing indicators that we track:
Kansas City Manufacturing Survey
Empire State Manufacturing Survey
Richmond Manufacturing Survey
Philadelphia Manufacturing Survey
Read more updates by Jen Nash