The Chicago Fed's National Activity Index is a monthly indicator designed to gauge overall economic activity and related inflationary pressure. It is a composite of 85 monthly indicators across four broad categories. The CFNAI is a forward-looking indicator that suggests how the economy will likely look in the near term and has been called one of the "most important and overlooked economic numbers". The index is constructed so a zero value for the index indicates that the national economy is expanding at its historical trend (average) rate of growth. Negative values indicate below-average growth, and positive values indicate above-average growth.
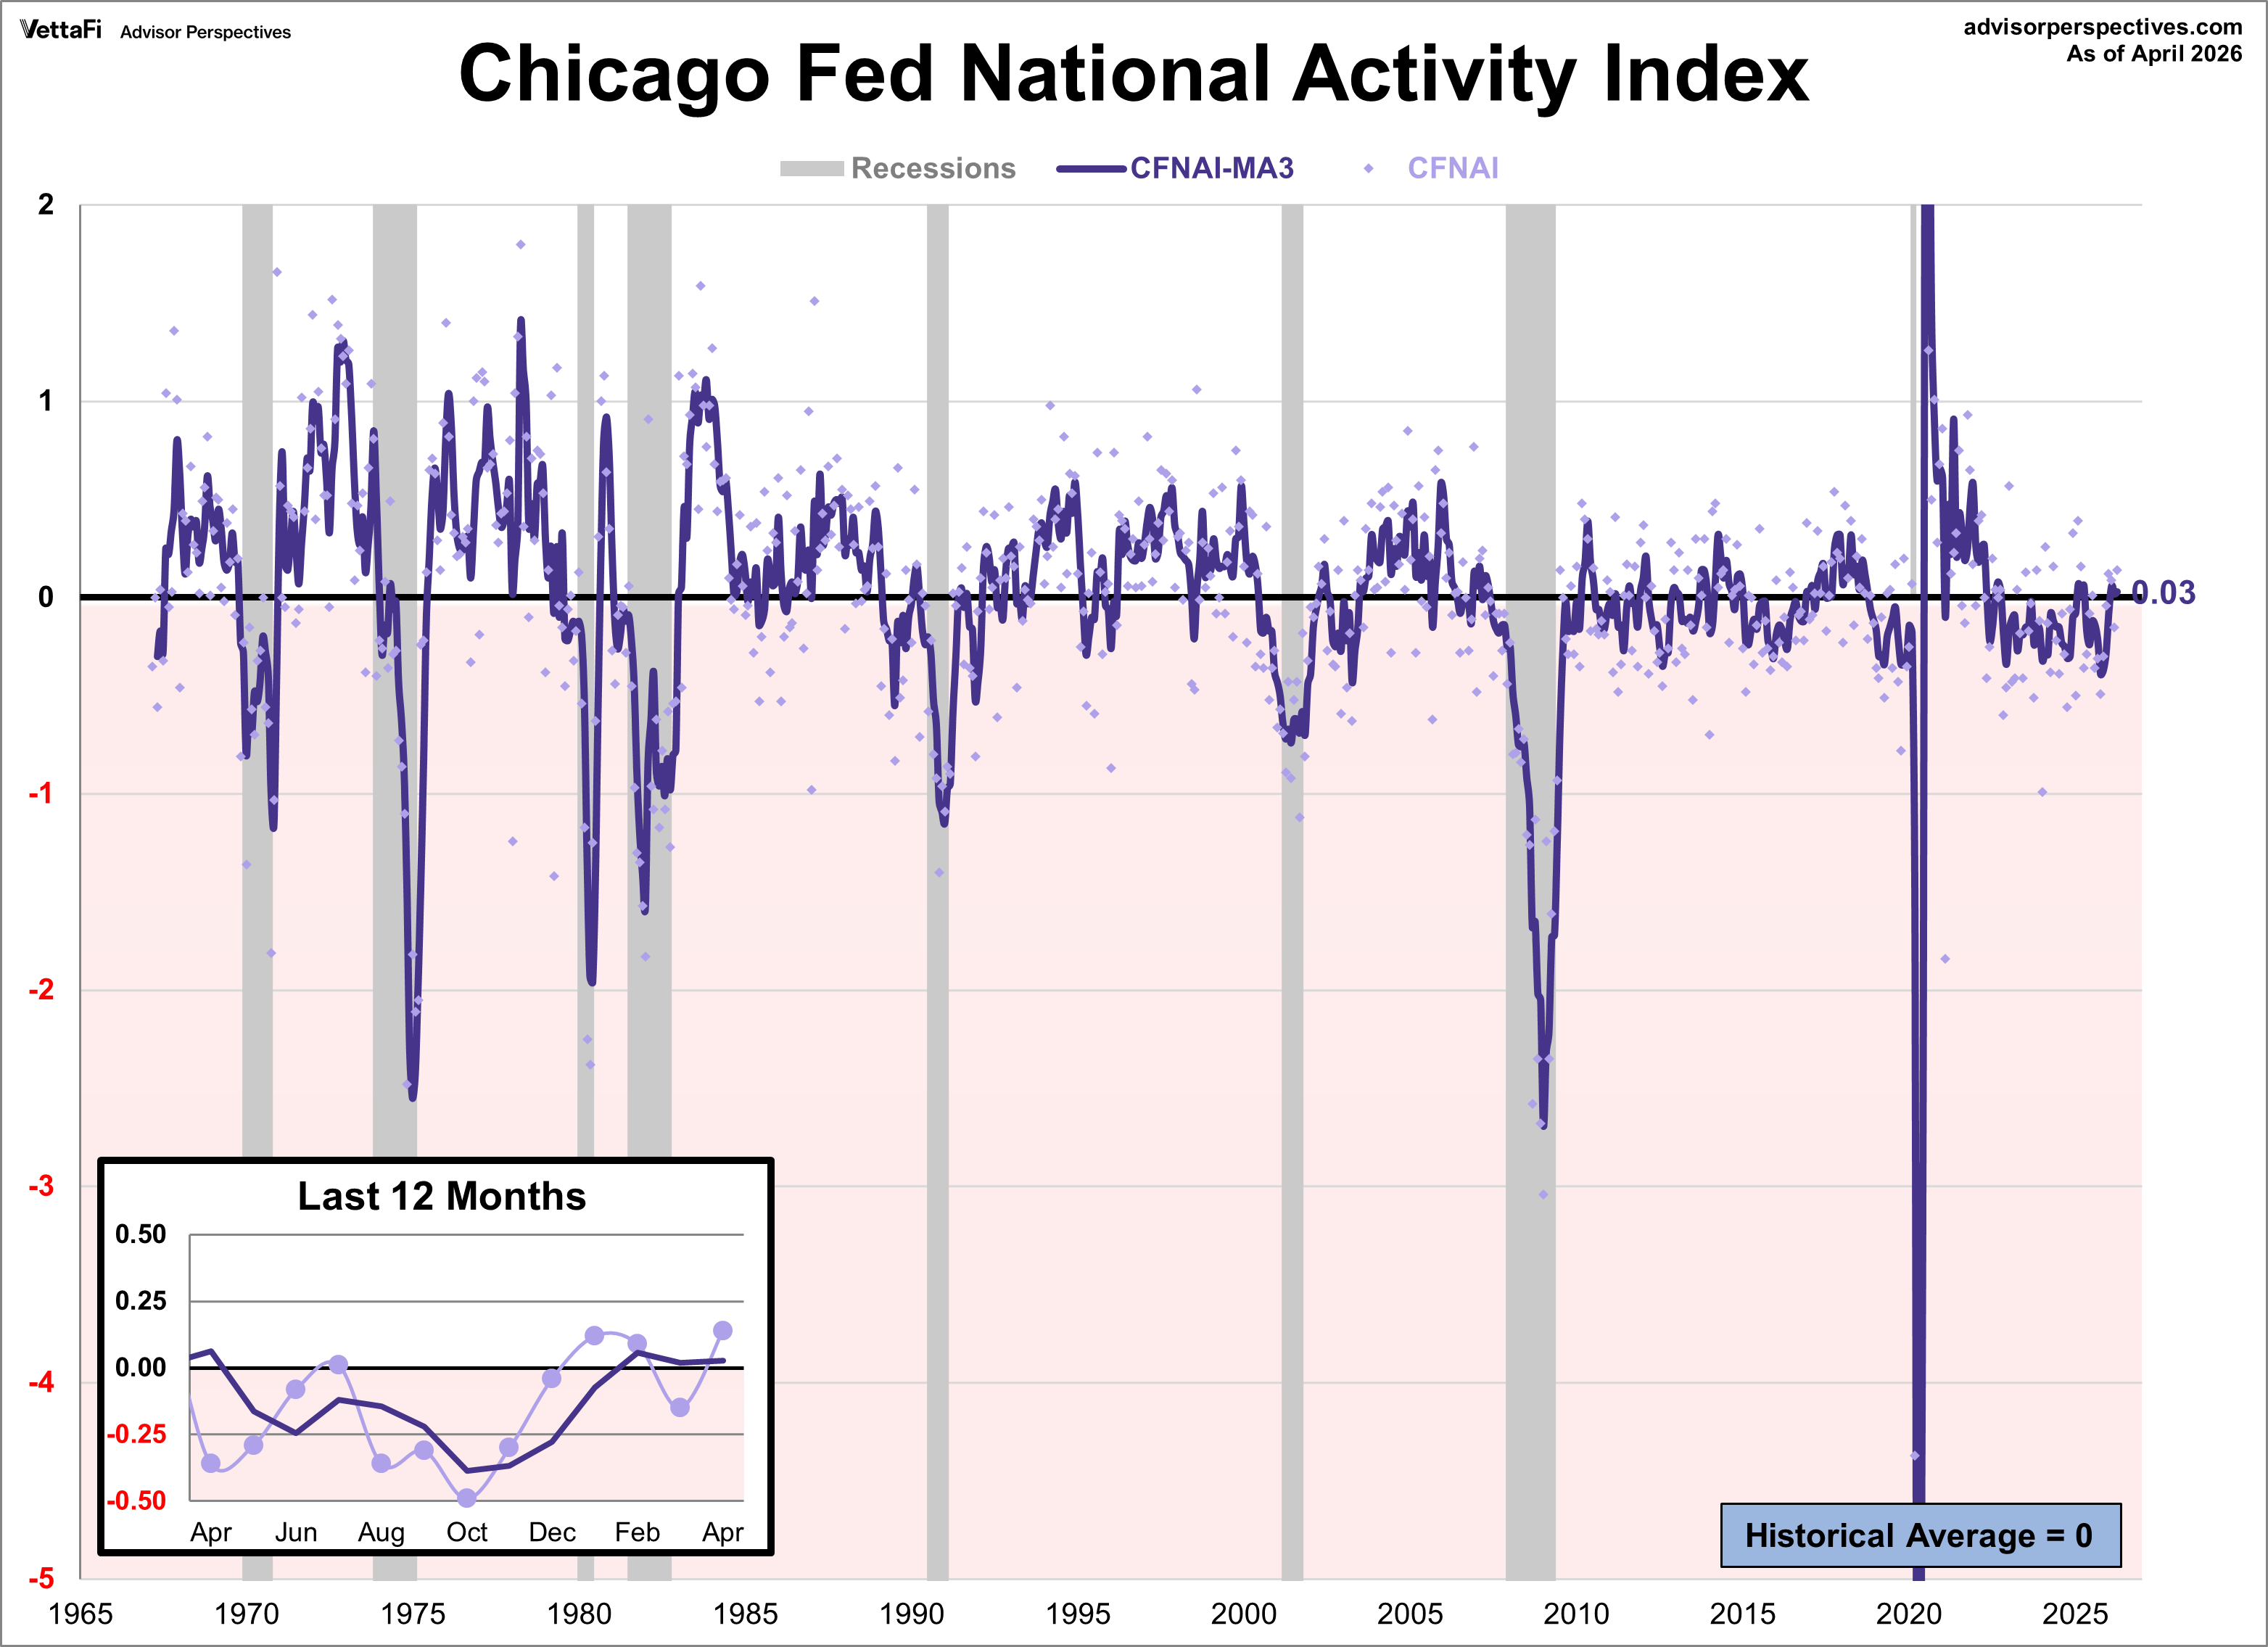
The Chicago Fed National Activity Index (CFNAI) rose to +0.14 in April from -0.15 in March. Two of the four broad categories of indicators used to construct the index increased from March, and two categories made positive contributions.
The first chart below shows the complete CFNAI historical series dating from March 1967 with a callout to the most recent 12 months. The dots show the indicator itself, which is quite noisy and volatile from month to month. The three-month moving average (CFNAI-MA3) is more useful and consistent as an indicator of the actual trend for economic activity. The index's three-month moving average, CFNAI-MA3, rose to +0.03 in April from +0.02 in March.

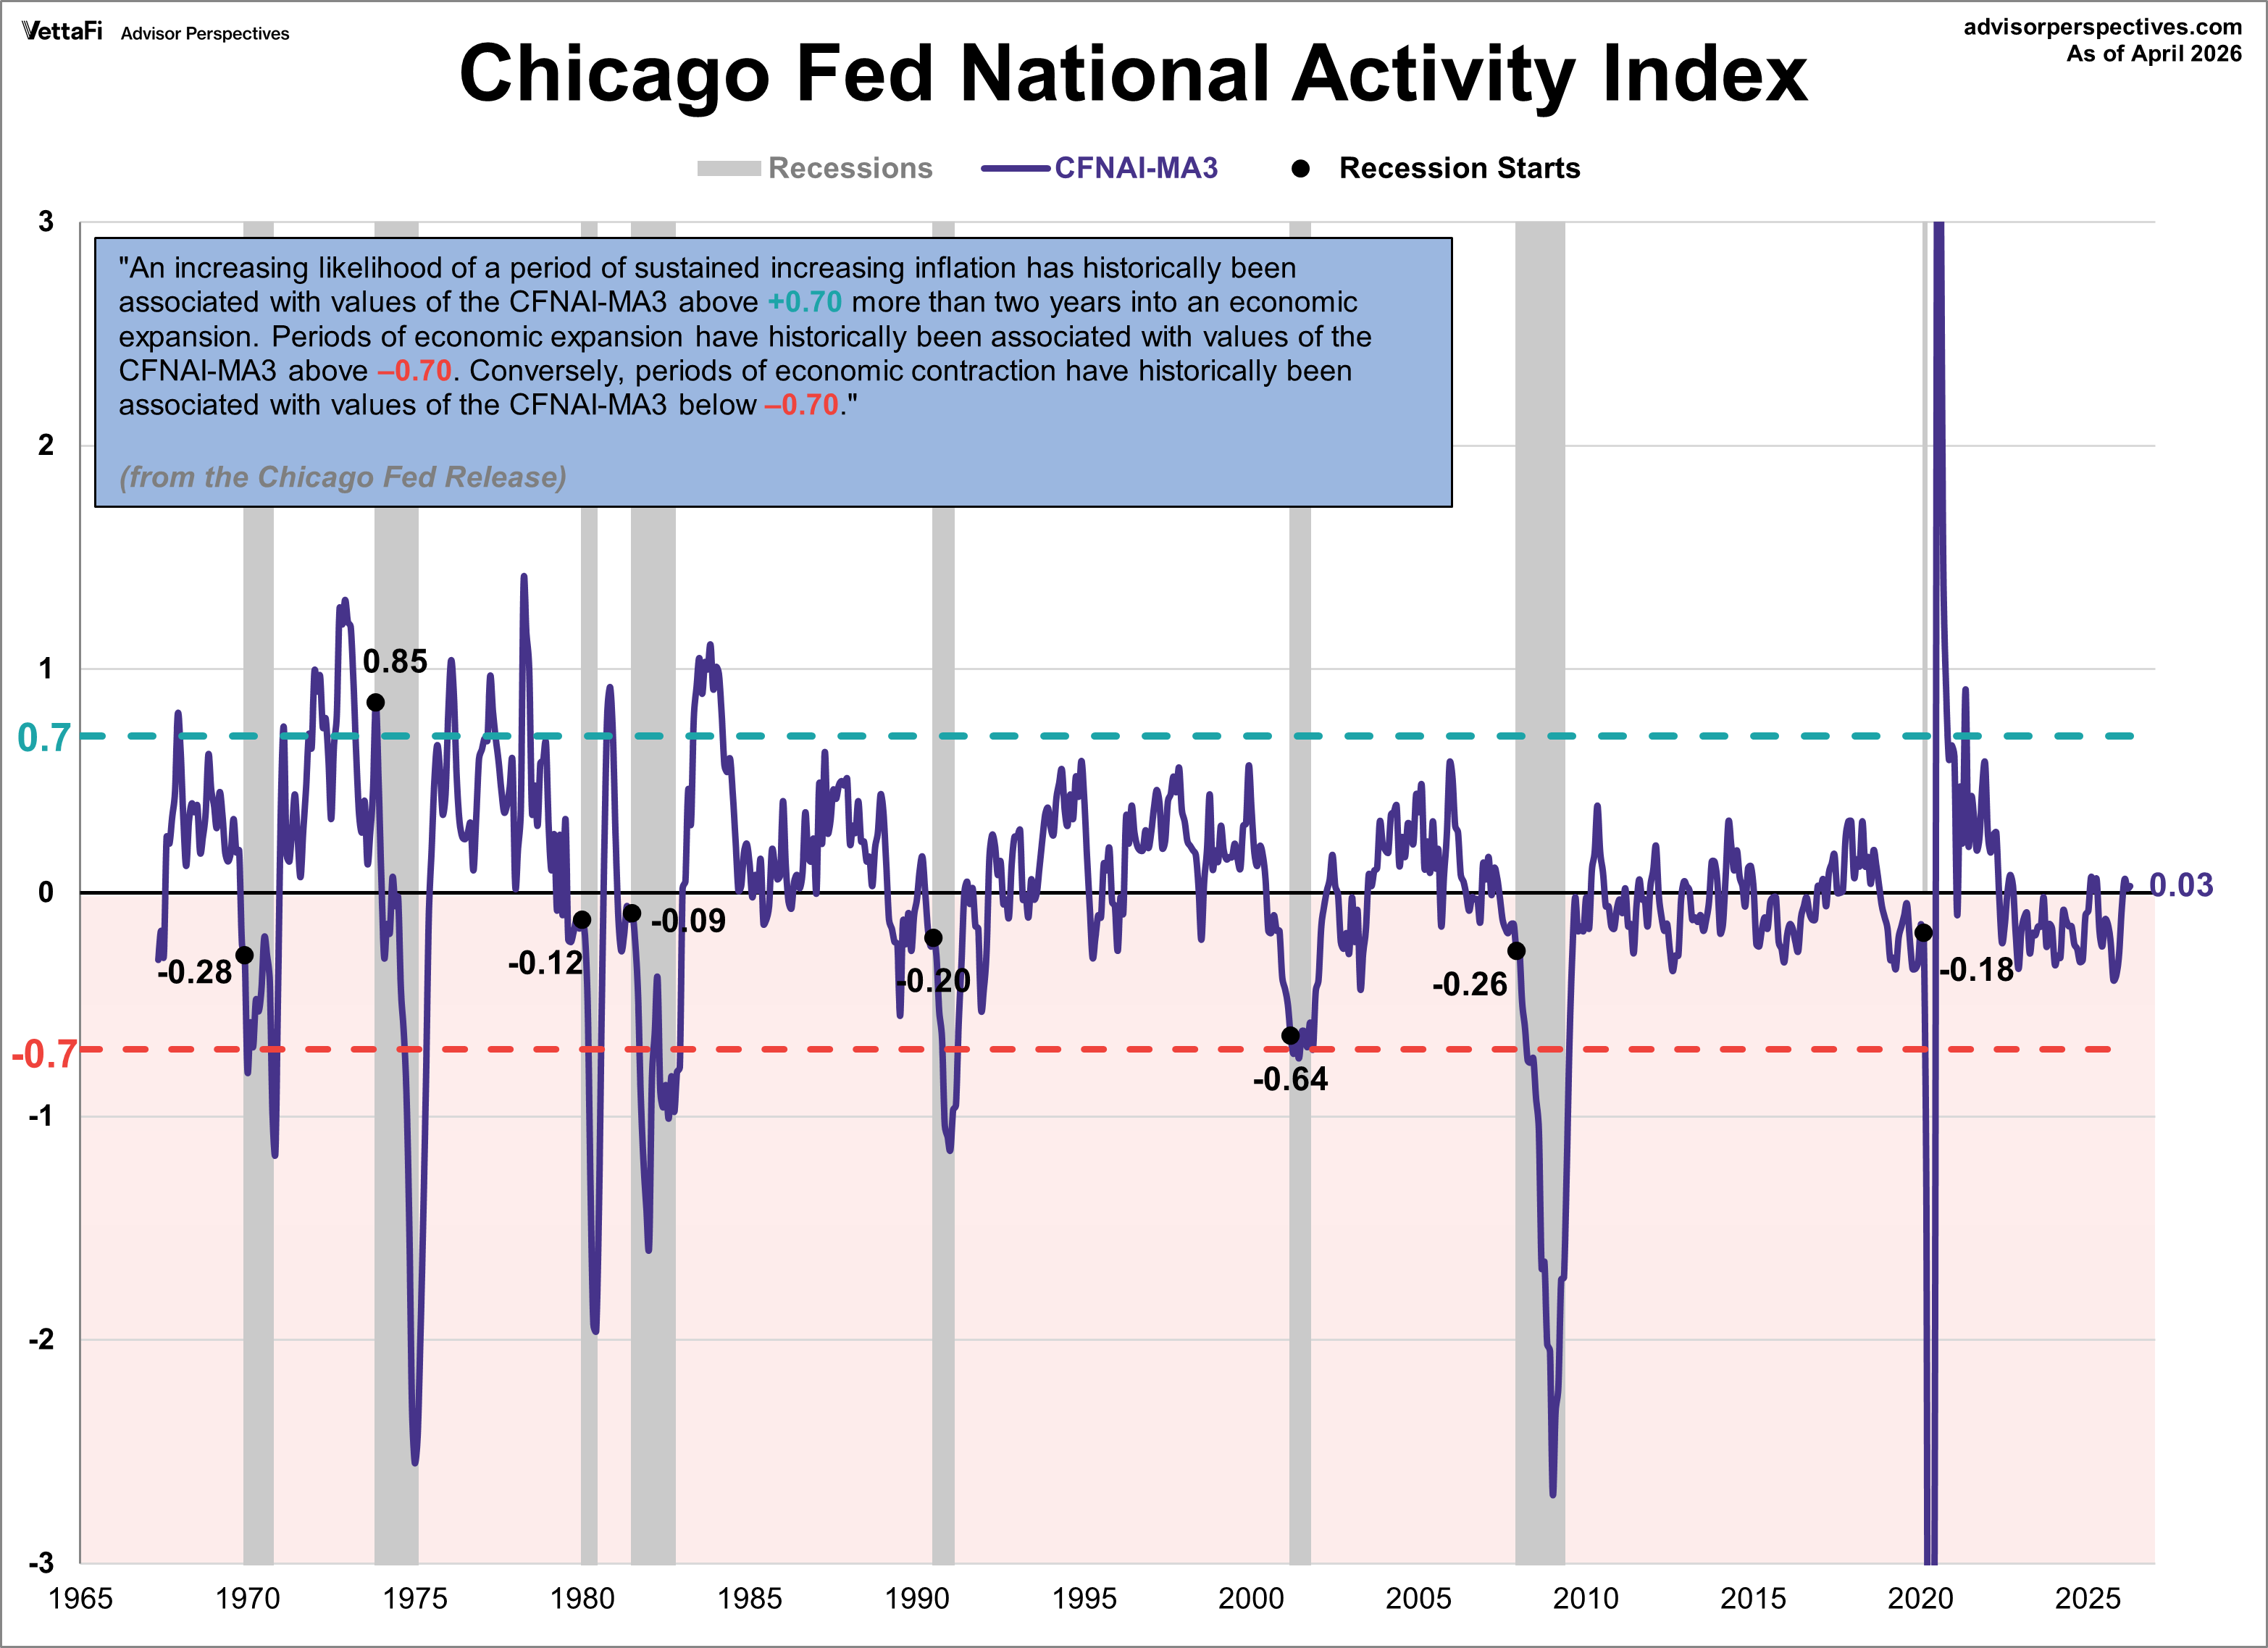
The next chart highlights the +0.7 and -0.7 levels. These levels are significant because the Chicago Fed has observed some important historical patterns around them, as explained by the callout in the chart below.
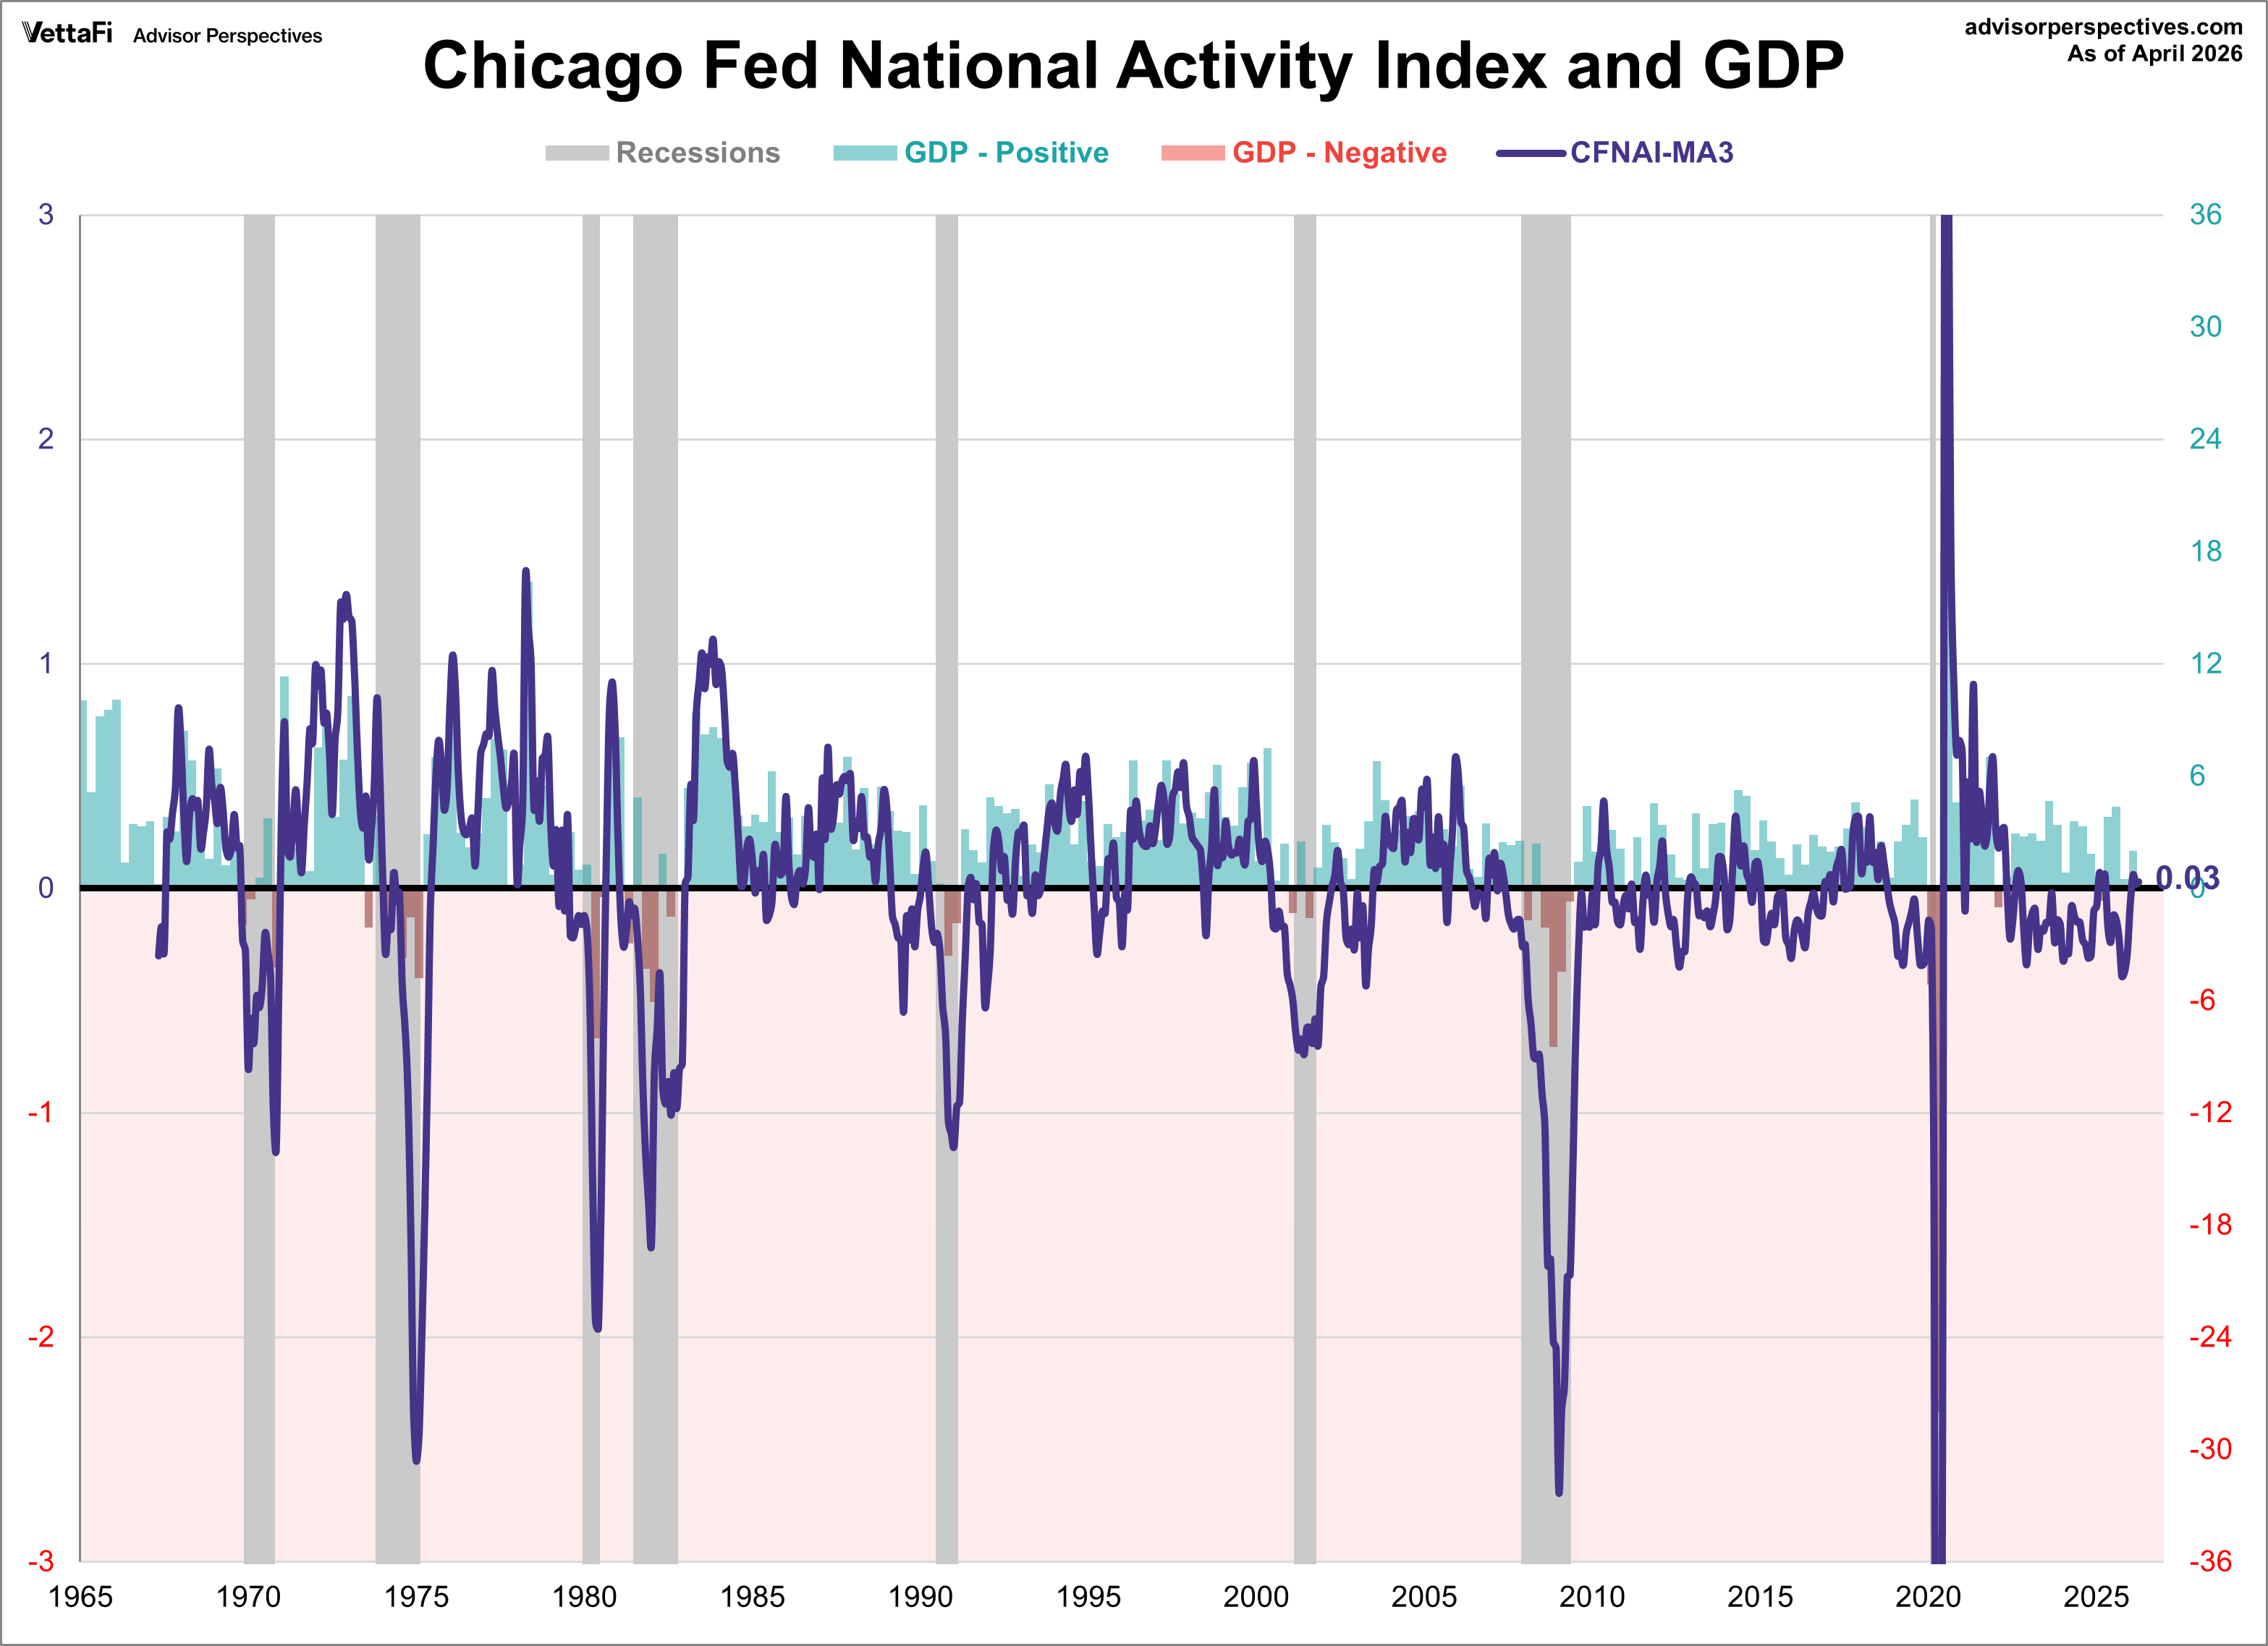
The next chart includes an overlay of GDP. For the most part, the CFNAI-MA3 has been positive while the economy has expanded and been negative while the economy contracts. Surprisingly, this was not the case over the past few years. The CFNAI-MA3 was negative from November 2022 through December 2024 while the U.S. economy expanded during that same time frame.
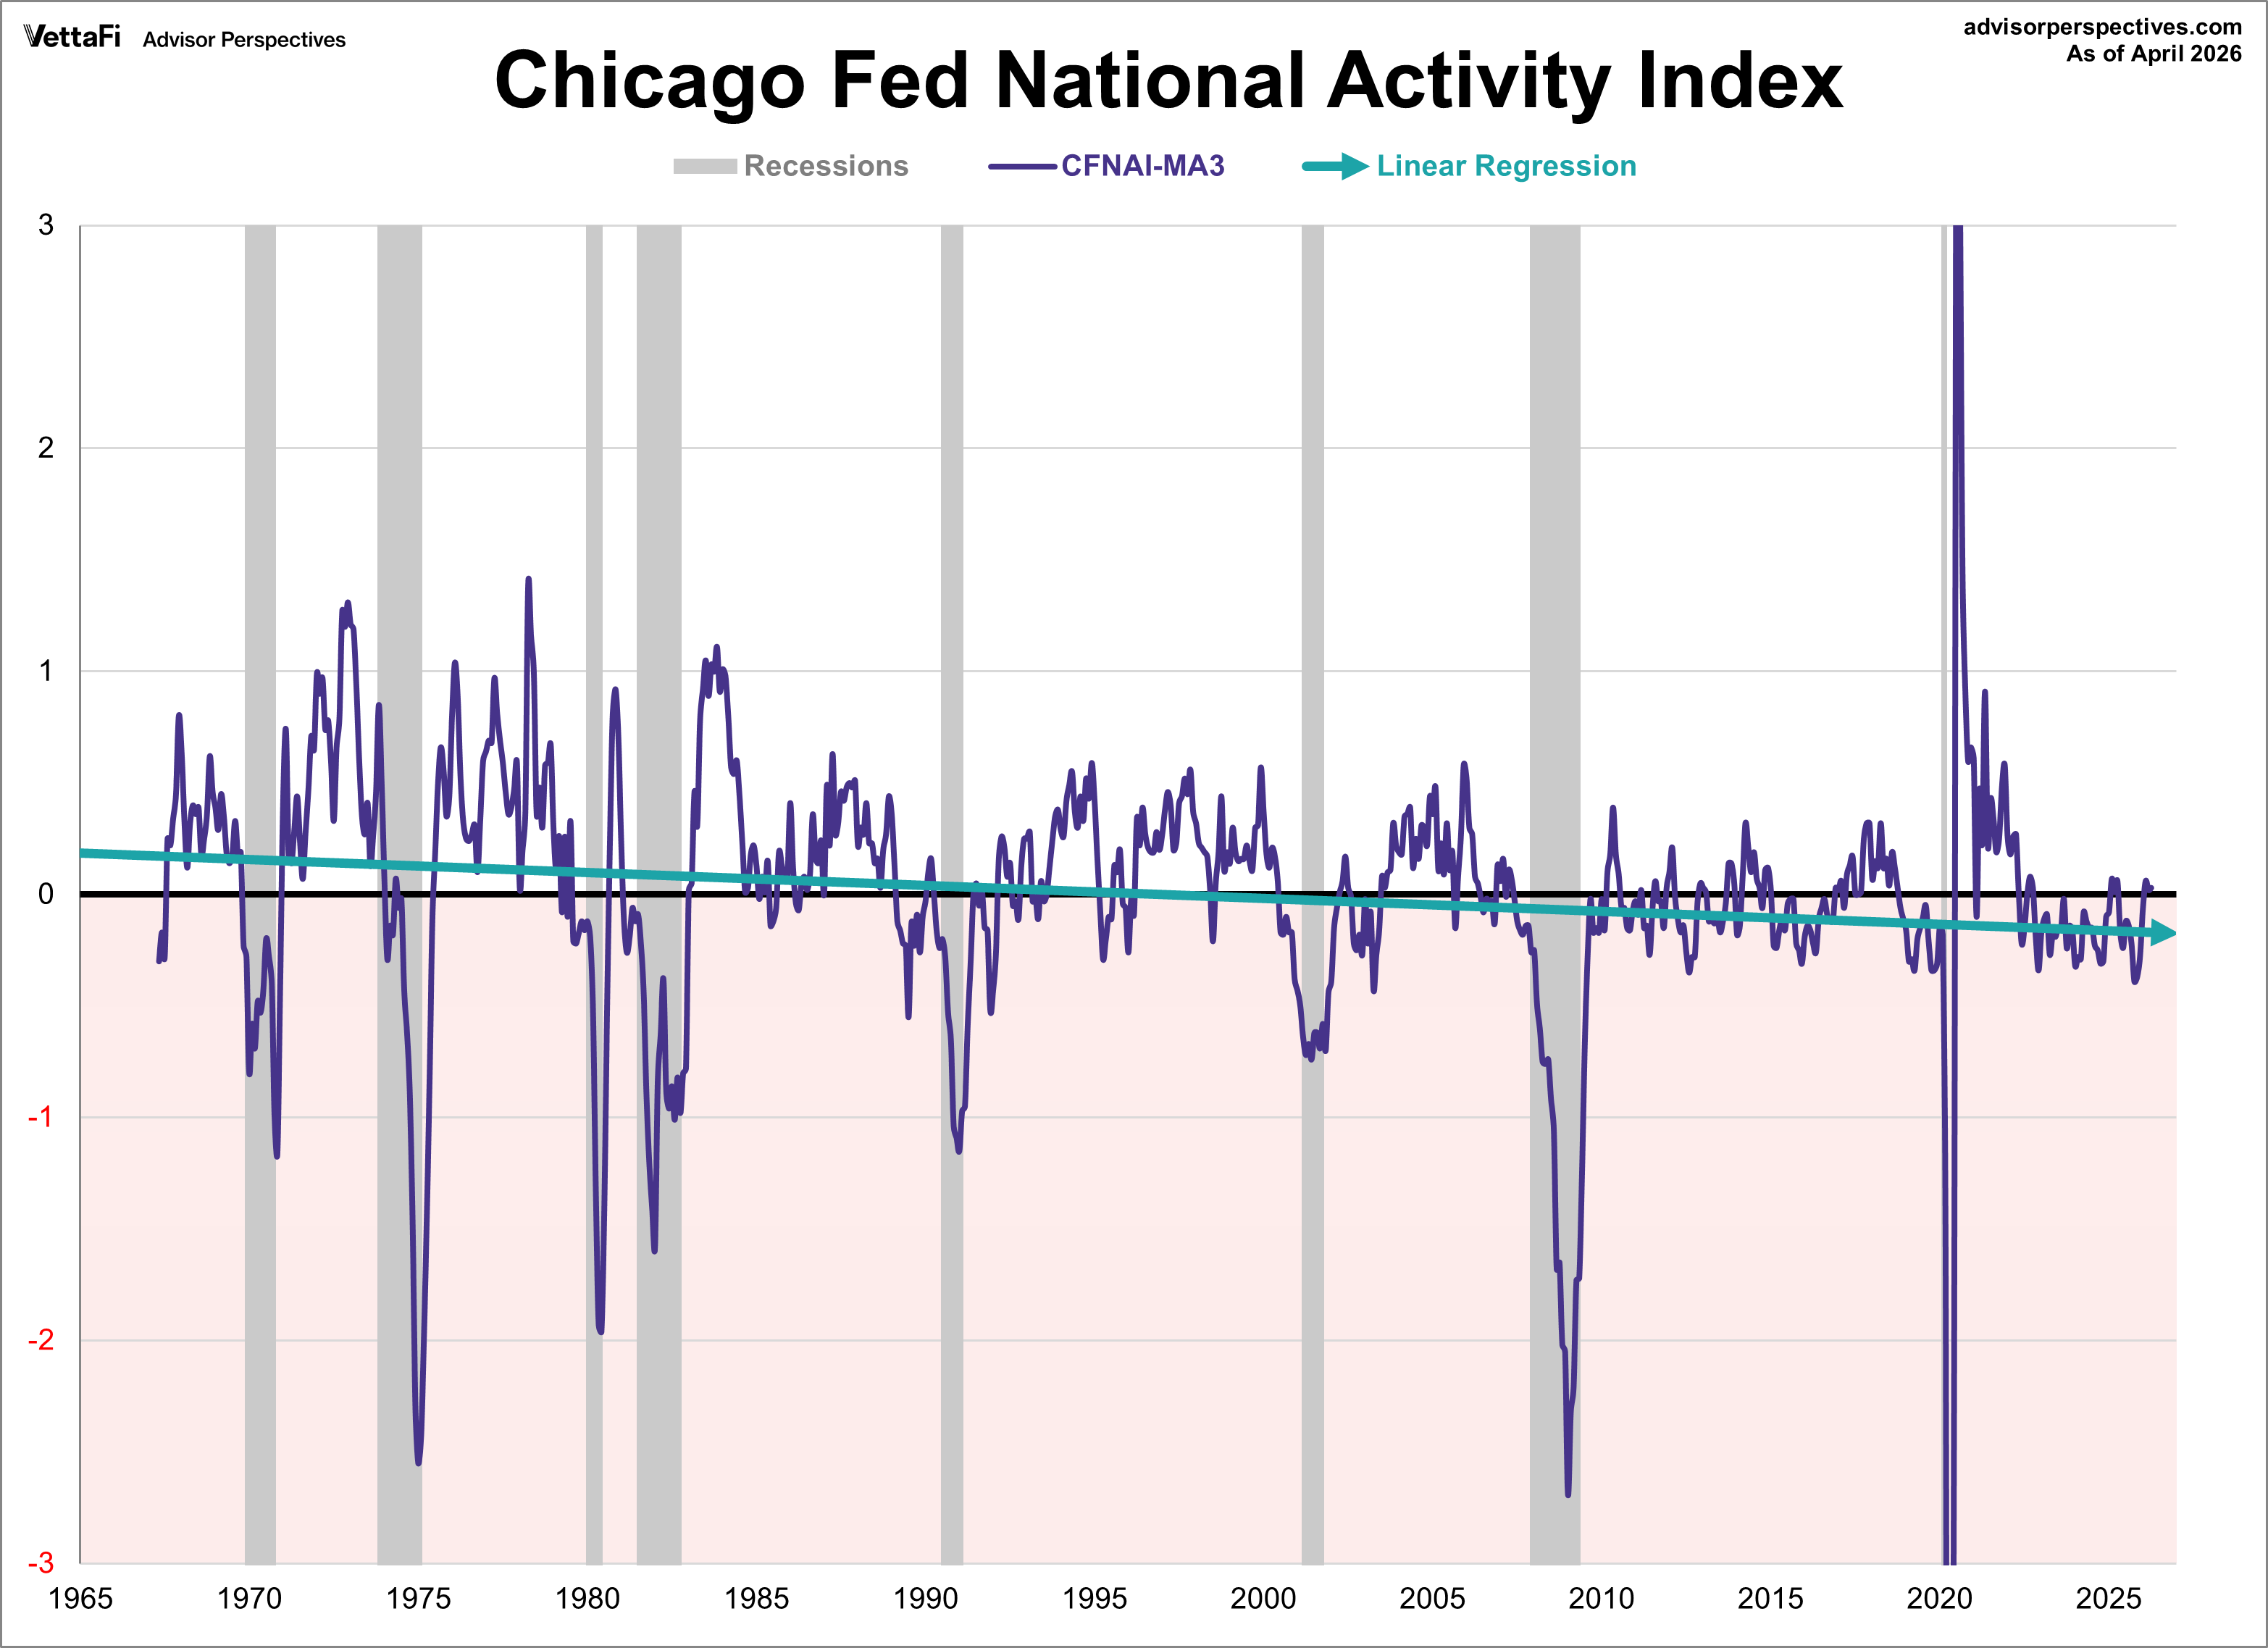
The Long-Term Economic Trend in the CFNAI
In the next chart, I've let Excel draw a linear regression through the CFNAI data series. The slope confirms the casual impression of the previous charts that national activity, as a function of the 85 indicators in the index, has been declining since its inception in the late 1960s, a trend that roughly coincides with the transition from a good-producing to a post-industrial service economy in the information age.
Chicago Fed National Activity Index Component Breakdown
The Chicago Fed's National Activity Index is based on 85 economic indicators drawn from four broad categories of data:
- Production and income
- Sales, orders, and inventories
- Personal consumption and housing
- Employment, unemployment, and hours
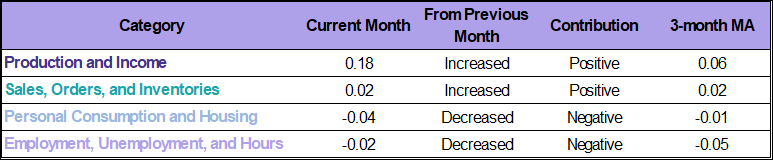
As stated earlier, two of the four broad categories of indicators used to construct the index increased from March, and two categories made positive contributions.
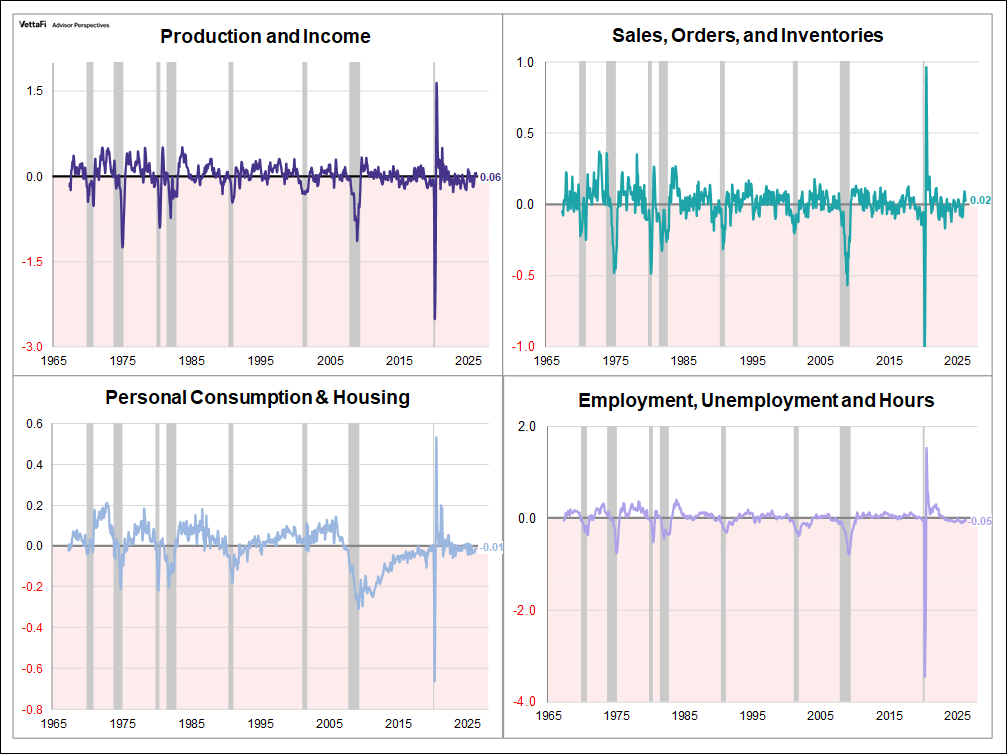
The next set of charts show each of the four components since 1967. Because of the highly volatile nature of the data, the charts are based on three-month moving averages, a smoothing strategy favored by the Chicago Fed economists.
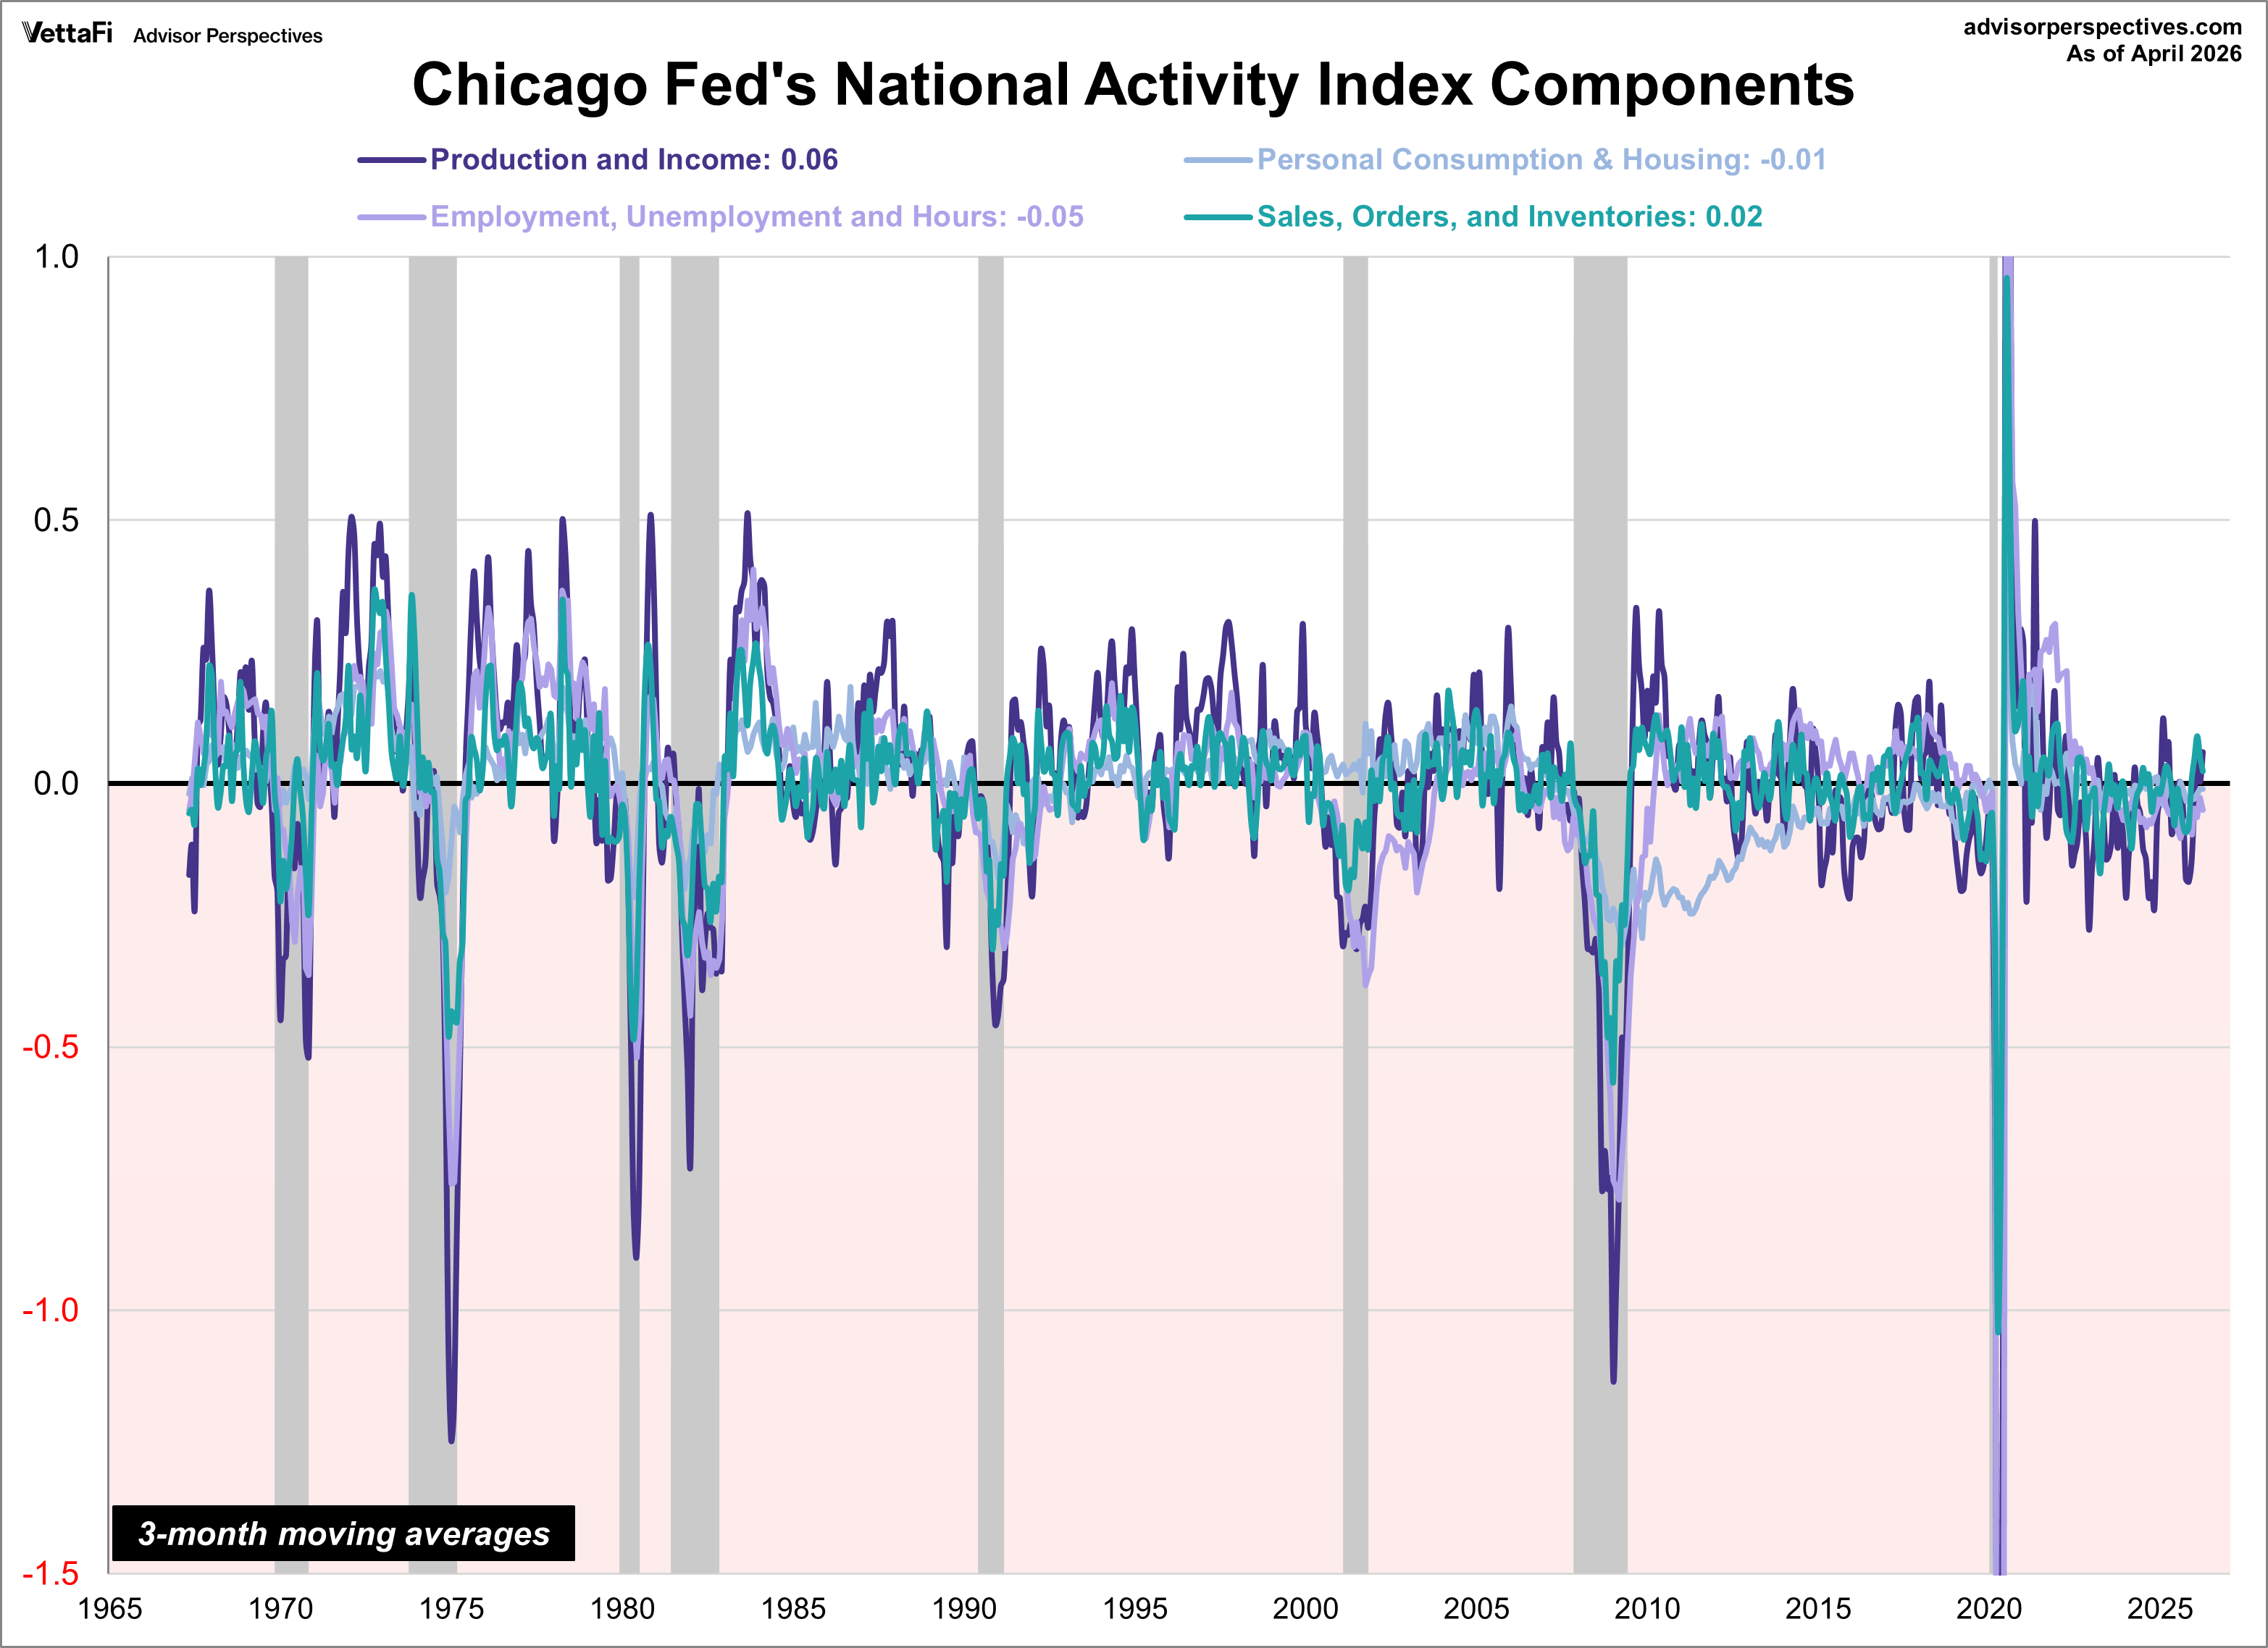
To close, let's overlay the four components of the index to see how these pieces have moved together over time. As you can see, there's a clear tendency for these components to rise and fall in sync, indicating how interconnected different sectors of the economy are. However, it's also important to note the differences in their volatility. "Production and income" tends to experience the most dramatic swings, reaching the highest highs and the lowest lows. On the other side, "personal consumption and housing" exhibits the least volatility. And lastly, it appears "employment, unemployment, and hours" and "sales, orders, and inventories", to no surprise, are the two components that move the most in step with each other.
So, while the CFNAI might not grab headlines like GDP or inflation, it provides a valuable, comprehensive look at the U.S. economy's underlying health and can offer crucial insights into potential economic shifts.
Read more updates by Jen Nash