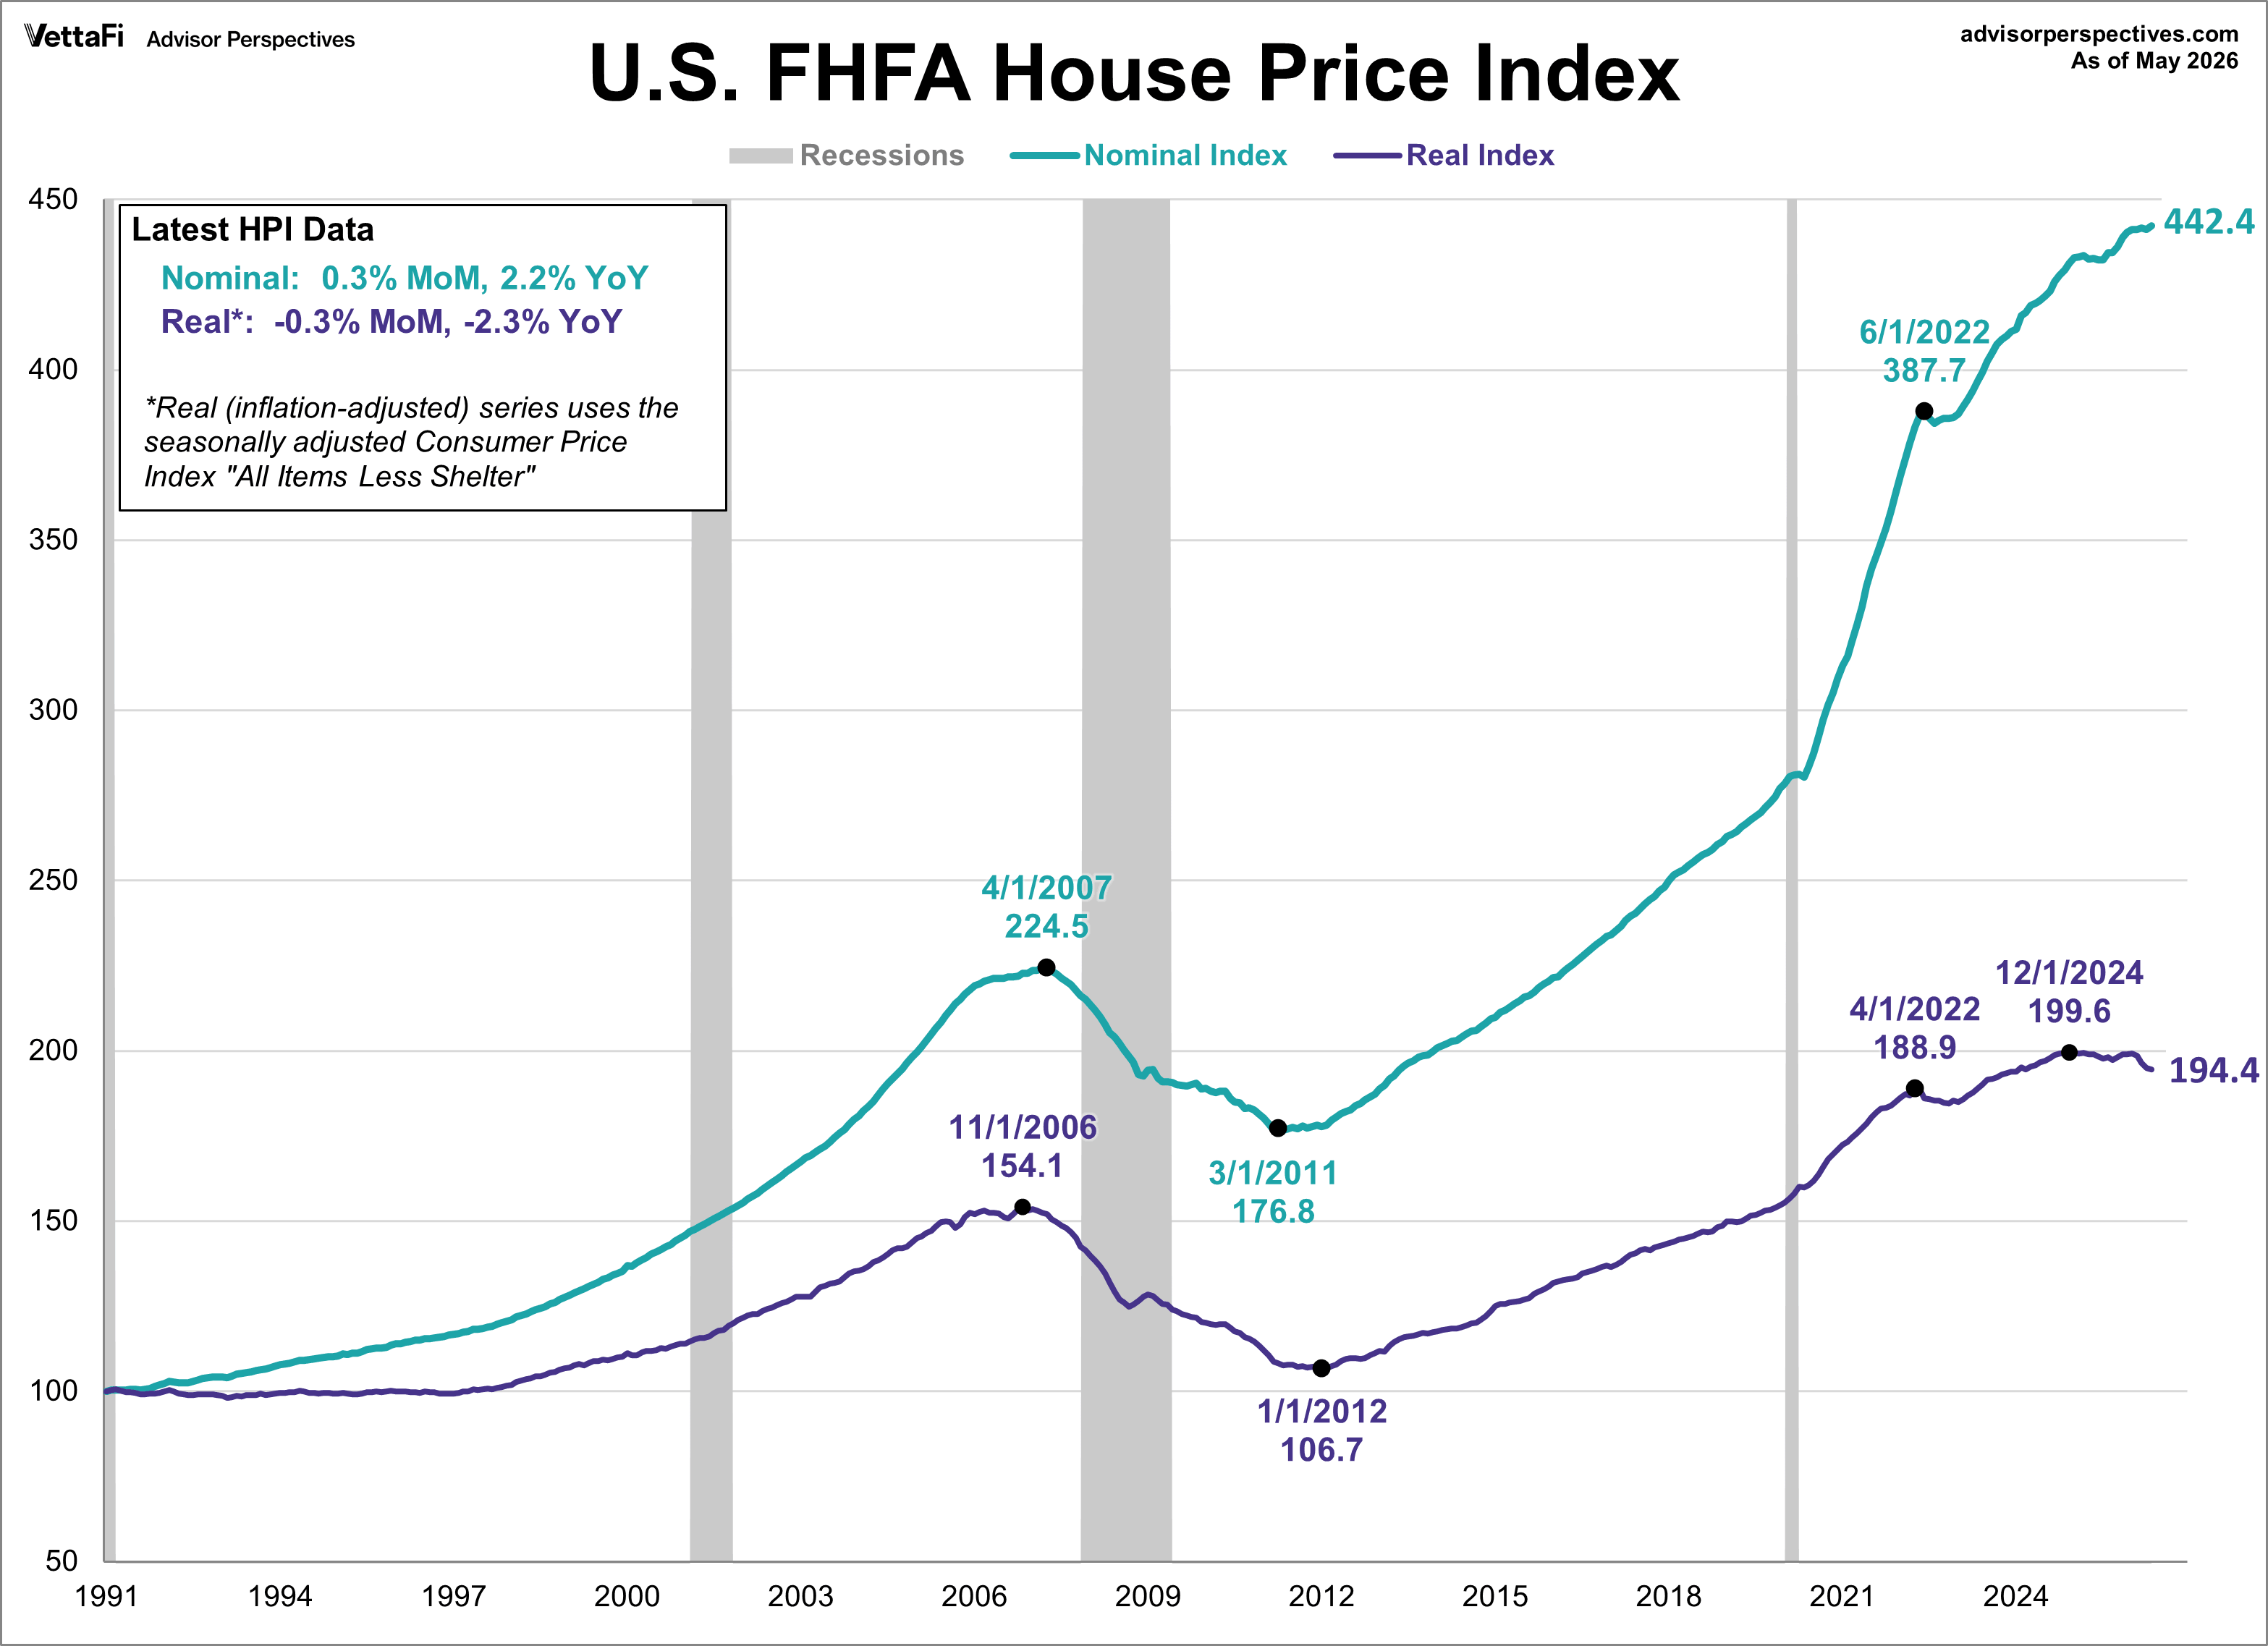
The Federal Housing Finance Agency (FHFA) House Price Index (HPI) rose more than expected in May, reaching a new record high of 442.4. The index was up 0.3% from the previous month, beating the expected 0.1% growth. Compared to one year ago, the index is up 2.2%. However, when adjusted for inflation, the real HPI fell 0.3% month-over-month to 194.4, its lowest level since January 2024. Real home prices are down 2.3% compared to a year ago, marking the ninth consecutive month of annual depreciation in real home prices.
FHFA House Price Index
The FHFA House Price Index is a measure of the change in prices of single-family homes, using data from Fannie Mae and Freddie Mac. It helps to analyze the strength of the US housing market by watching the rise and fall of prices. As prices increase so does consumer confidence. Conversely, as prices decrease, consumer confidence declines as well.
The chart below illustrates the monthly HPI series along with a real (inflation-adjusted) series using the Consumer Price Index: All Items Less Shelter. The nominal HPI is currently at its all-time high while the real HPI is 2.57% below its all-time high from December 2024.

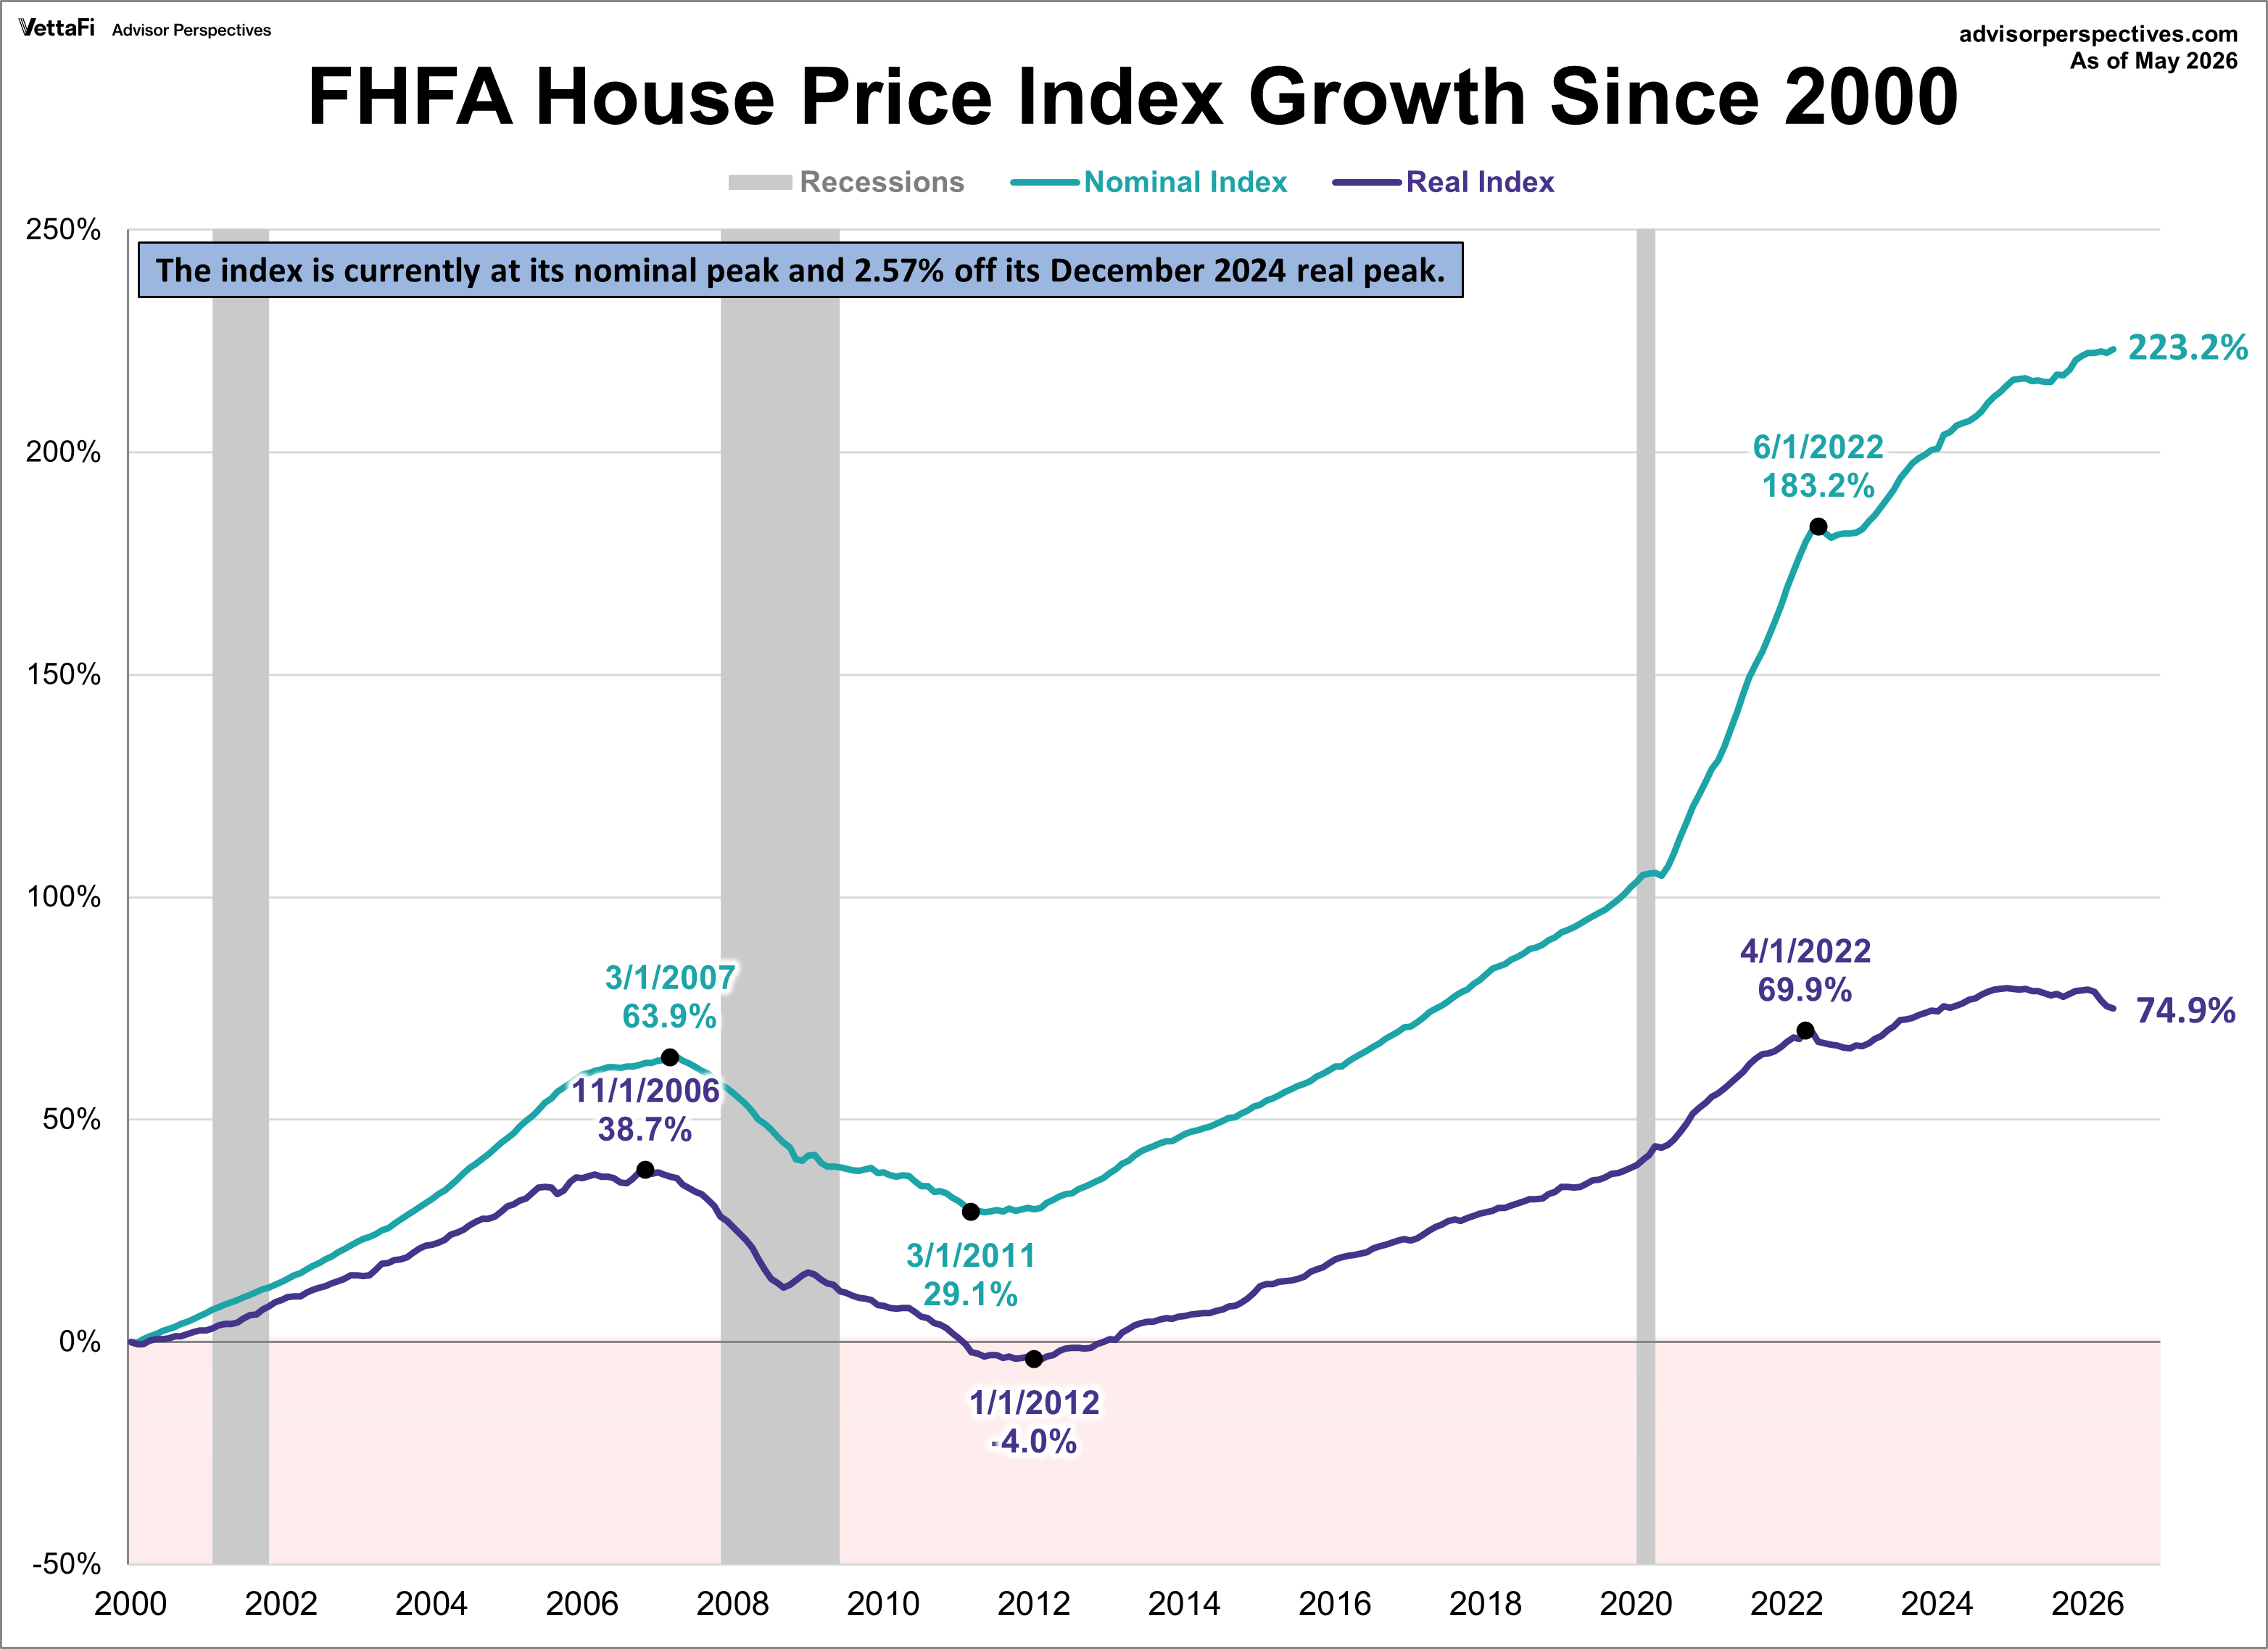
The next chart shows the growth of the nominal and real index since the turn of the century. The nominal index has grown 223% since 2000 while the real index's growth is much lower, at 75%.
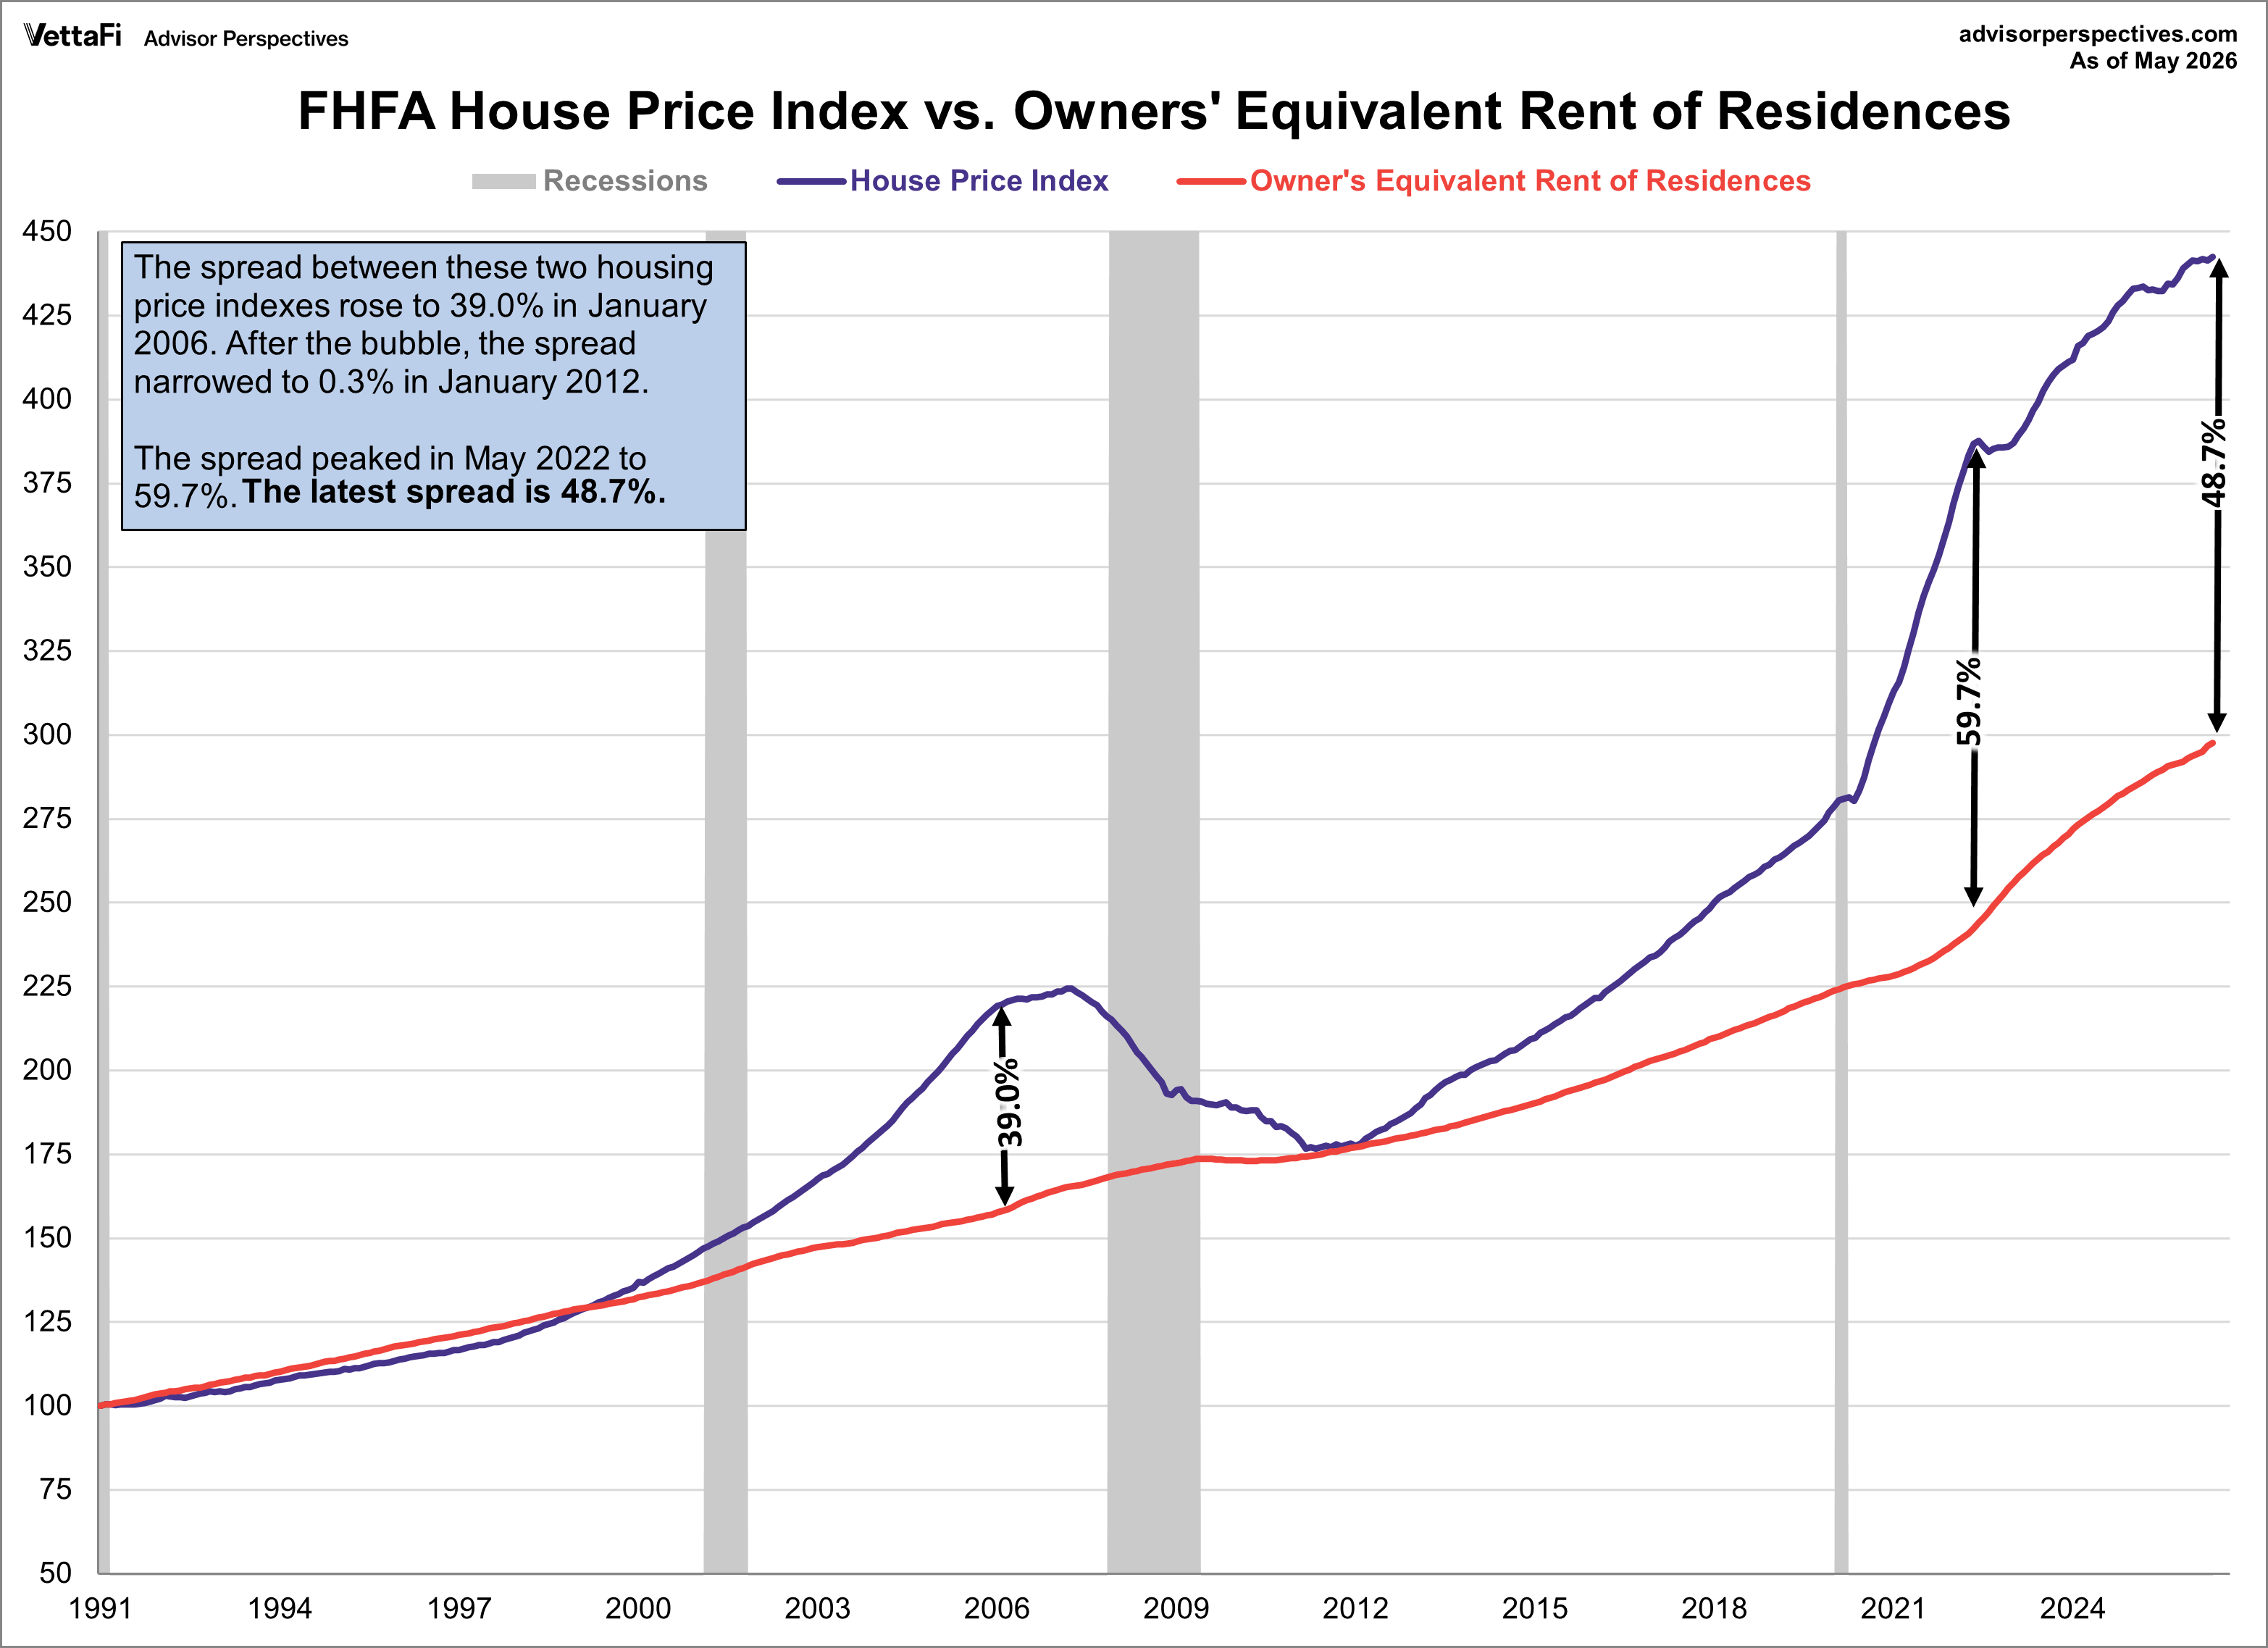
House Price Index vs. Owners' Equivalent Rent of Residences
For an interesting comparison, let's overlay the HPI and the most closely matching sub-component of the CPI, owners' equivalent rent of residences (OER). OER measures how much monthly rent that would have to be paid in order to substitute a currently owned house as a rental property.
HPI and OER moved in close parallel from the 1991 inception date of the former until early 1999. At which point the two parted company and HPI began accelerating into the housing bubble. HPI then fell over the next 48 months to its 2011-2012 trough. Confirmation of the "bubble" designation for house prices is the 39.0% spread between HPI and OER in January 2006. Are we in another housing bubble? The spread is currently at 48.7%, exceeding the "bubble designation" just mentioned. The spread was the widest in May 2022 at 59.7%.
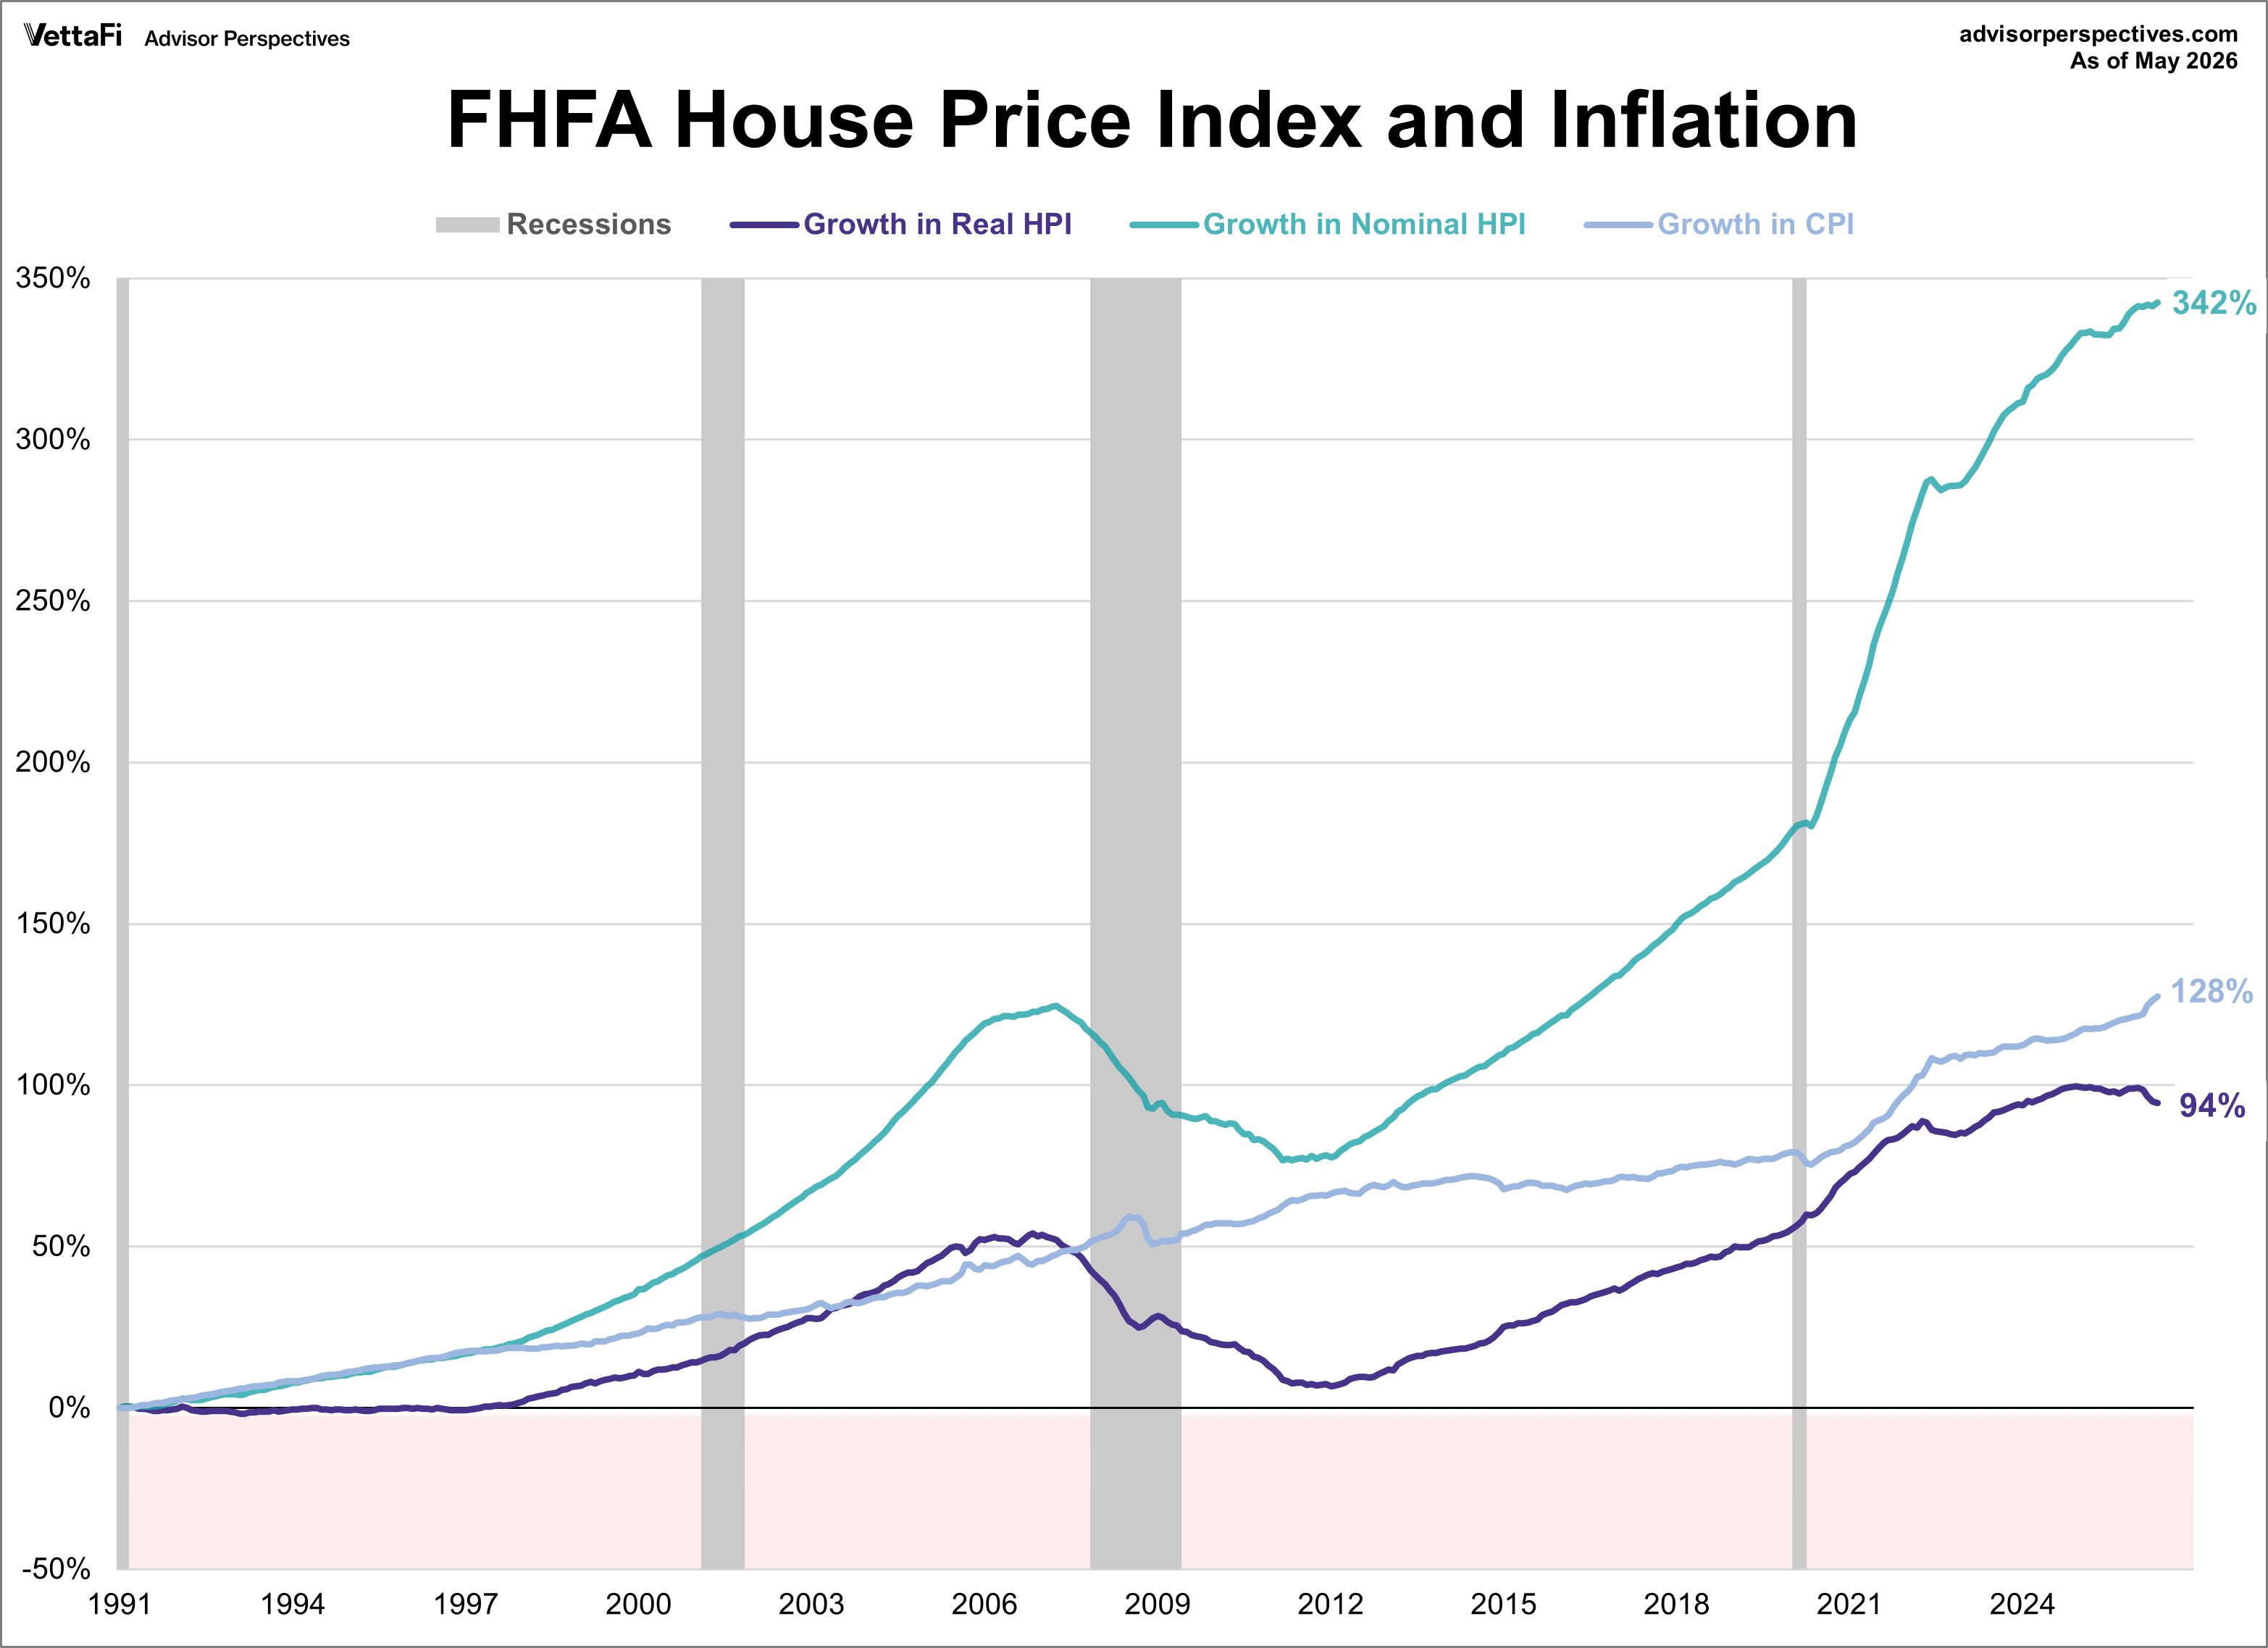
Here we compare the CPI for all urban consumers to both the nominal and real house price index, which is a similar comparison to what I do in our Case-Shiller update. Nominal HPI growth has clearly taken off since 2012. However, when adjusted for inflation, the house price index has been increasing at a rate more closely aligned with CPI growth.
ETFs associated with residential real-estate include: iShares Residential and Multisector Real Estate ETF (REZ).
For additional perspectives on residential real estate, here is the complete list of our monthly updates:
Read more updates by Jen Nash