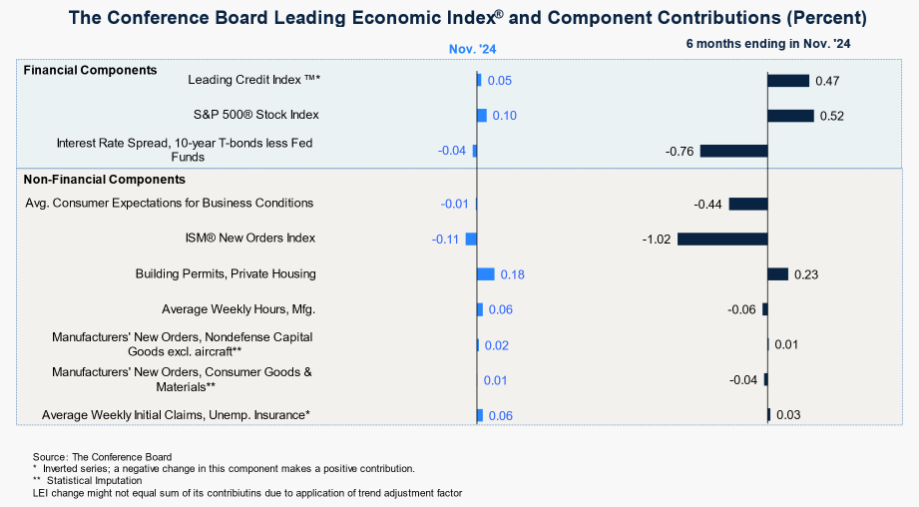
The latest Conference Board Leading Economic Index (LEI) increased slightly in November. The index rose 0.3% from the previous month to 99.7 after eight consecutive monthly declines.
“The US LEI rose in November for the first time since February 2022,” said Justyna Zabinska-La Monica, Senior Manager, Business Cycle Indicators, at The Conference Board. “A rebound in building permits, continued support from equities, improvement in average hours worked in manufacturing, and fewer initial unemployment claims boosted the LEI in November. It’s worth noting that gains in building permits were not widespread geographically or by building type; they were concentrated mainly to the Northeast and Midwest, and on buildings with 5+ units rather than single-family dwellings. Overall, the rise in LEI is a positive sign for future economic activity in the US. The Conference Board currently forecasts US GDP to expand by 2.7% in 2024, but growth to slow to 2.0% in 2025.“ More
Background on the Conference Board Leading Economic Index® (LEI)
The LEI is a composite index of several indicators. It is a predictive variable that anticipates, or leads, turning points in the business cycle and anticipates where the economy is heading. Since the LEI is comprised of multiple components, it is meant to provide a clearer picture as it is able to smooth out volatility associated with individual components. The ten components of Conference Board LEI include: Average weekly hours in manufacturing; Average weekly initial claims for unemployment insurance; Manufacturers’ new orders for consumer goods and materials; ISM® Index of New Orders; Manufacturers’ new orders for nondefense capital goods excluding aircraft orders; Building permits for new private housing units; S&P 500® Index of Stock Prices; Leading Credit Index™; Interest rate spread (10-year Treasury bonds less federal funds rate); Average consumer expectations for business conditions.

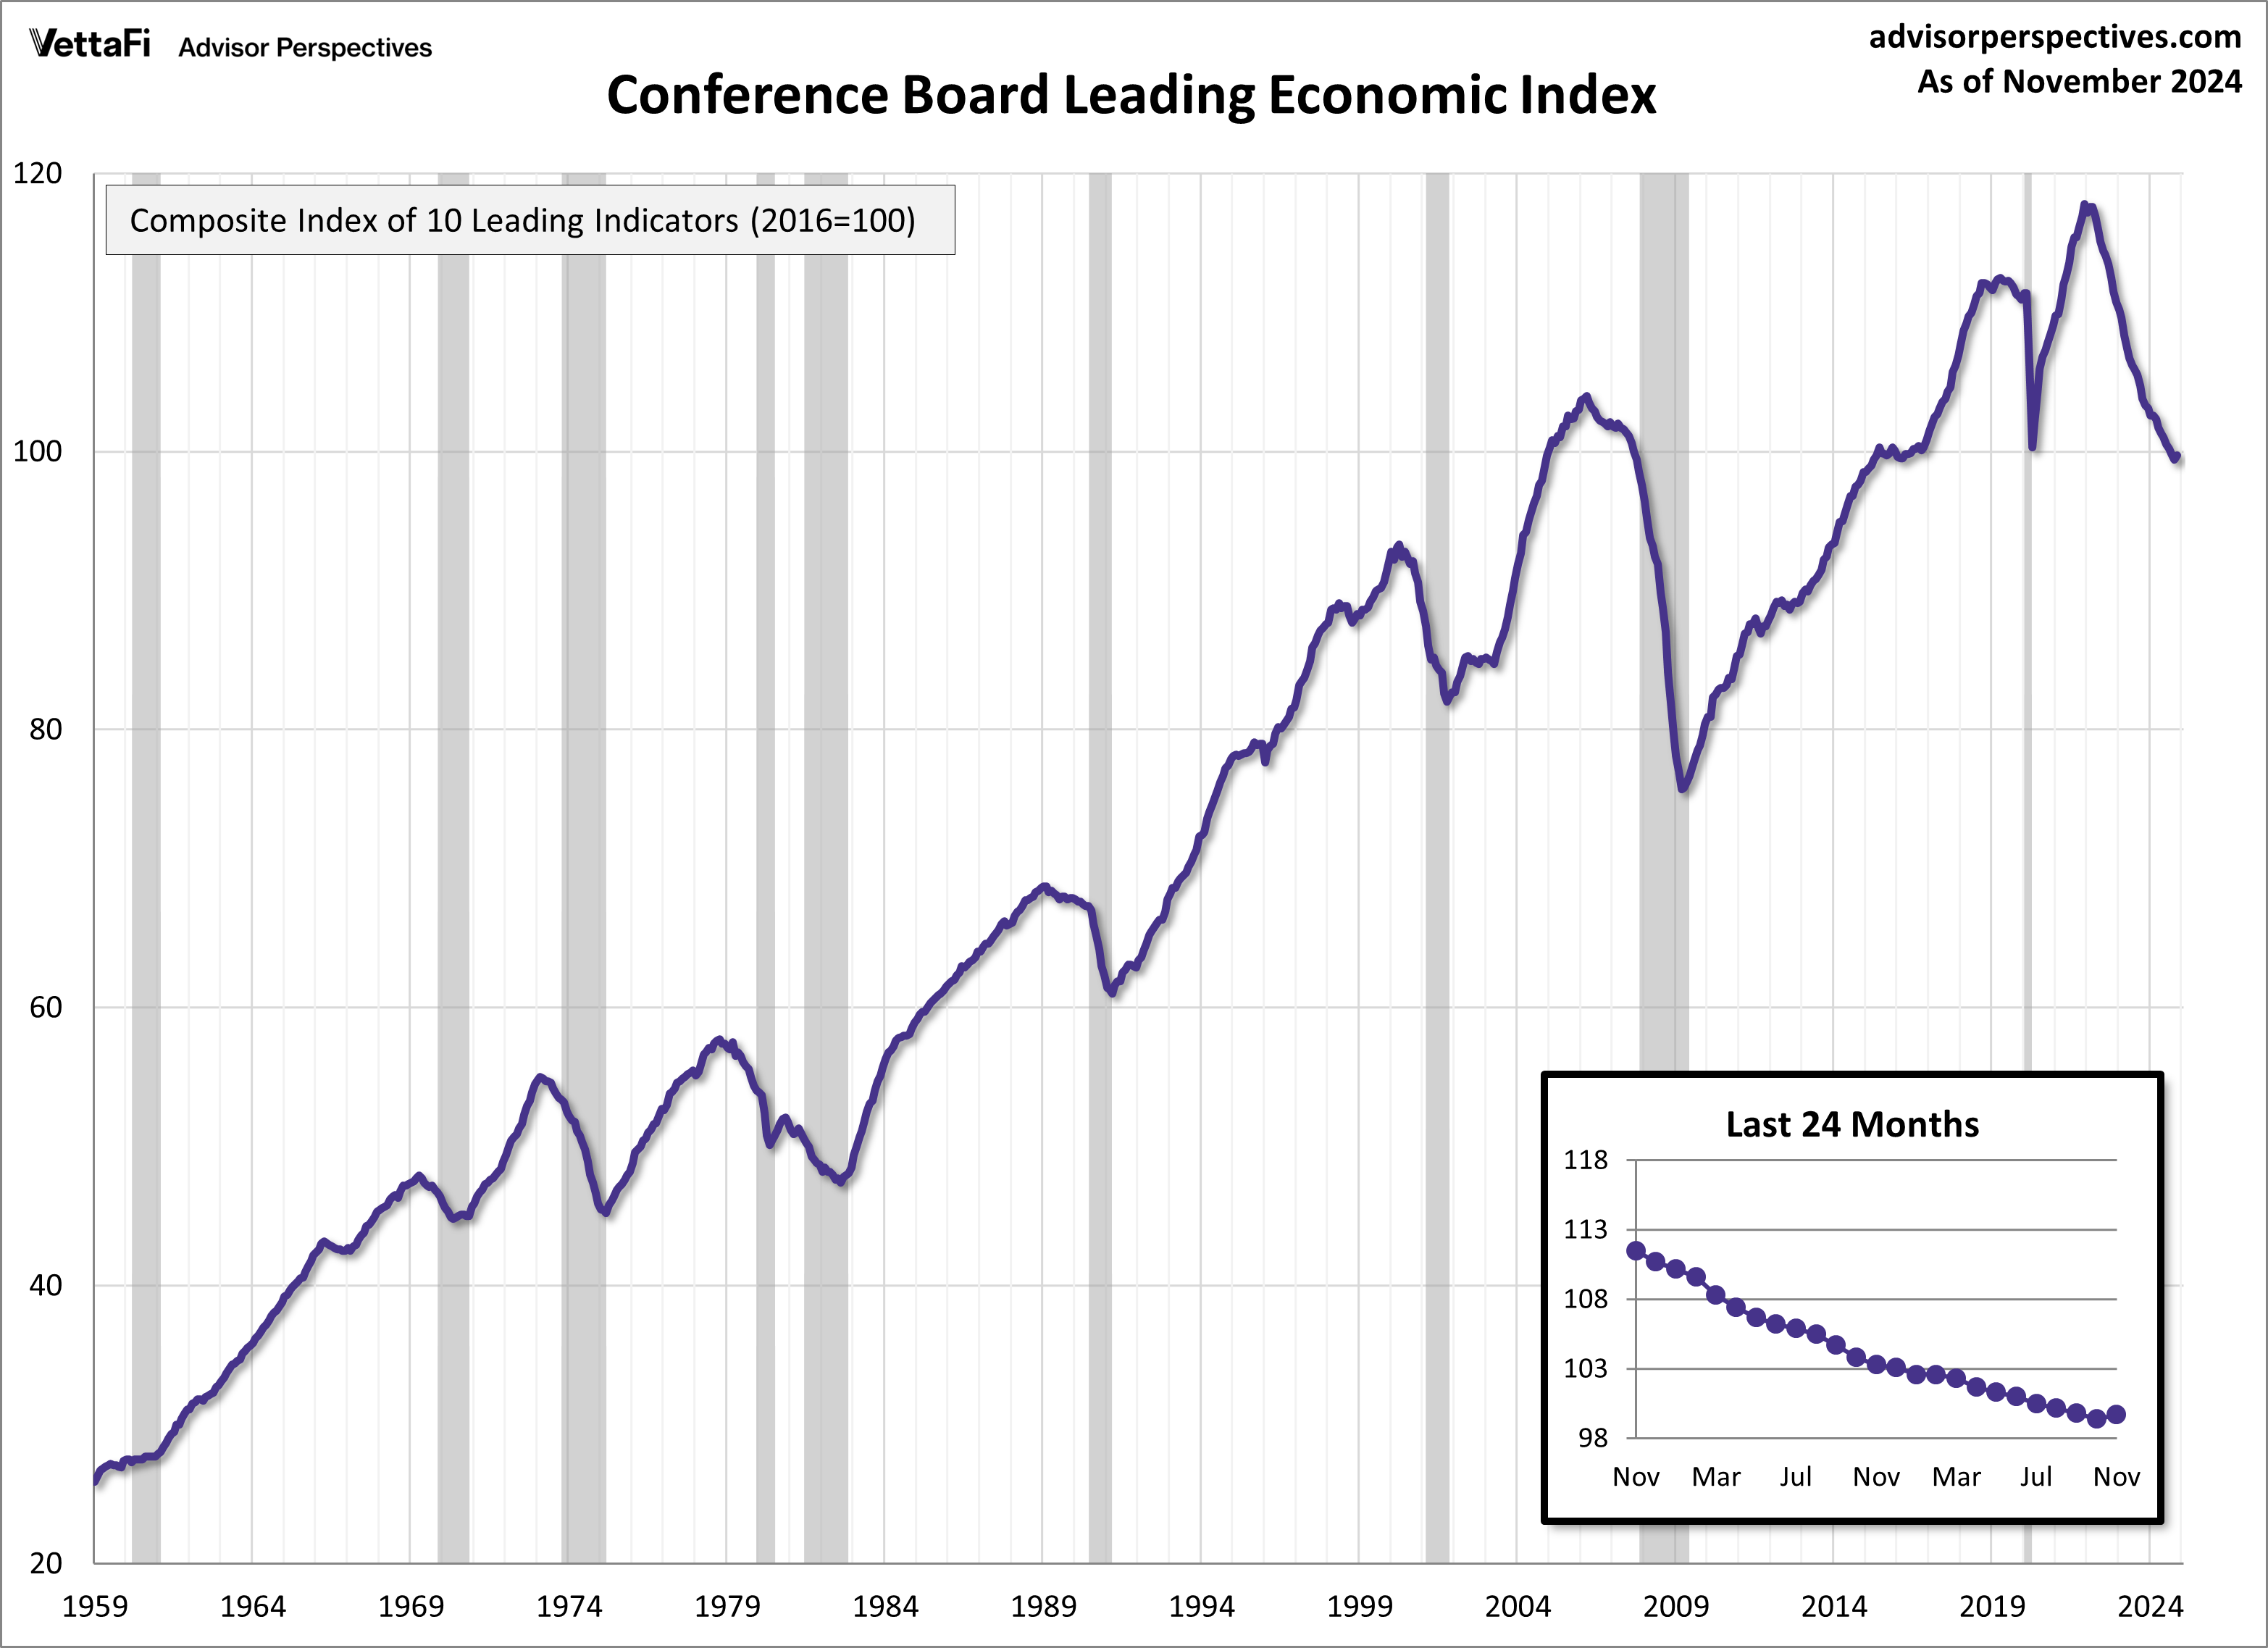
Here is a chart of the LEI series with documented recessions as identified by the NBER. Note the peaks of the index preceding each of the recessions and the troughs occurring near the end of each recession.
Leading Economic Index and Recession Risk
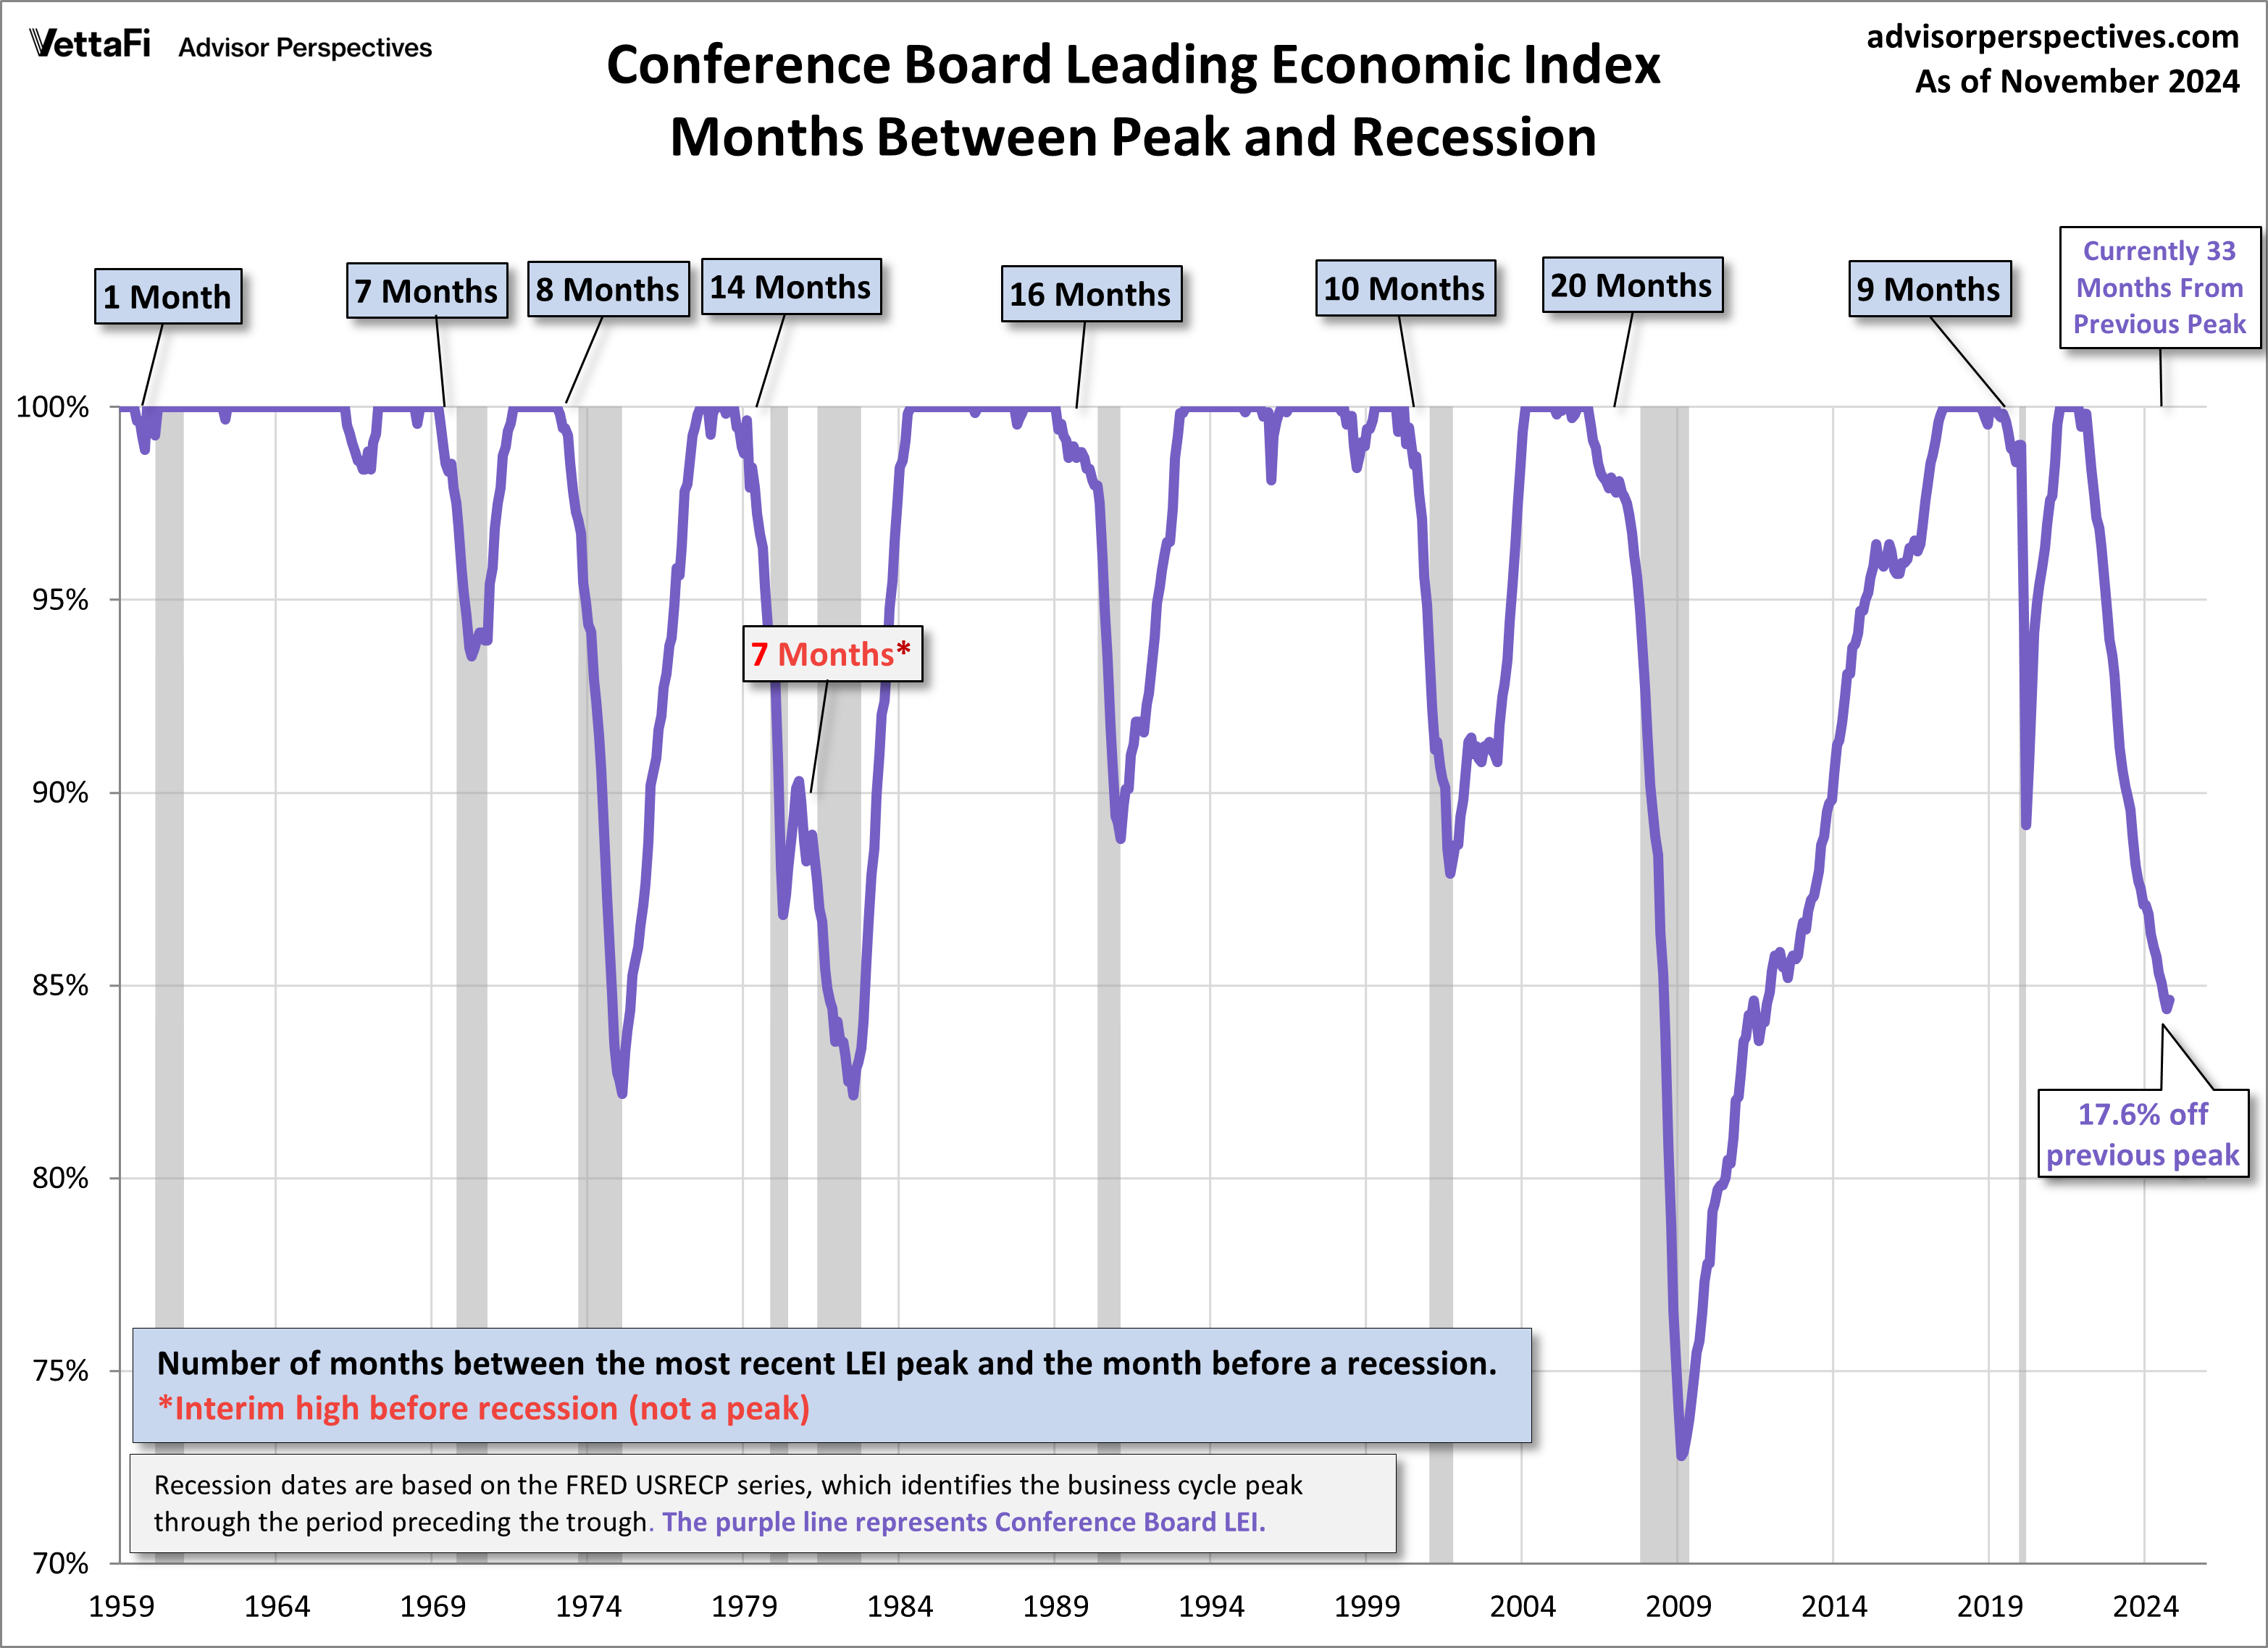
For a better understanding of the relationship between the LEI and recessions, the next chart shows the percentage off the previous peak for the index. We are currently 17.6% off the 2021 peak. The chart also calls out the number of months between the previous peak and official recessions. On average, there is usually 10.6 months between a peak and a recession. We are currently 33 months off from the 2021 peak.
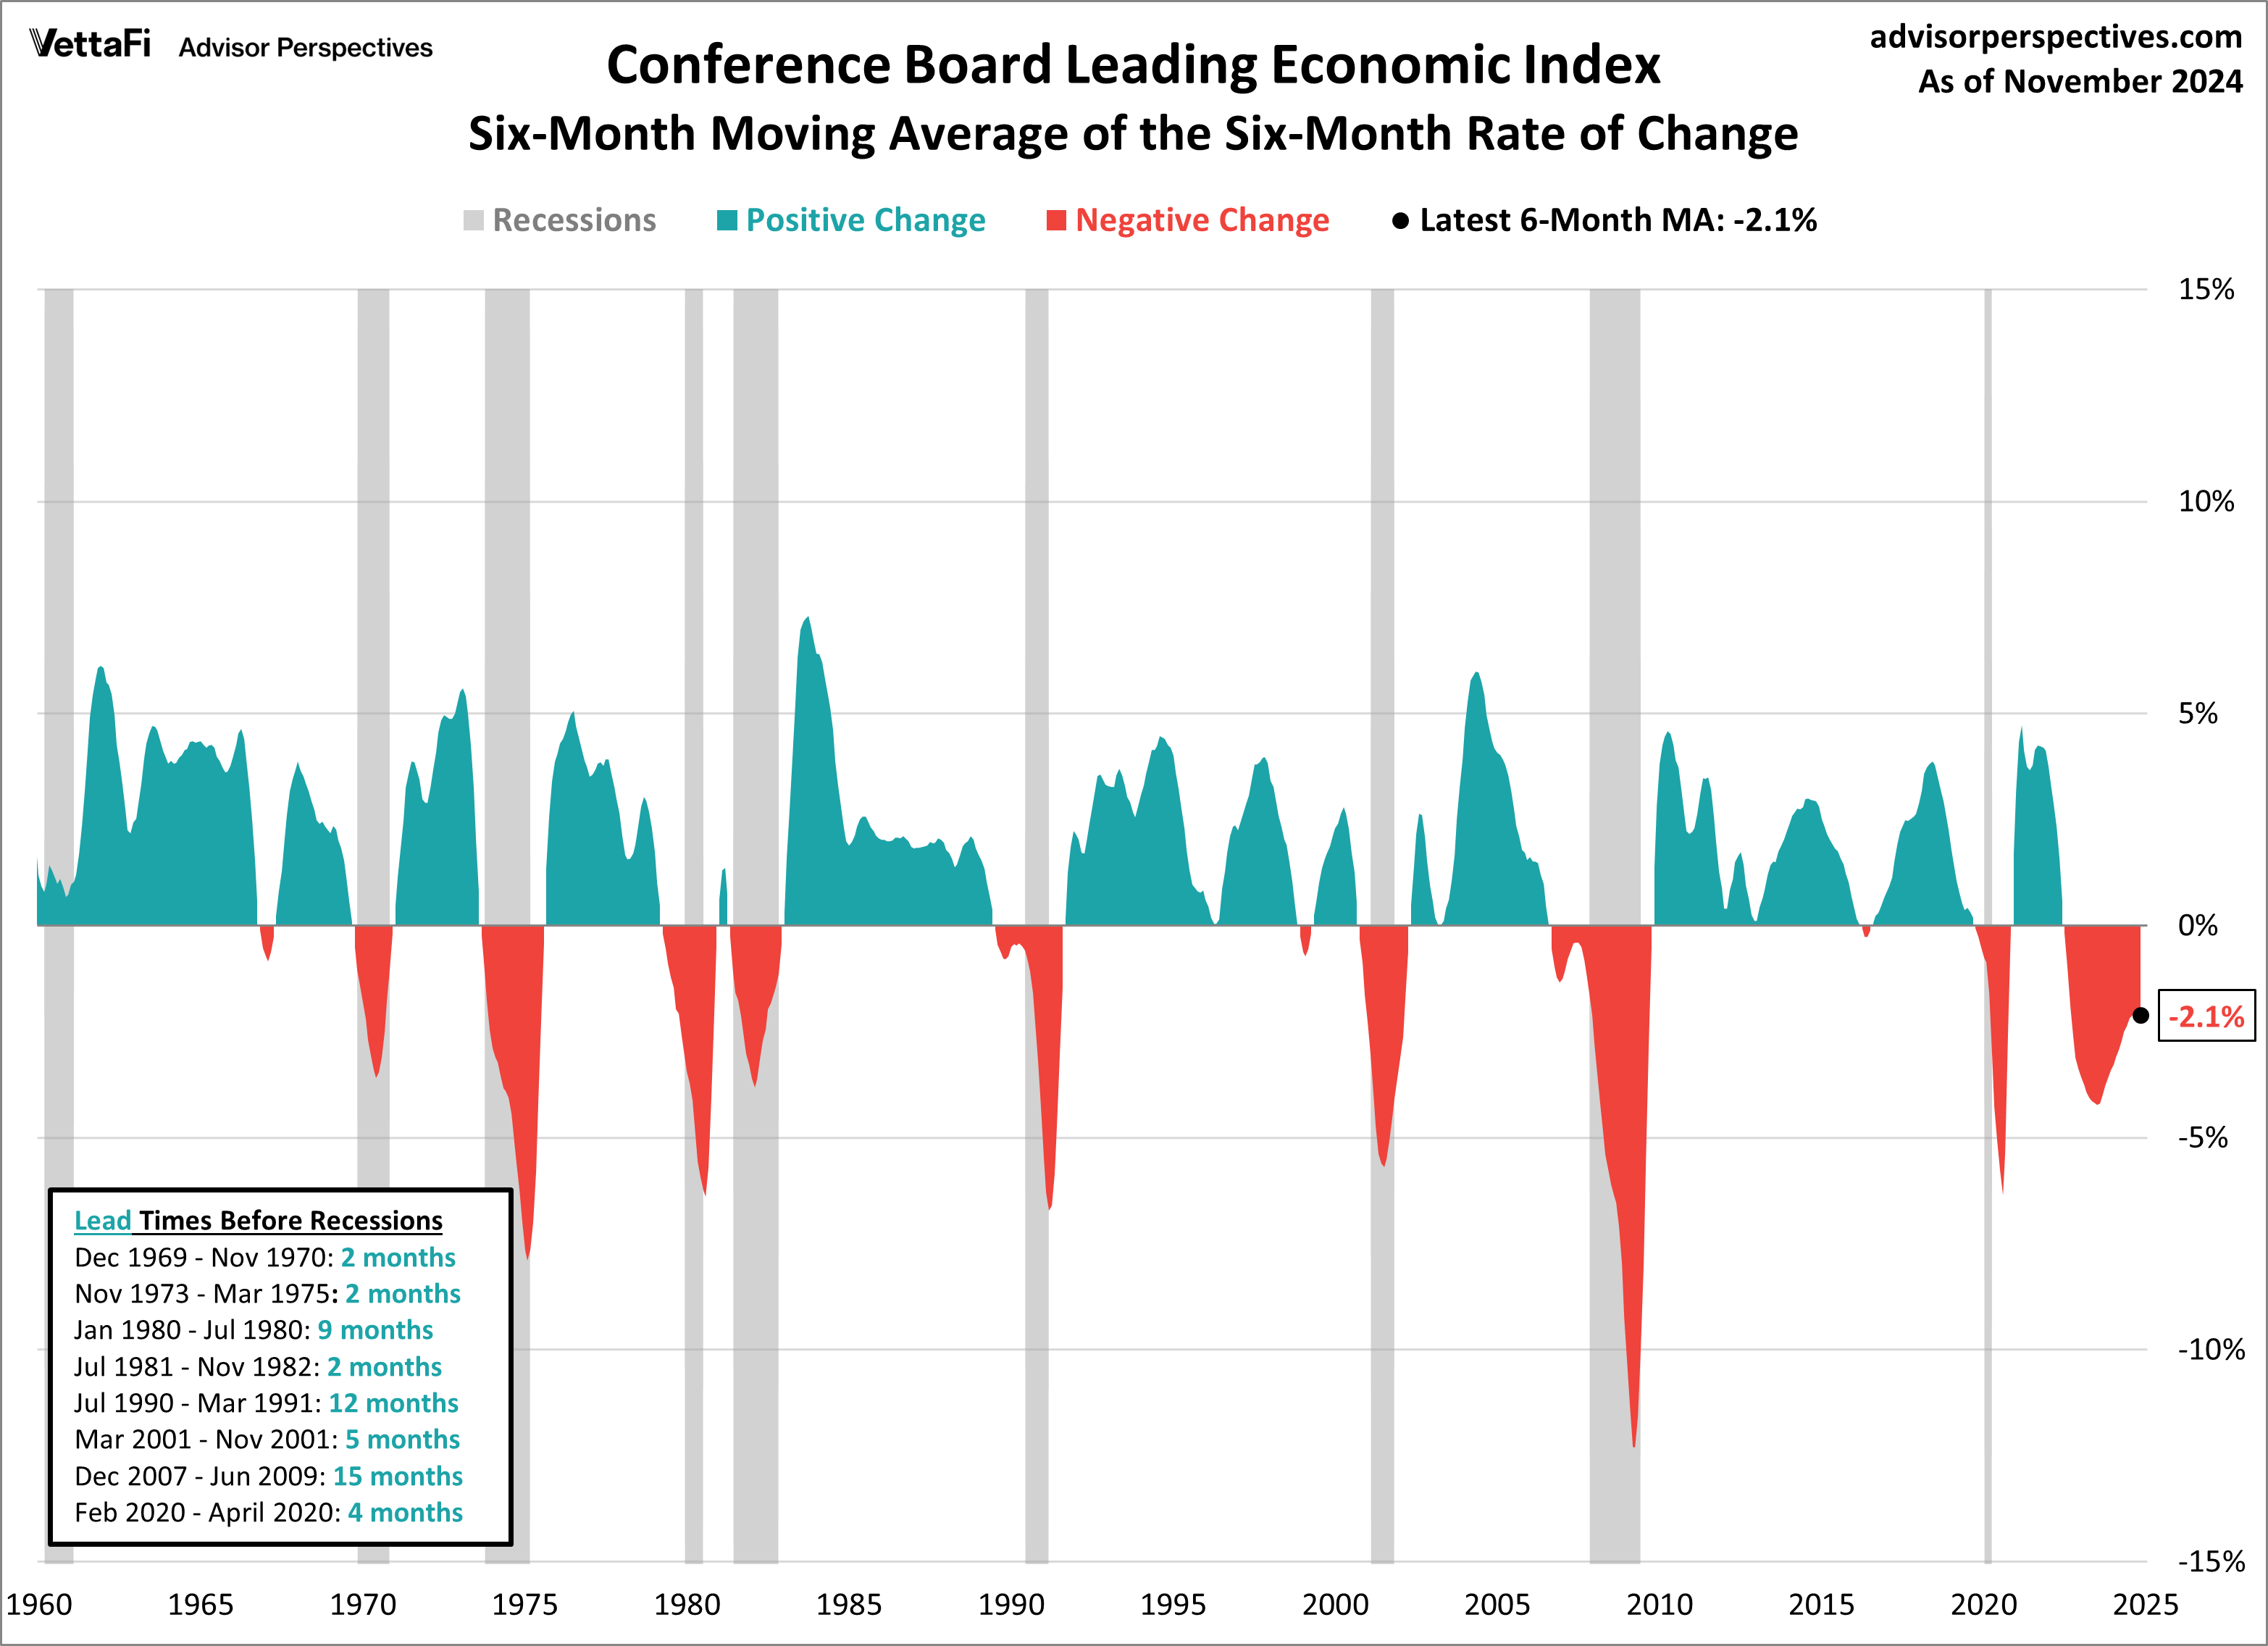
Leading Economic Index and Its 6-Month Smoothed Rate of Change
Based on suggestions from Neile Wolfe of Wells Fargo Advisors and Dwaine Van Vuuren of RecessionAlert, we can tighten the recession lead times for this indicator by plotting a smoothed six-month rate of change to further enhance our use of the Conference Board's LEI as a gauge of recession risk.
The LEI has historically dropped below its 6-month moving average (of 6-month ROC) anywhere between 2 to 15 months before a recession. Currently, the LEI has been below its 6-month moving average (of 6-month ROC) for 31 months. Note that there have been times where the LEI has been below the 6-month for multiple months without a recession.
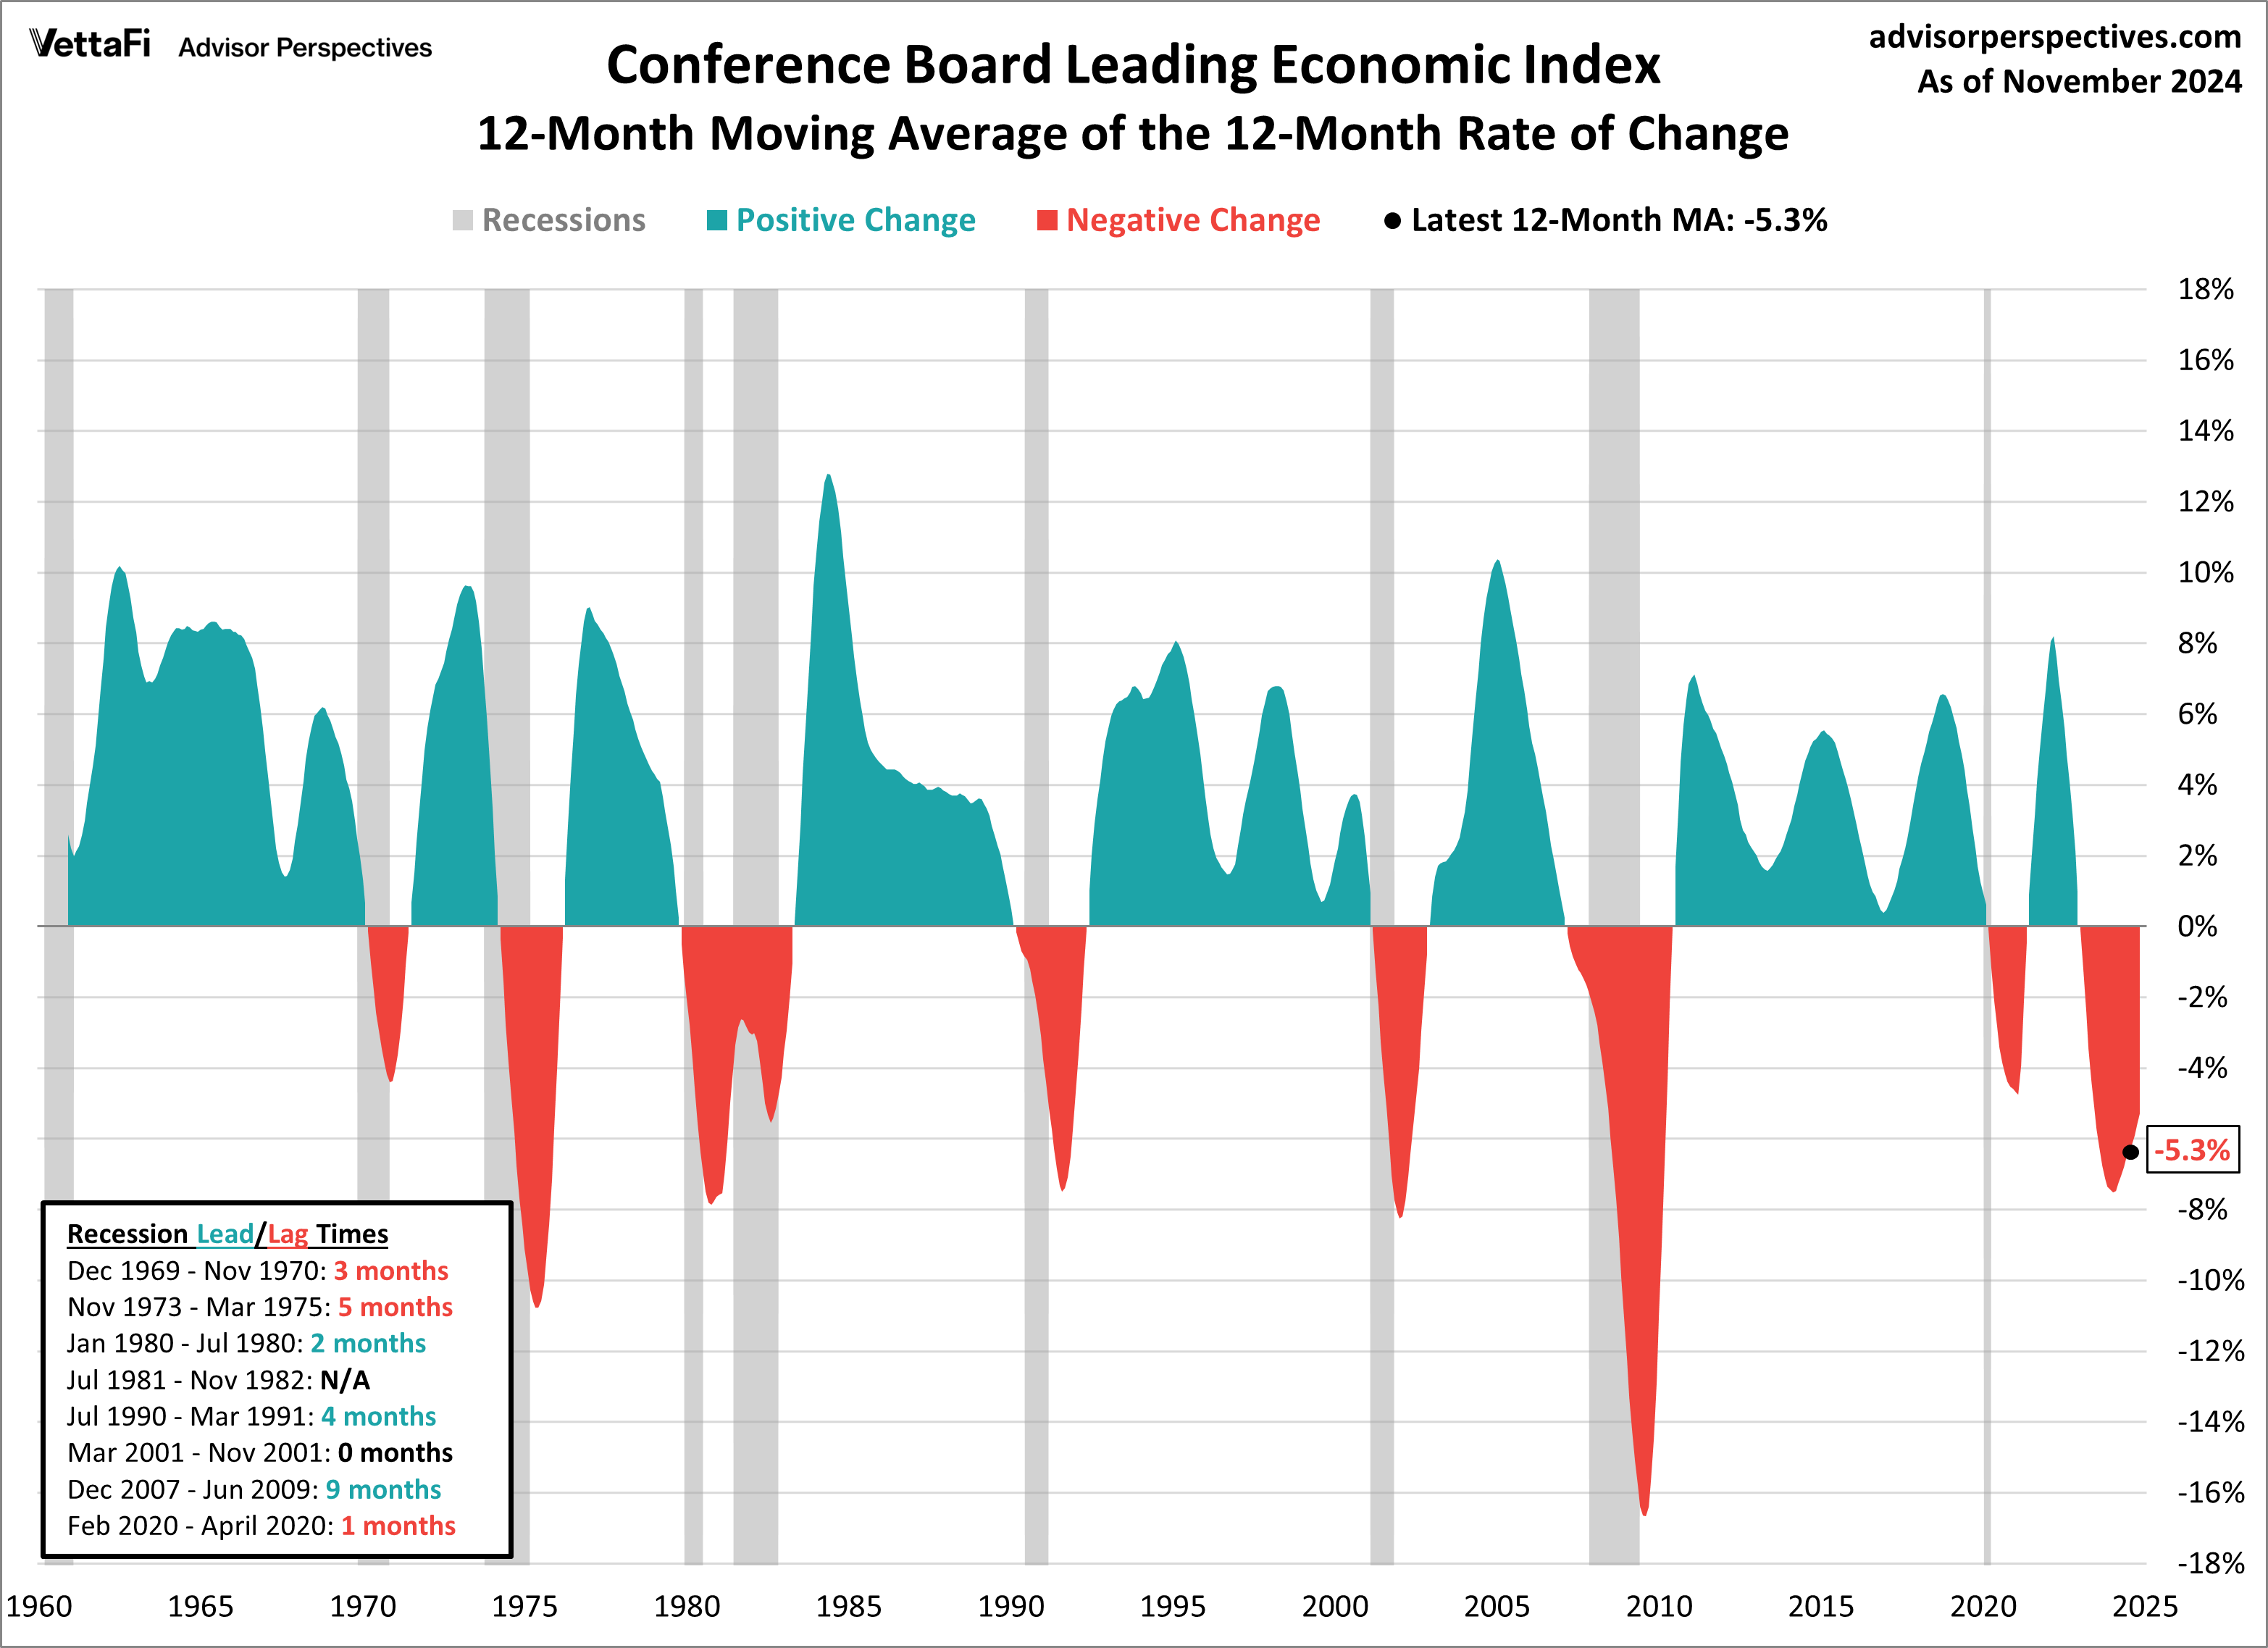
Here is a 12-month smoothed out version, which further eliminates the whipsaws:
Currently, the 12-month moving average (of 12 month ROC) has been negative for 22 months.
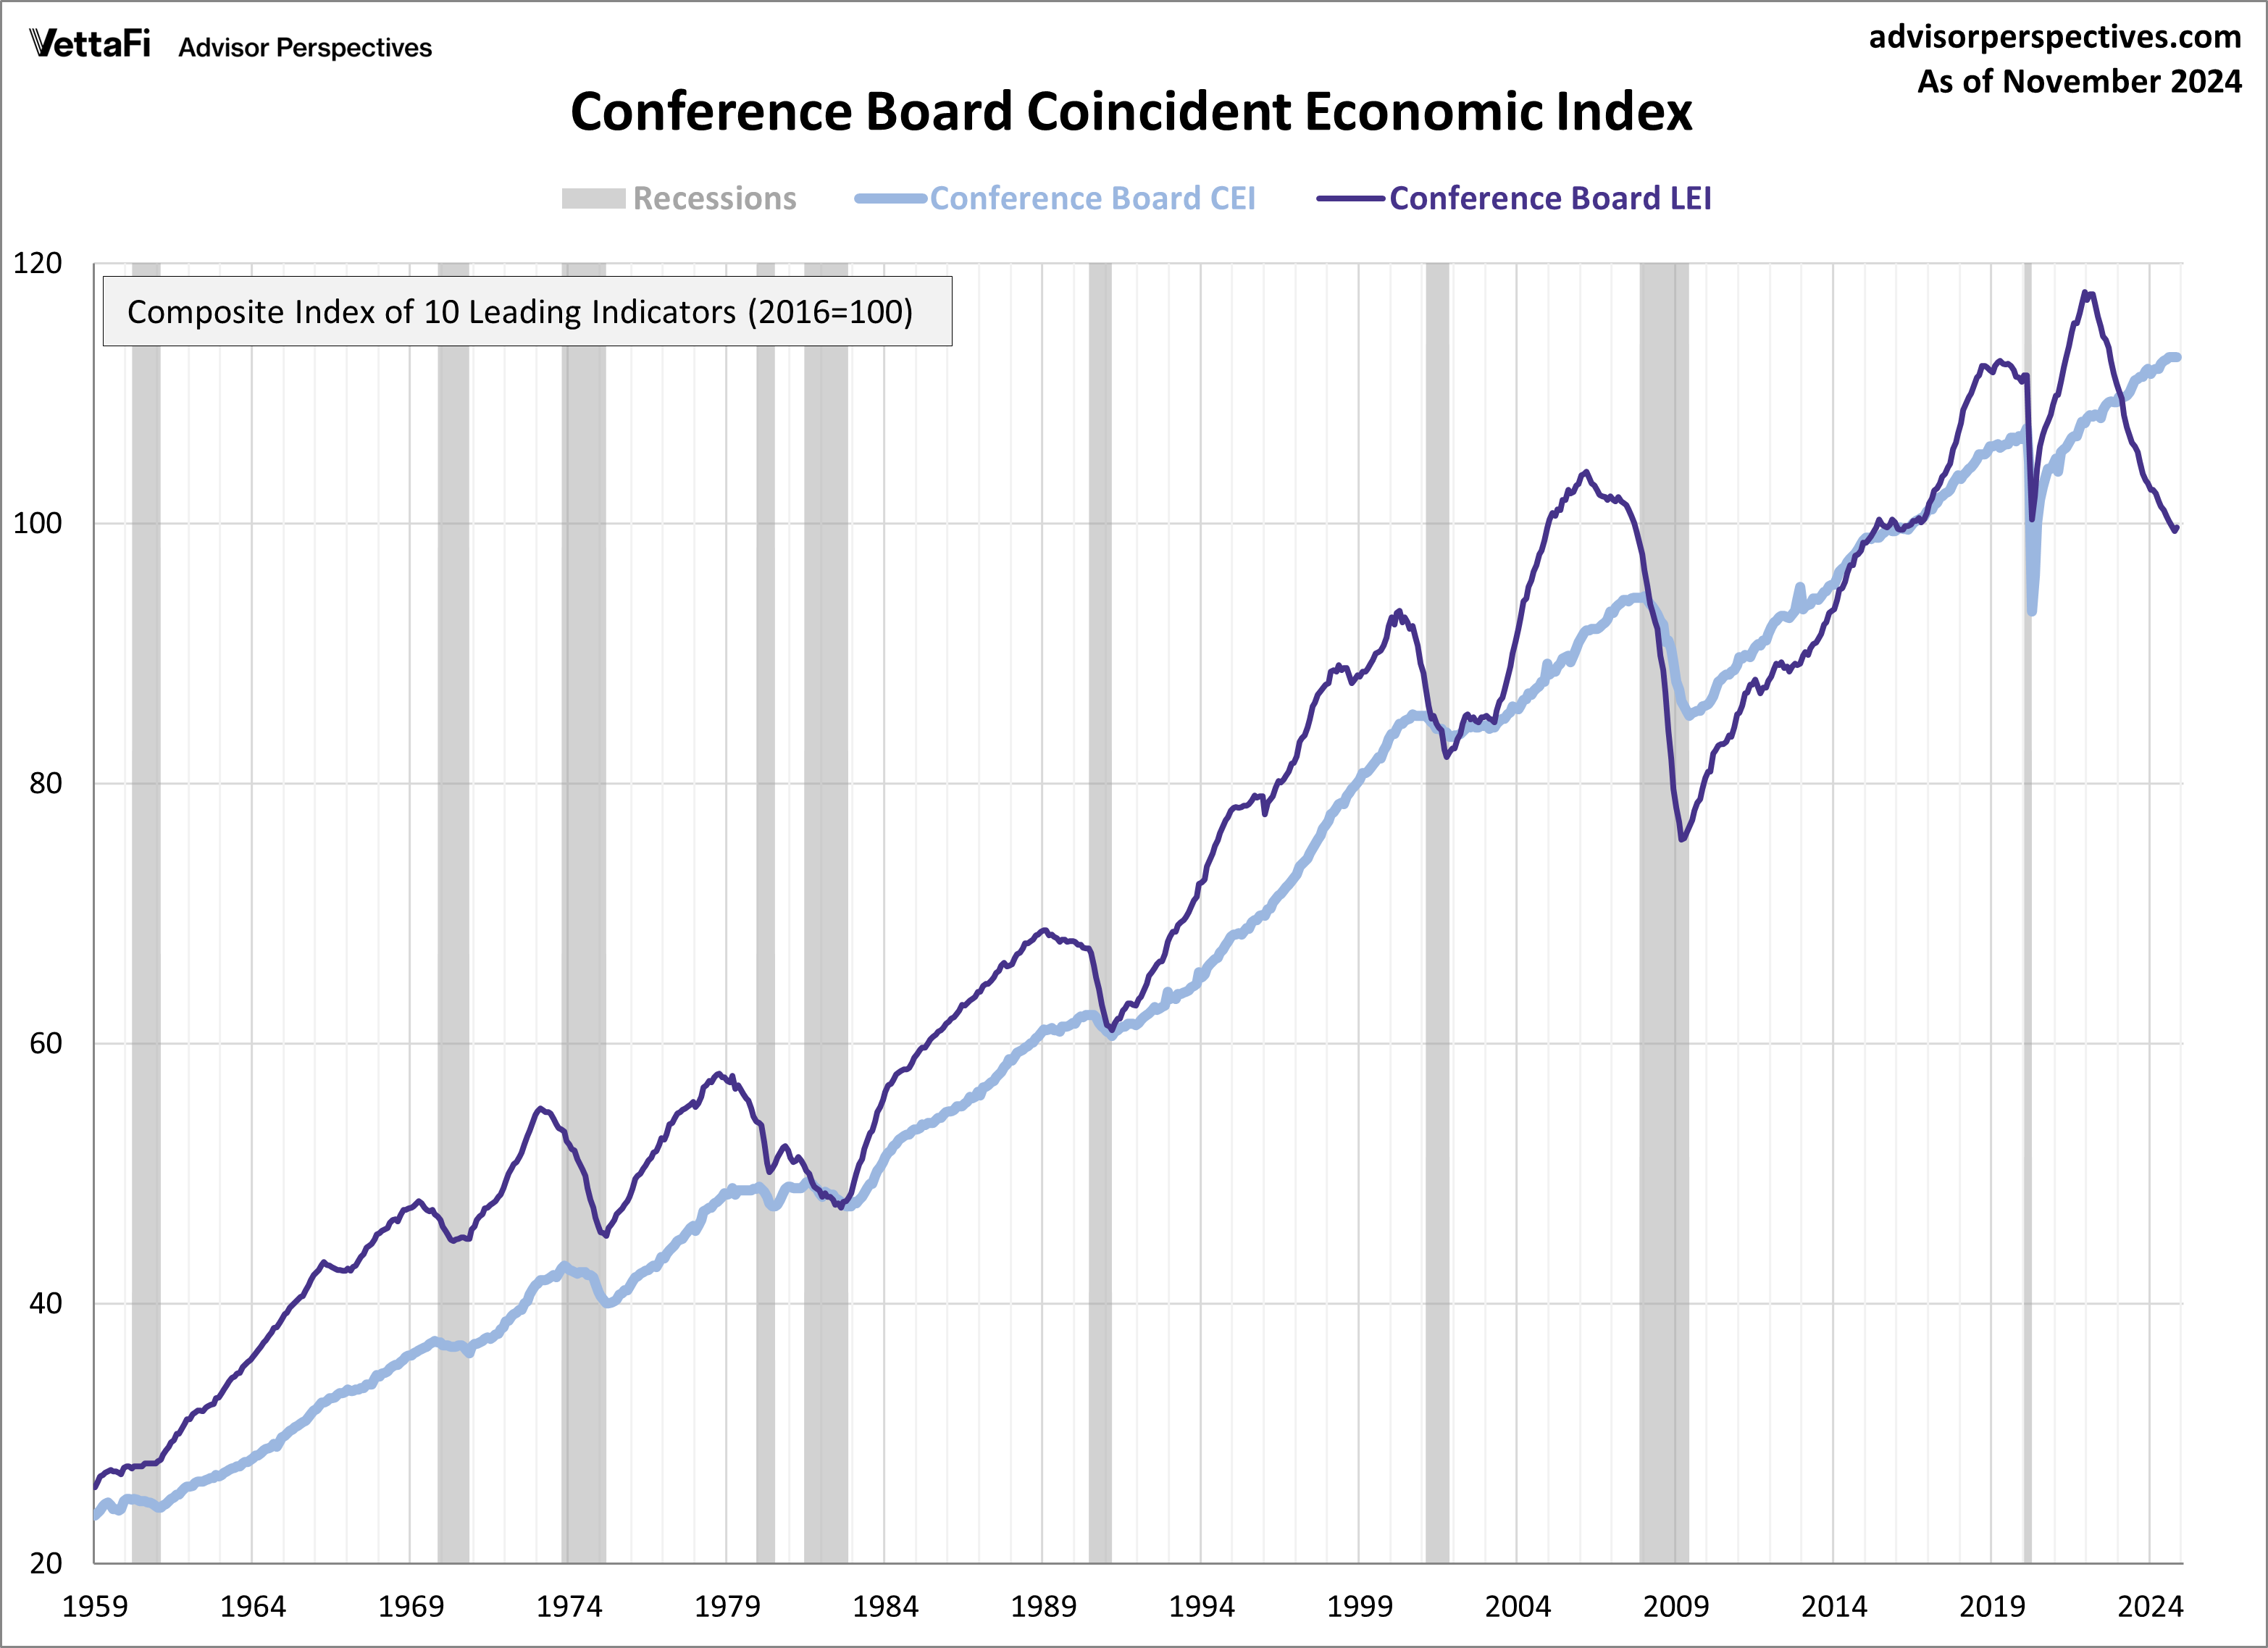
Conference Board Coincident Economic Index®
The Conference Board also includes its coincident economic index (CEI) in each release. The CEI measures current economic activity and is made up of four components: nonagricultural payroll, personal income less transfer payments, manufacturing and trade sales, and industrial production.
The Conference Board Coincident Economic Index® (CEI) for the US improved by 0.1% in November 2024 to 113.0 (2016=100)—the same rate of growth as each month between July and October. As a result, the CEI increased by 0.6% in the six-month period ending November 2024, slightly higher than its 0.5% growth over the previous six-month period. The CEI’s component indicators—payroll employment, personal income less transfer payments, manufacturing and trade sales, and industrial production—are included among the data used to determine recessions in the US. Personal income less transfer payments was the highest positive contributor to CEI, based on estimates for November, followed by payroll employment, and manufacturing and trade sales, all of which offset the third consecutive decline in industrial production.
Observations show that when the LEI starts declining, the CEI continues to rise. The LEI has declined or been flat each month since April 2022. Over that same time frame, the CEI experienced only 5 monthly declines. Here's a chart including both the CEI and LEI.
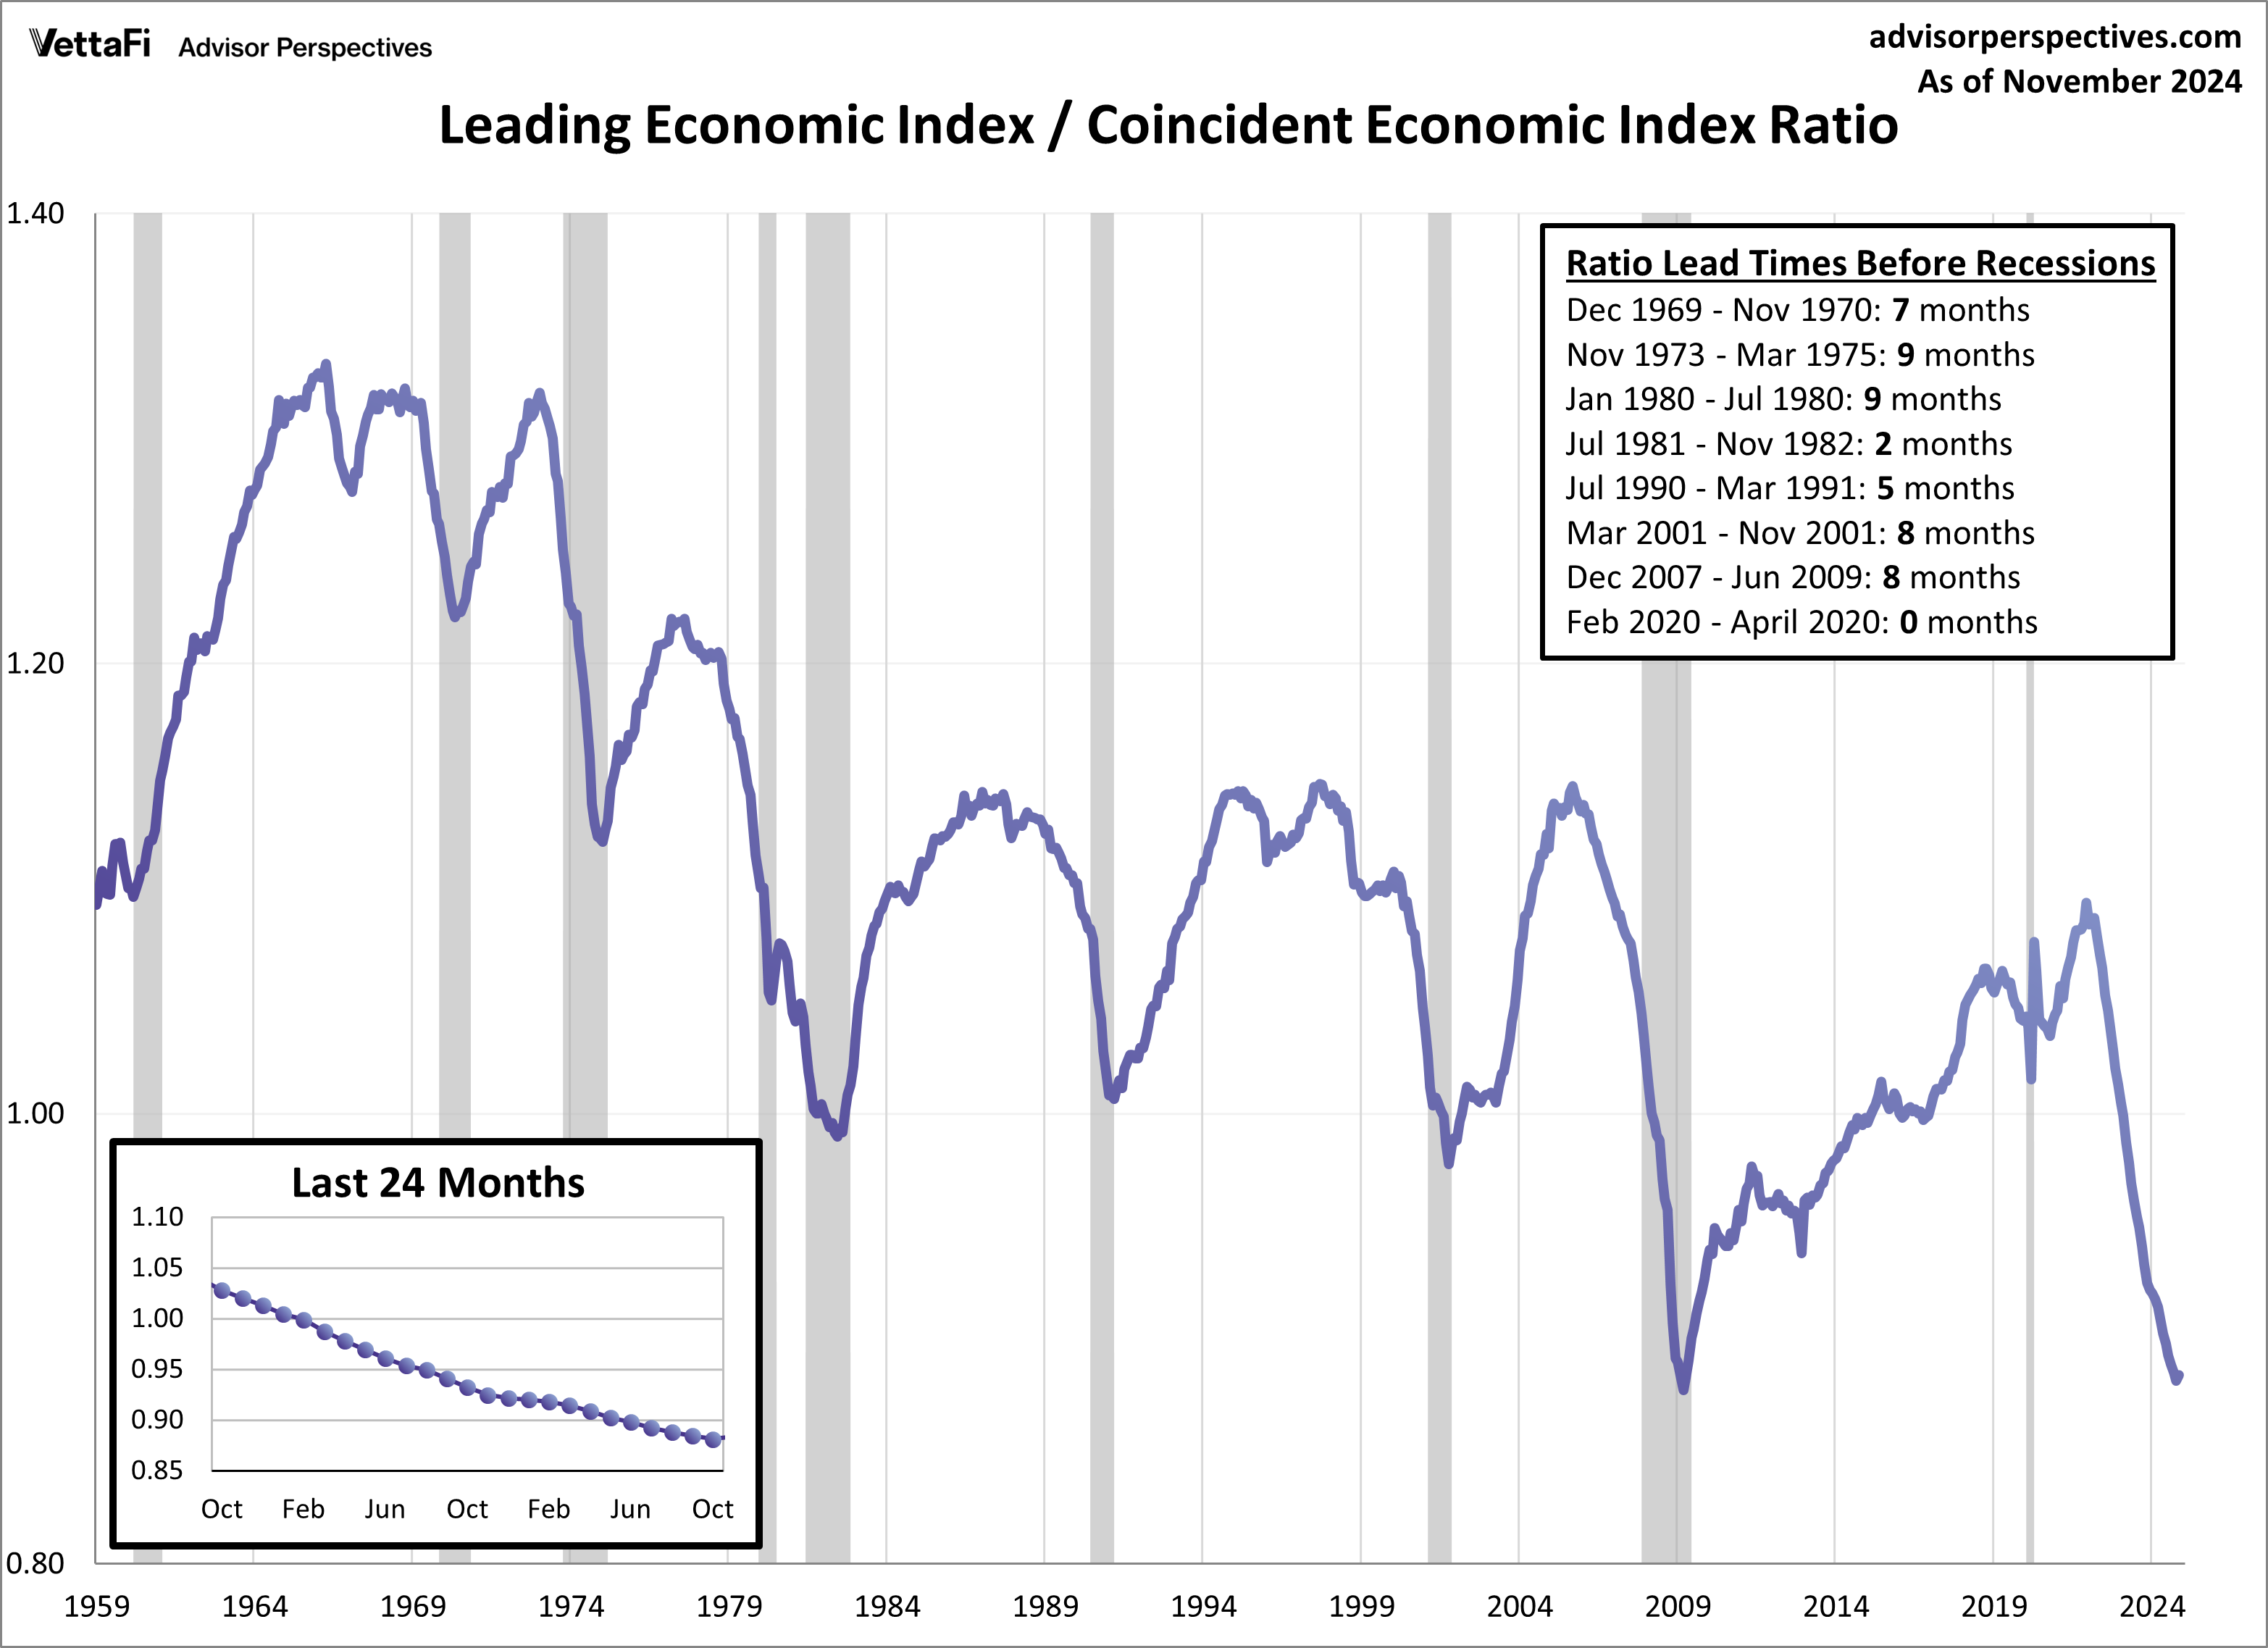
Here is a chart of the LEI/CEI ratio, which perhaps has been a leading indicator of recessions. I count the lead time as the number of months that the ratio has been declining prior to a recession. The LEI/CEI ratio has now declined for 32 consecutive months. There have been times where the ratio has been in decline for several months without a recession.