Building Permits Fall 3.0% in June
Membership required
Membership is now required to use this feature. To learn more:
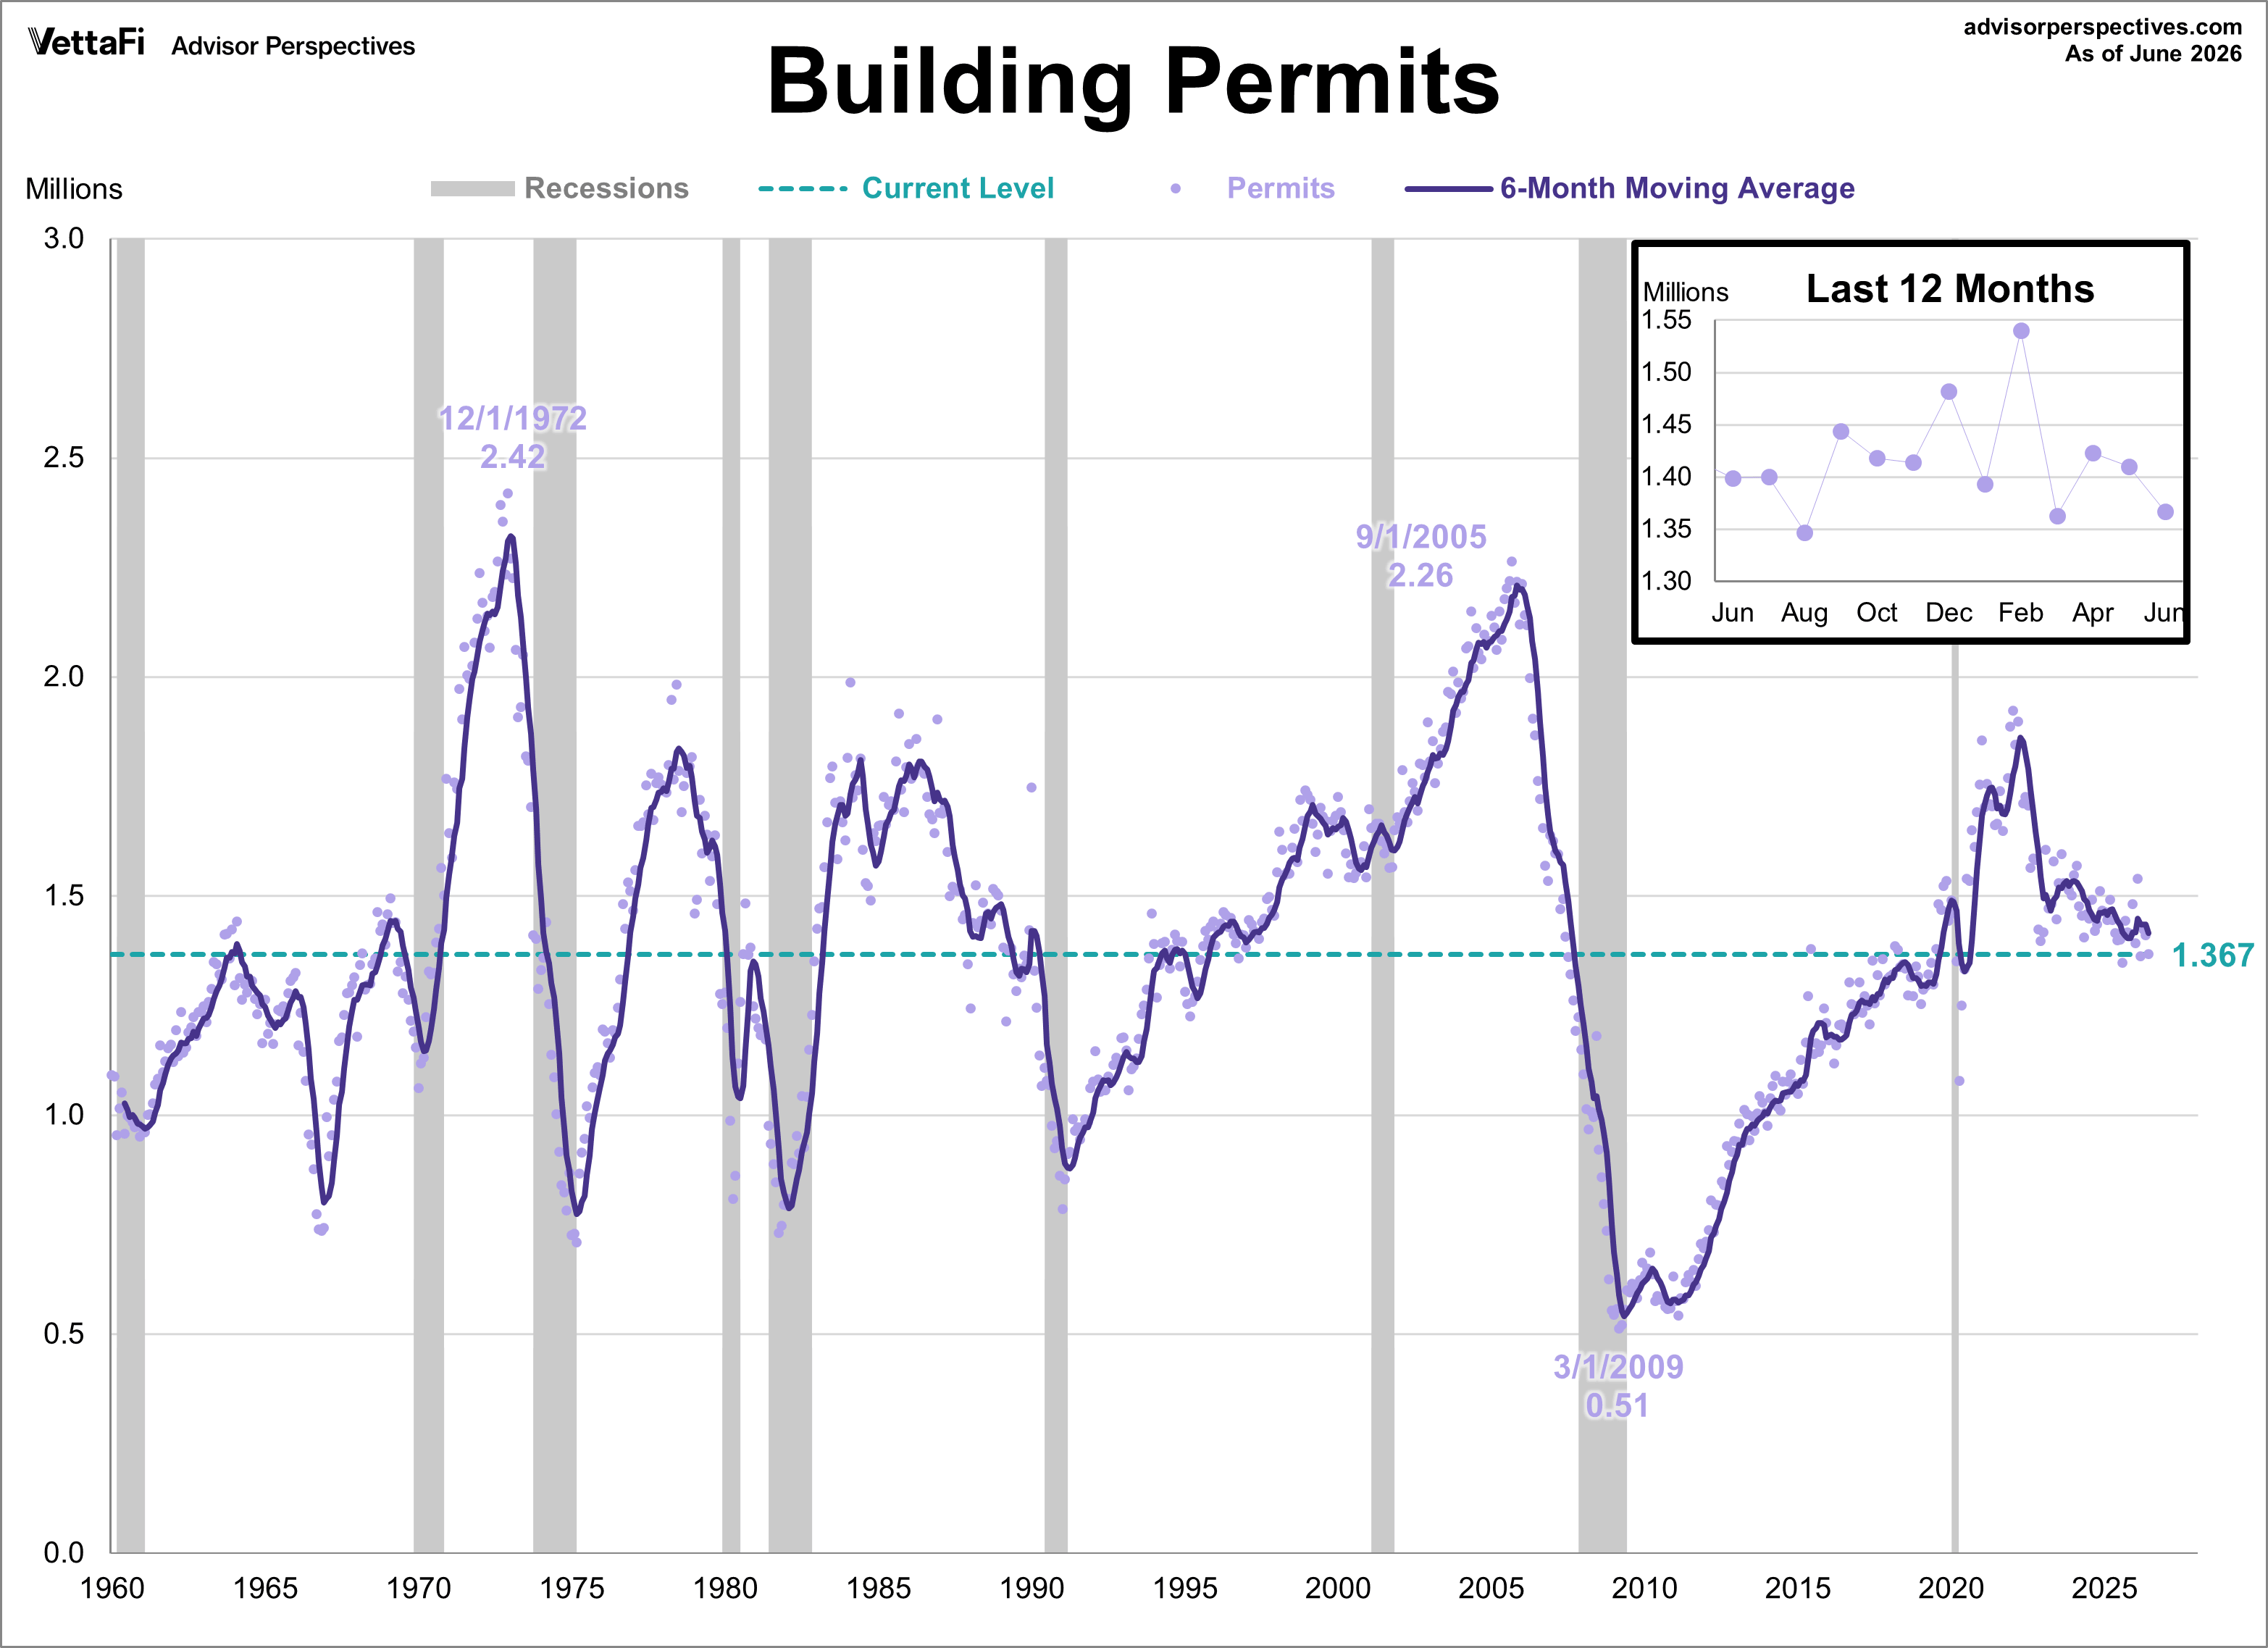
View Membership BenefitsBuilding permits fell 3.0% in June to a seasonally adjusted annual rate of 1.367 million. The latest reading missed the forecast of 1.400 million. Building permits are down 2.3% from the previous year.
Key Takeaways
-
Building permits fell 3.0% in May to an annual rate of 1.367 million, missing the 1.400 million forecast.
-
Single-family permits were down 2.4% month-over-month to 0.71 million, while multi-family permits fell 4.9% to 0.445 million.
-
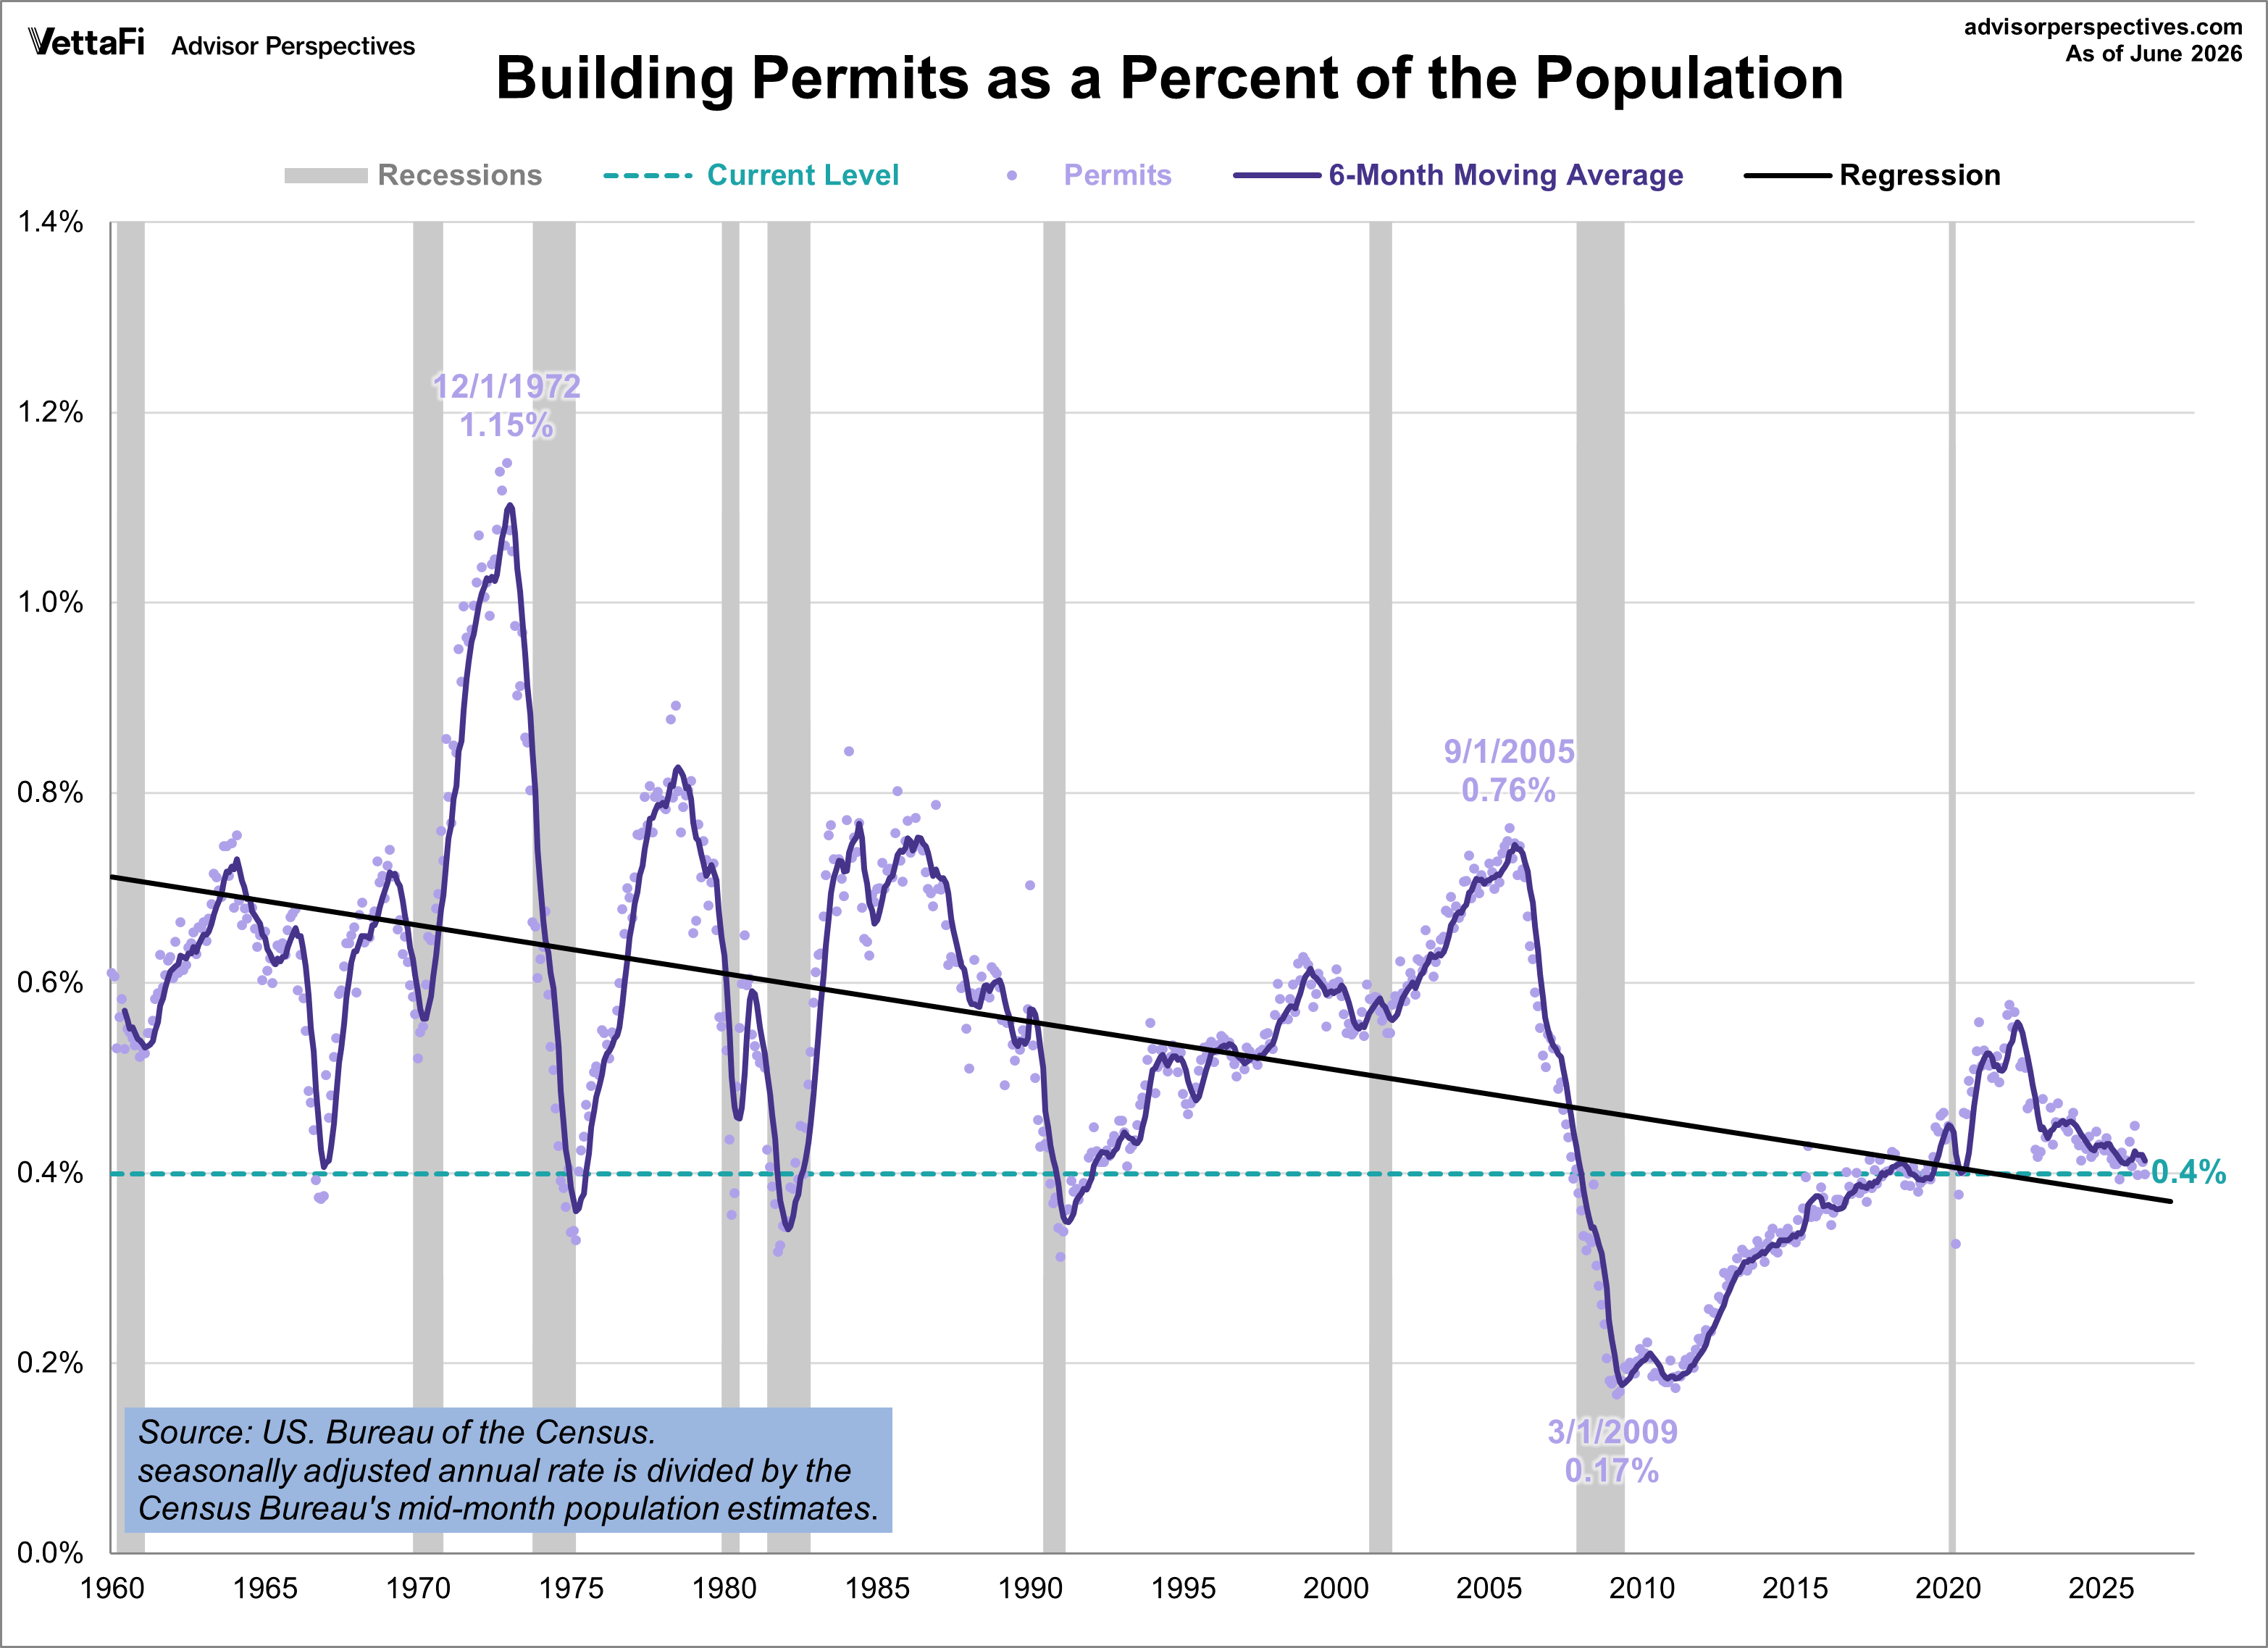
Building permits as a percent of the population stood at 0.40% in June.
Background on Building Permits
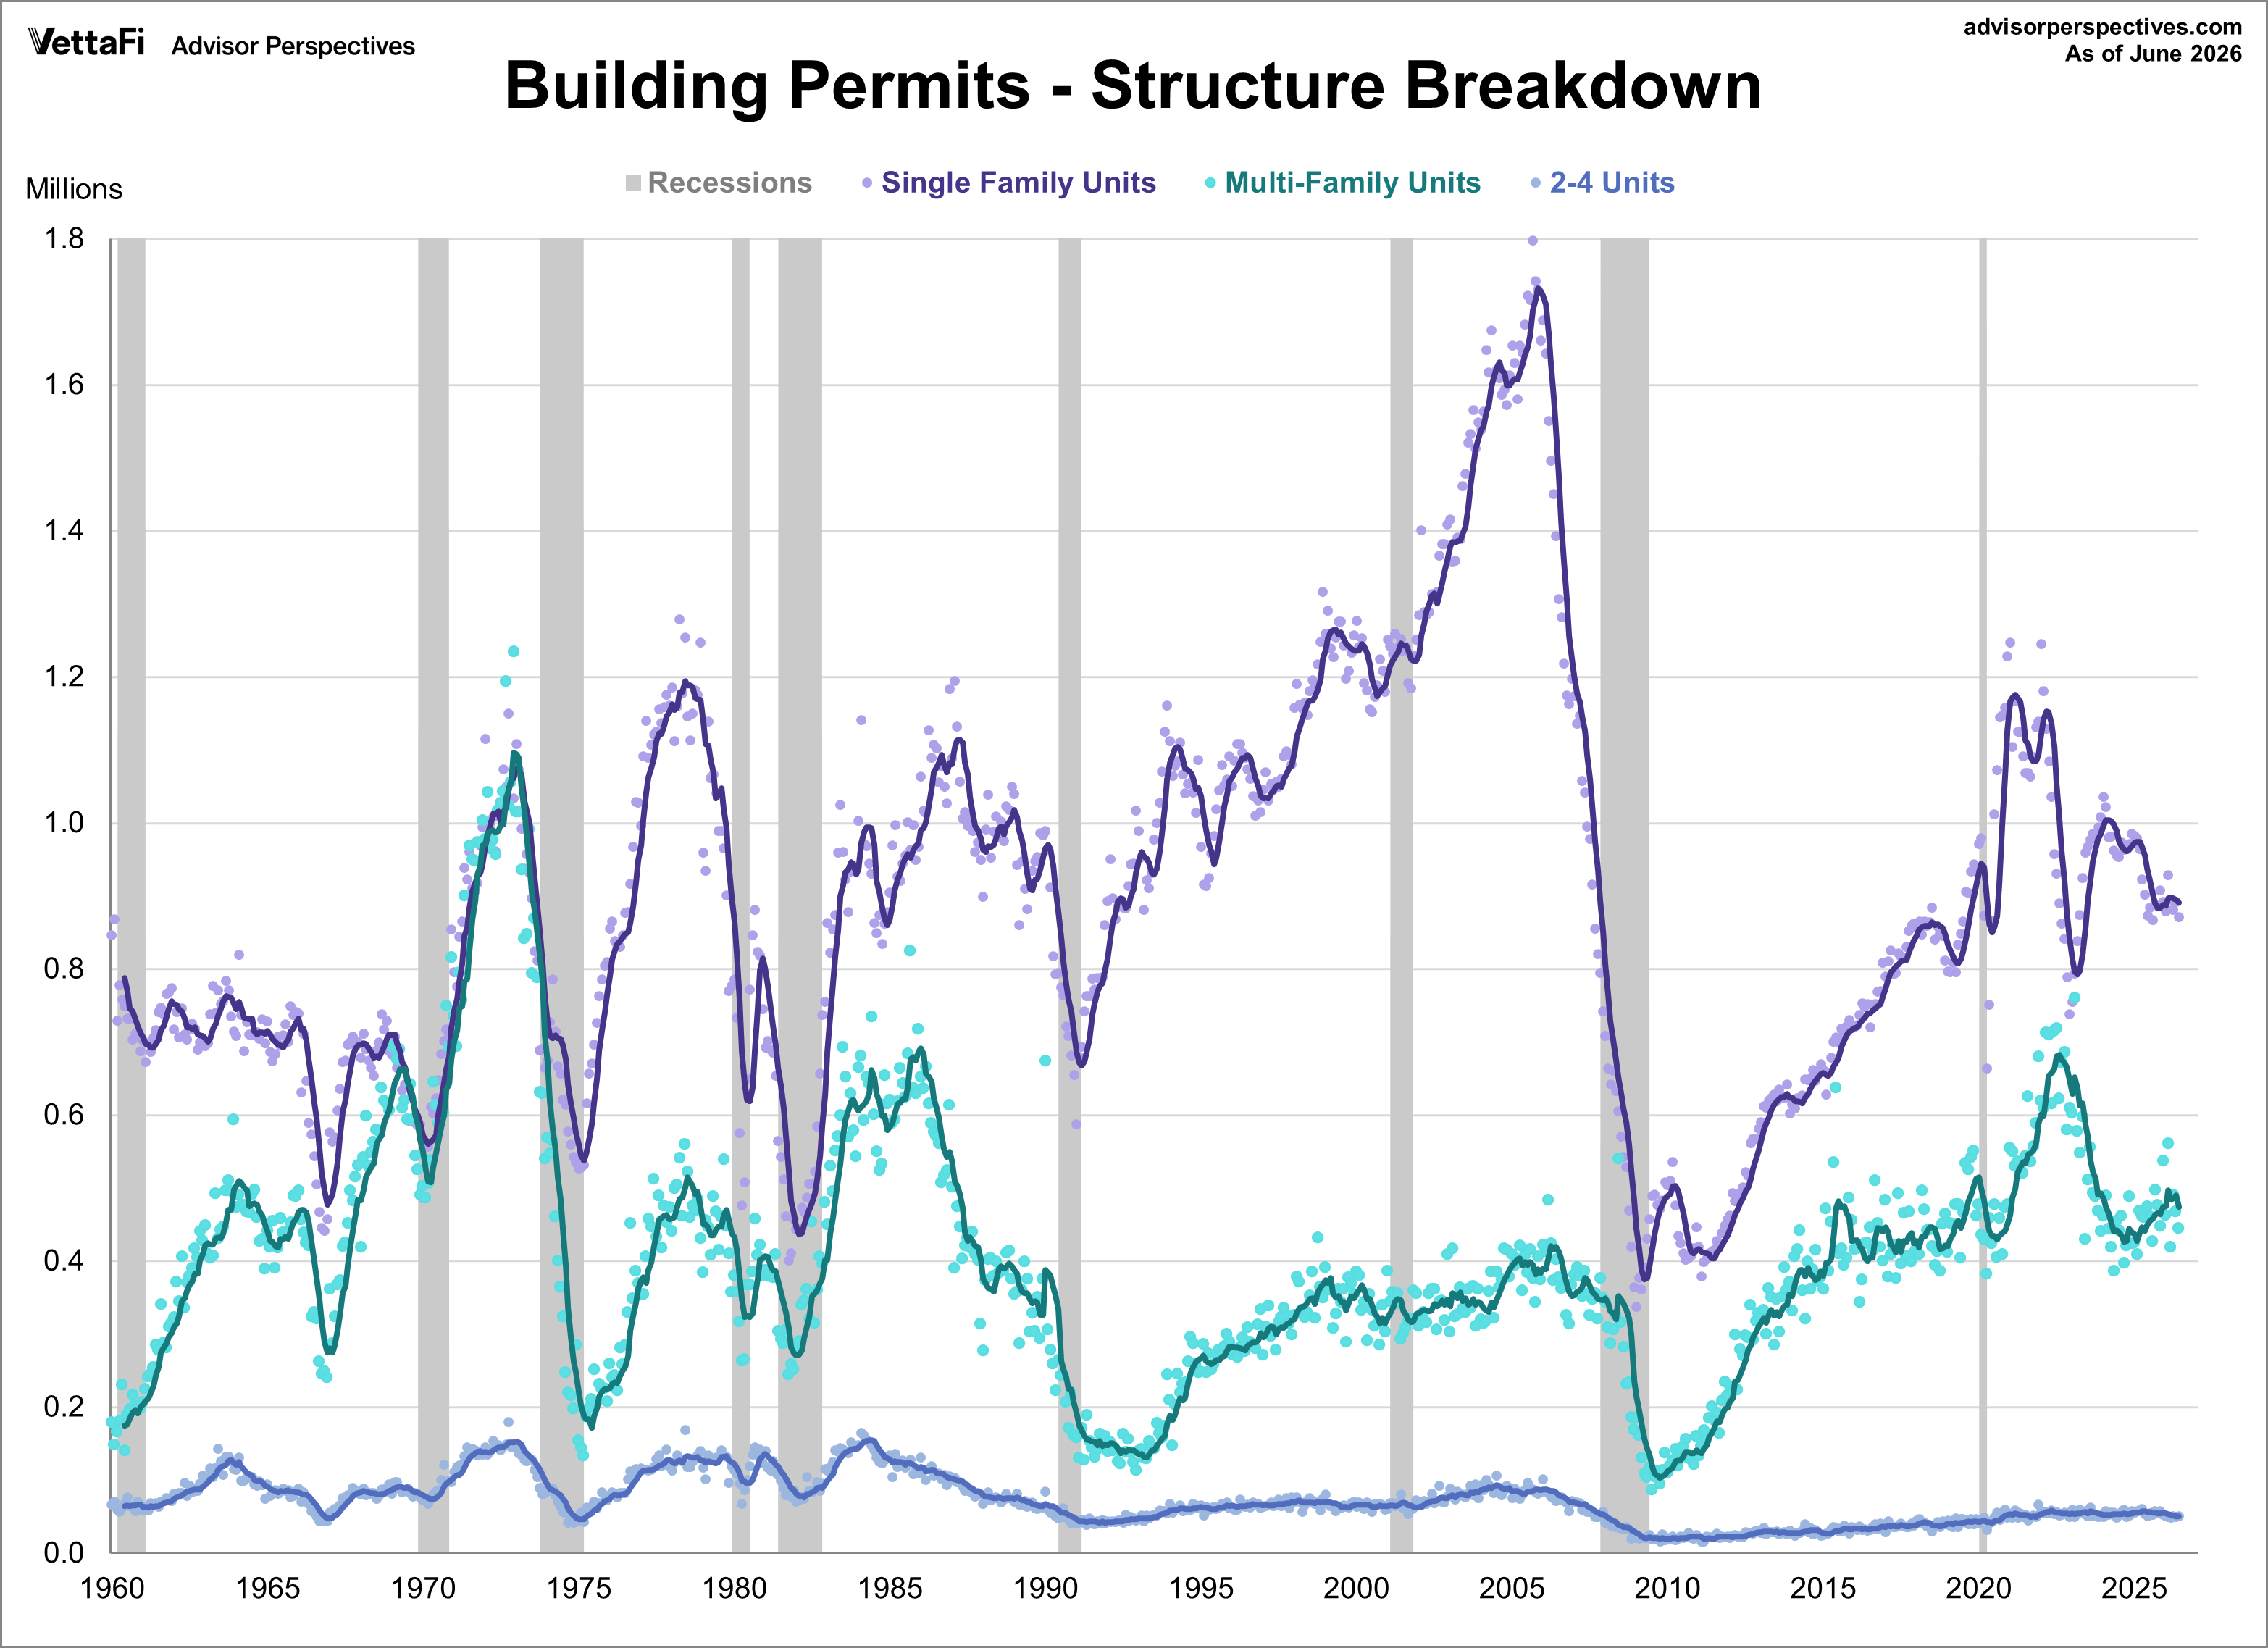
Building permits track the government issuance of permits that are typically required for builders to begin construction on a new home. The data on building permits give a sense of how much and where future construction activity will take place and thus are an excellent marker of future home building. A critical aspect of the home-building industry is the powerful influence it has on the rest of the economy. The data is divided into three types of structures: single-family homes, residences with 2-4 units (condos or townhouses), and structures with 5+ units (apartment complexes).
Here is the complete historical series, which dates from 1960. Because of the extreme volatility of the monthly data points, a six-month moving average has been included.
Building Permits: Structure Breakdown
In June, single-family building permits were at a seasonally adjusted annual rate of 0.871 million. This represents a 2.4% decrease from May and a 0.2% decline from the previous year.
Residences with 2-4 units building permits were at a seasonally adjusted annual rate of 0.051 million in June. This represents a 2.0% increase from May and no change from the previous year.
Lastly, multi-family buildings building permits were at a seasonally adjusted annual rate of 0.445 million in June. This represents a 4.9% decrease from May and a 6.3% drop from the previous year.
Building Permits: The Population-Adjusted Reality
The Census Bureau's mid-month population estimates show substantial growth in the US population since 1959. Here is the data with a simple population adjustment showing building permits as a percent of the population with a linear regression to highlight the trend. In June, building permits as a percent of the population was at 0.40%.
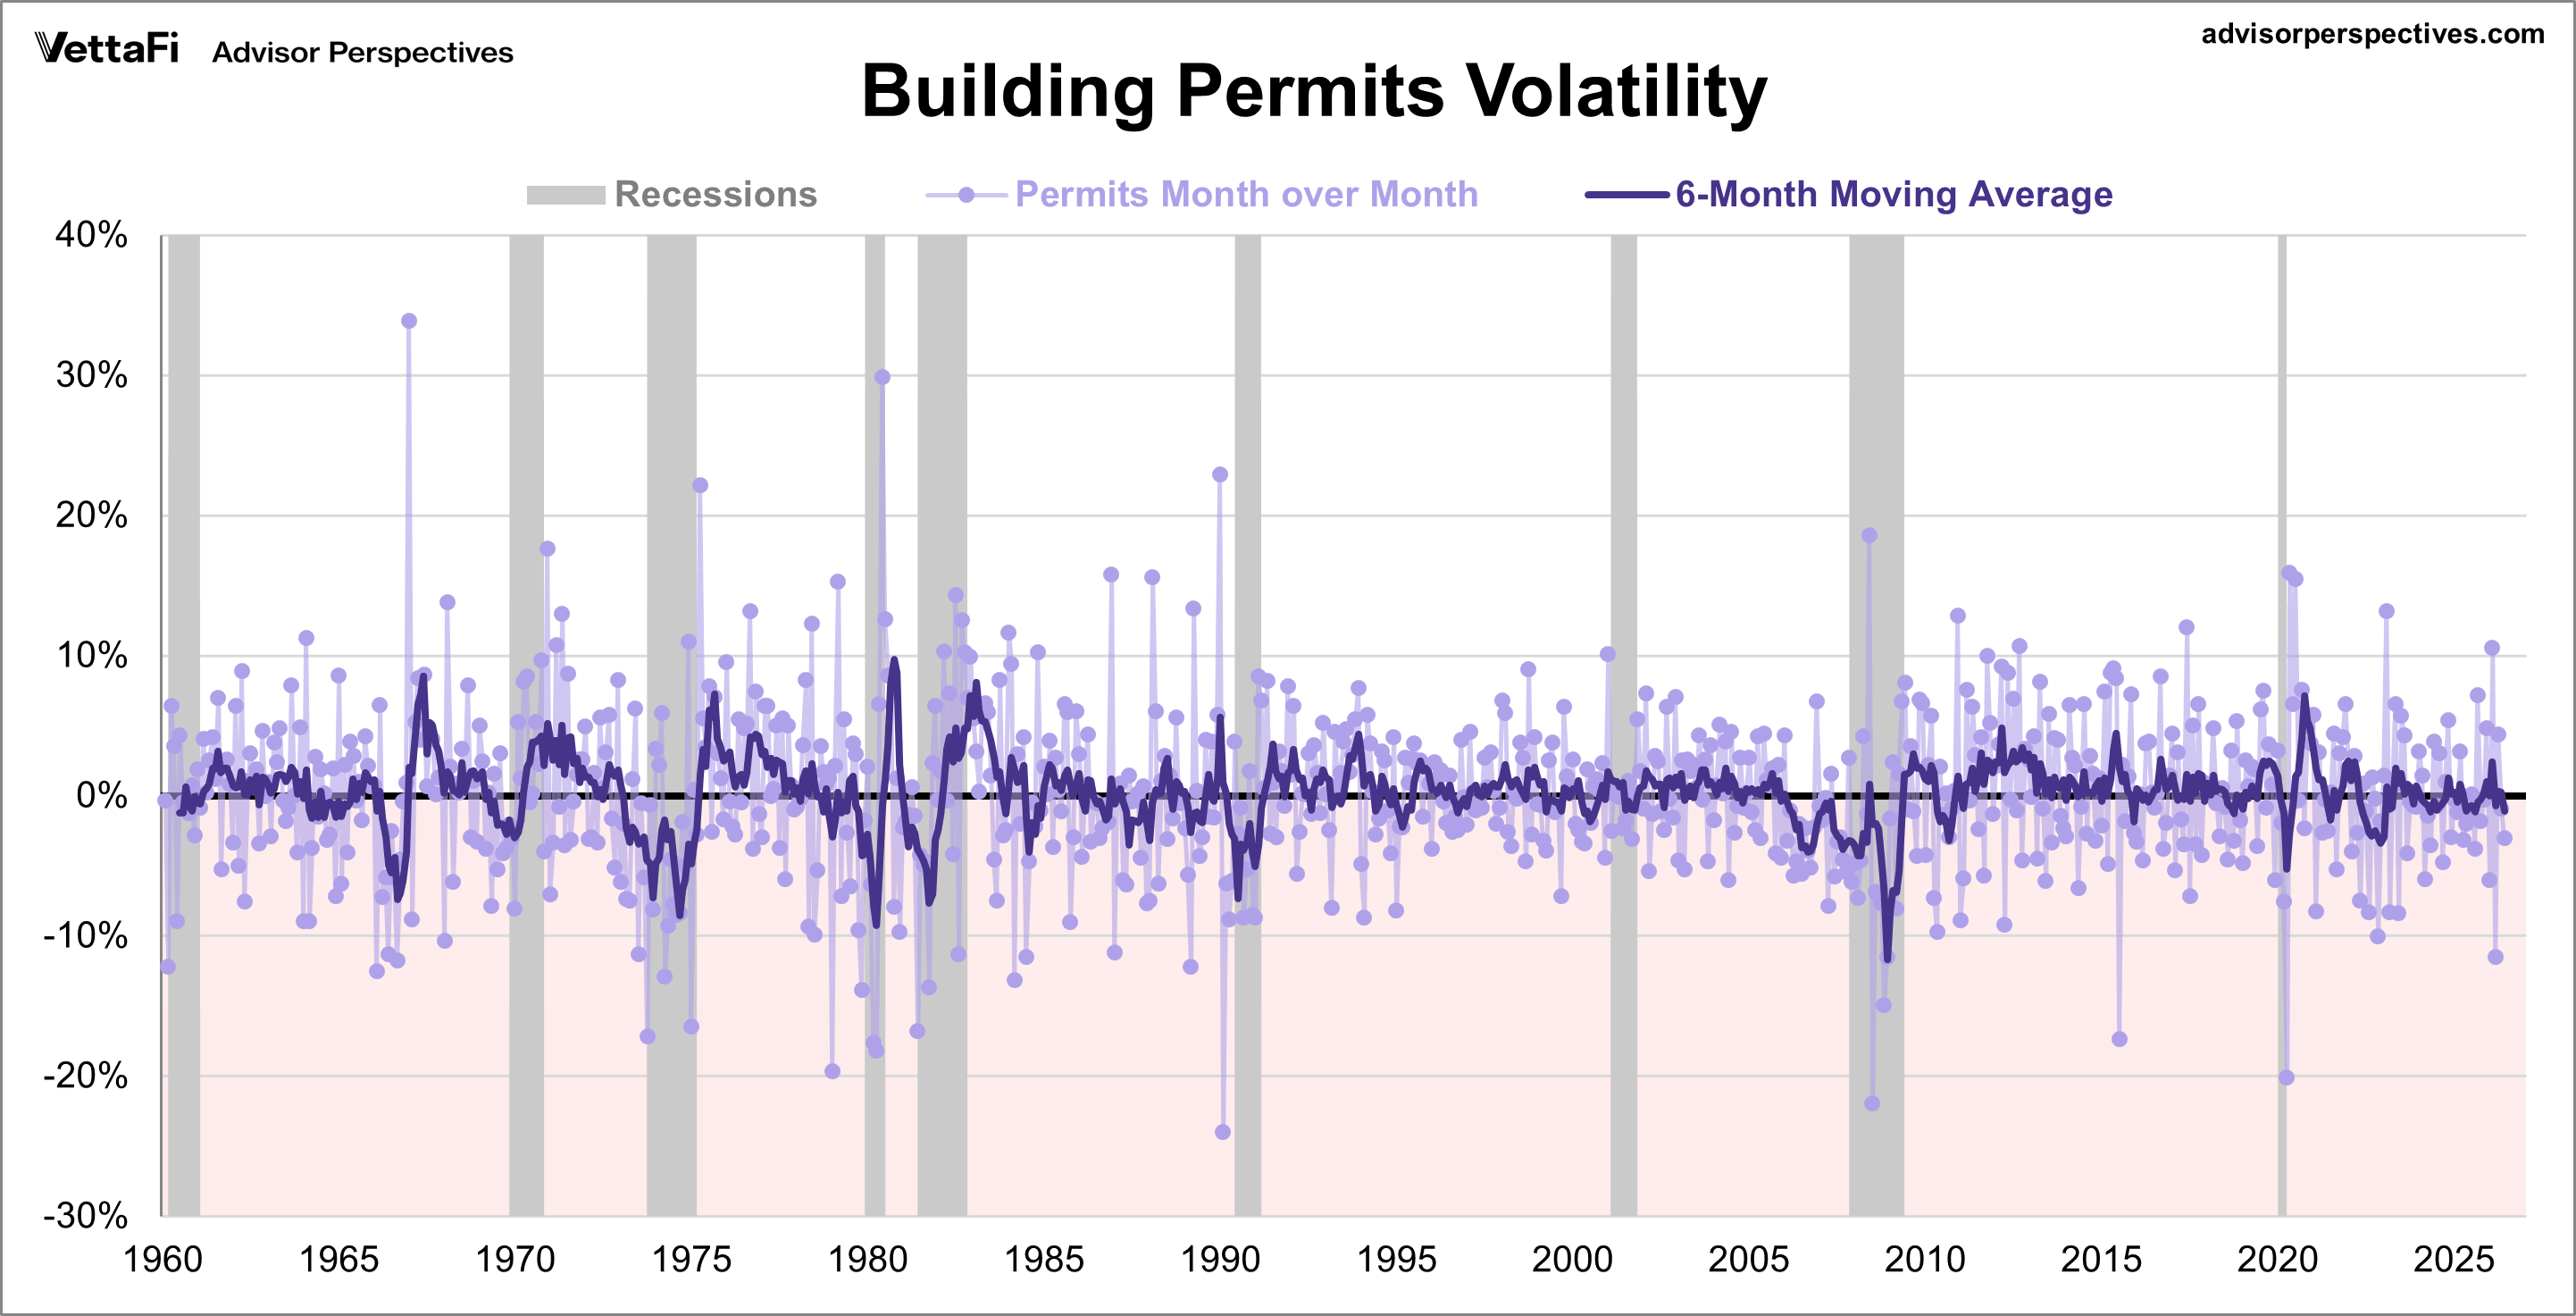
Building Permits: A Footnote on Volatility
The extreme volatility of this monthly indicator is the rationale for paying more attention to its six-month moving average than to its noisy monthly change. Over the complete data series, the absolute month-over-month average percent change was 4.4%. The month-over-month range minimum was -24.0% and the maximum was 33.9%.
For visual confirmation of the volatility, here is a snapshot of the monthly percent change since 1960.
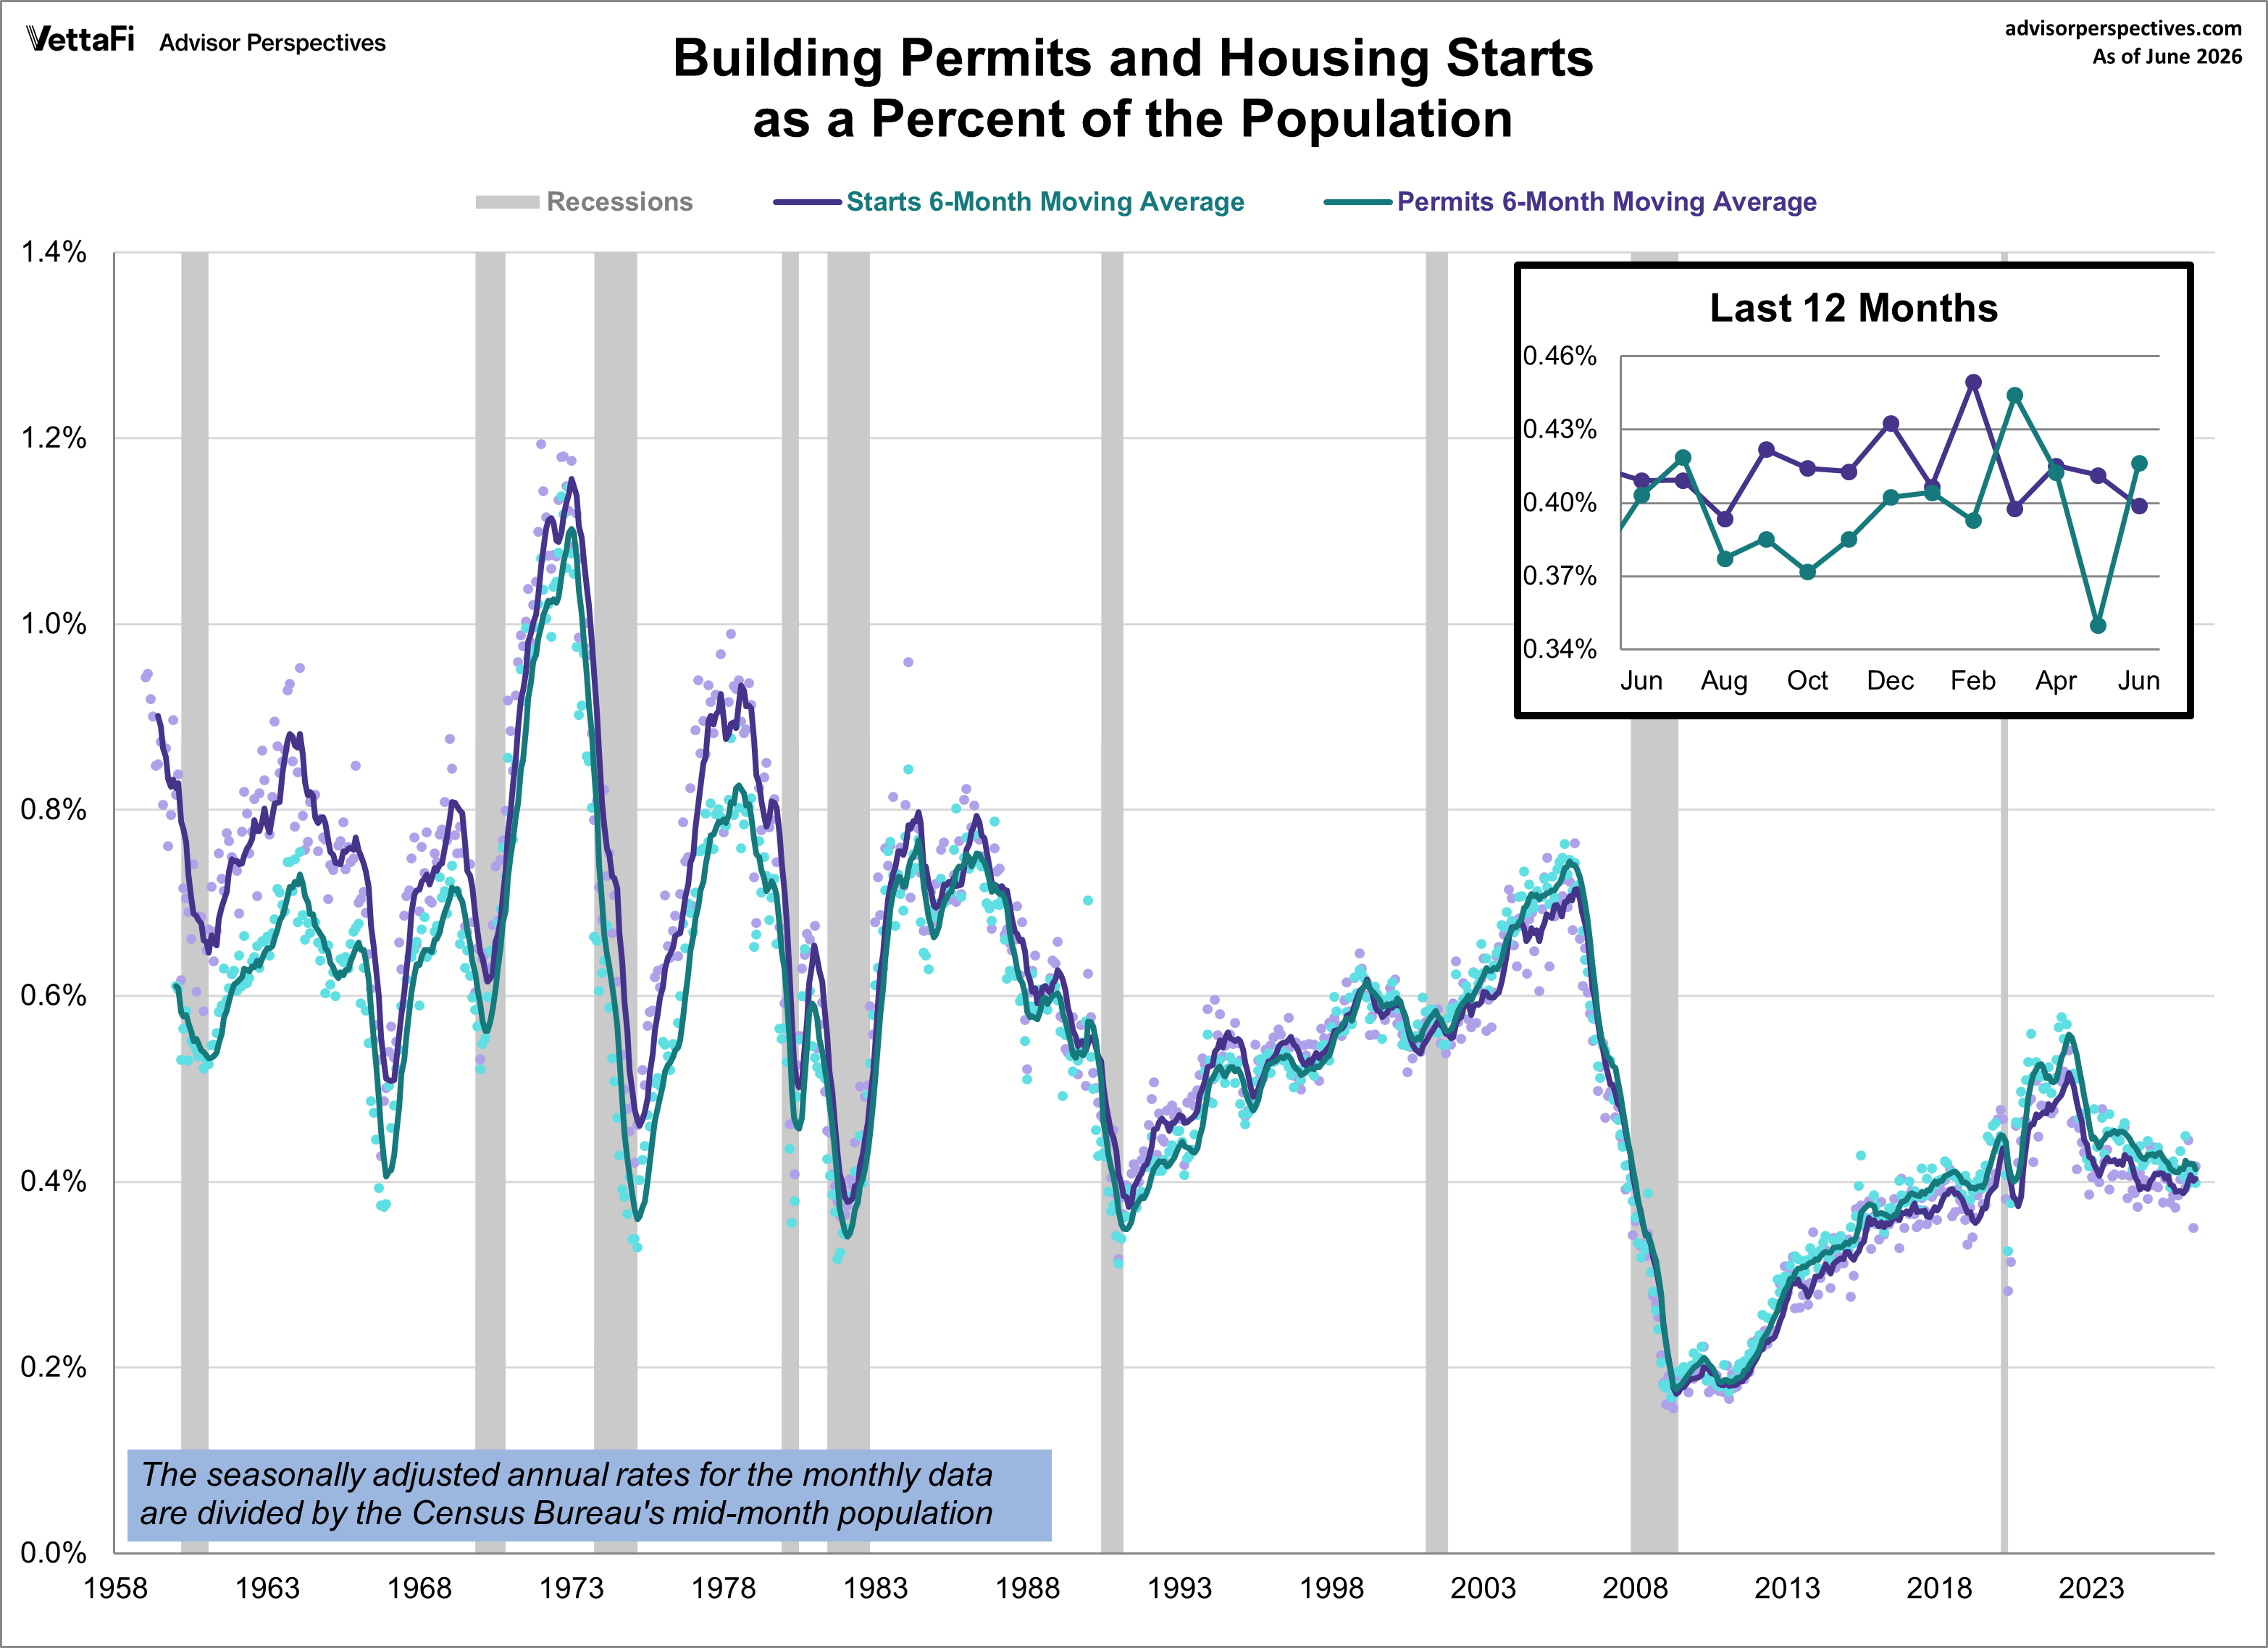
A Long-Term Look: Residential Building Permits and Housing Starts
In addition to building permits, the U.S. Census Bureau and the Department of Housing and Urban Development published their findings for new residential housing starts. Housing starts are the actual construction projects that have begun and typically follow building permits. Despite the fact that both are monthly seasonally adjusted annualized rate (SAAR) series, they are exceptionally volatile and subject to extensive revisions. Thus it is unwise to assign much significance to a single month.
Over the long haul, however, the two offer a compelling study of trends in residential real estate, especially when we adjust the permits and starts for population growth. Here is an overlay of the two series since the 1959 inception of the starts data and the 1960 inception of the permits data. The monthly data points are preserved as faint dots. The trends are illustrated with six-month moving averages of data divided by the Census Bureau's mid-month population estimates.
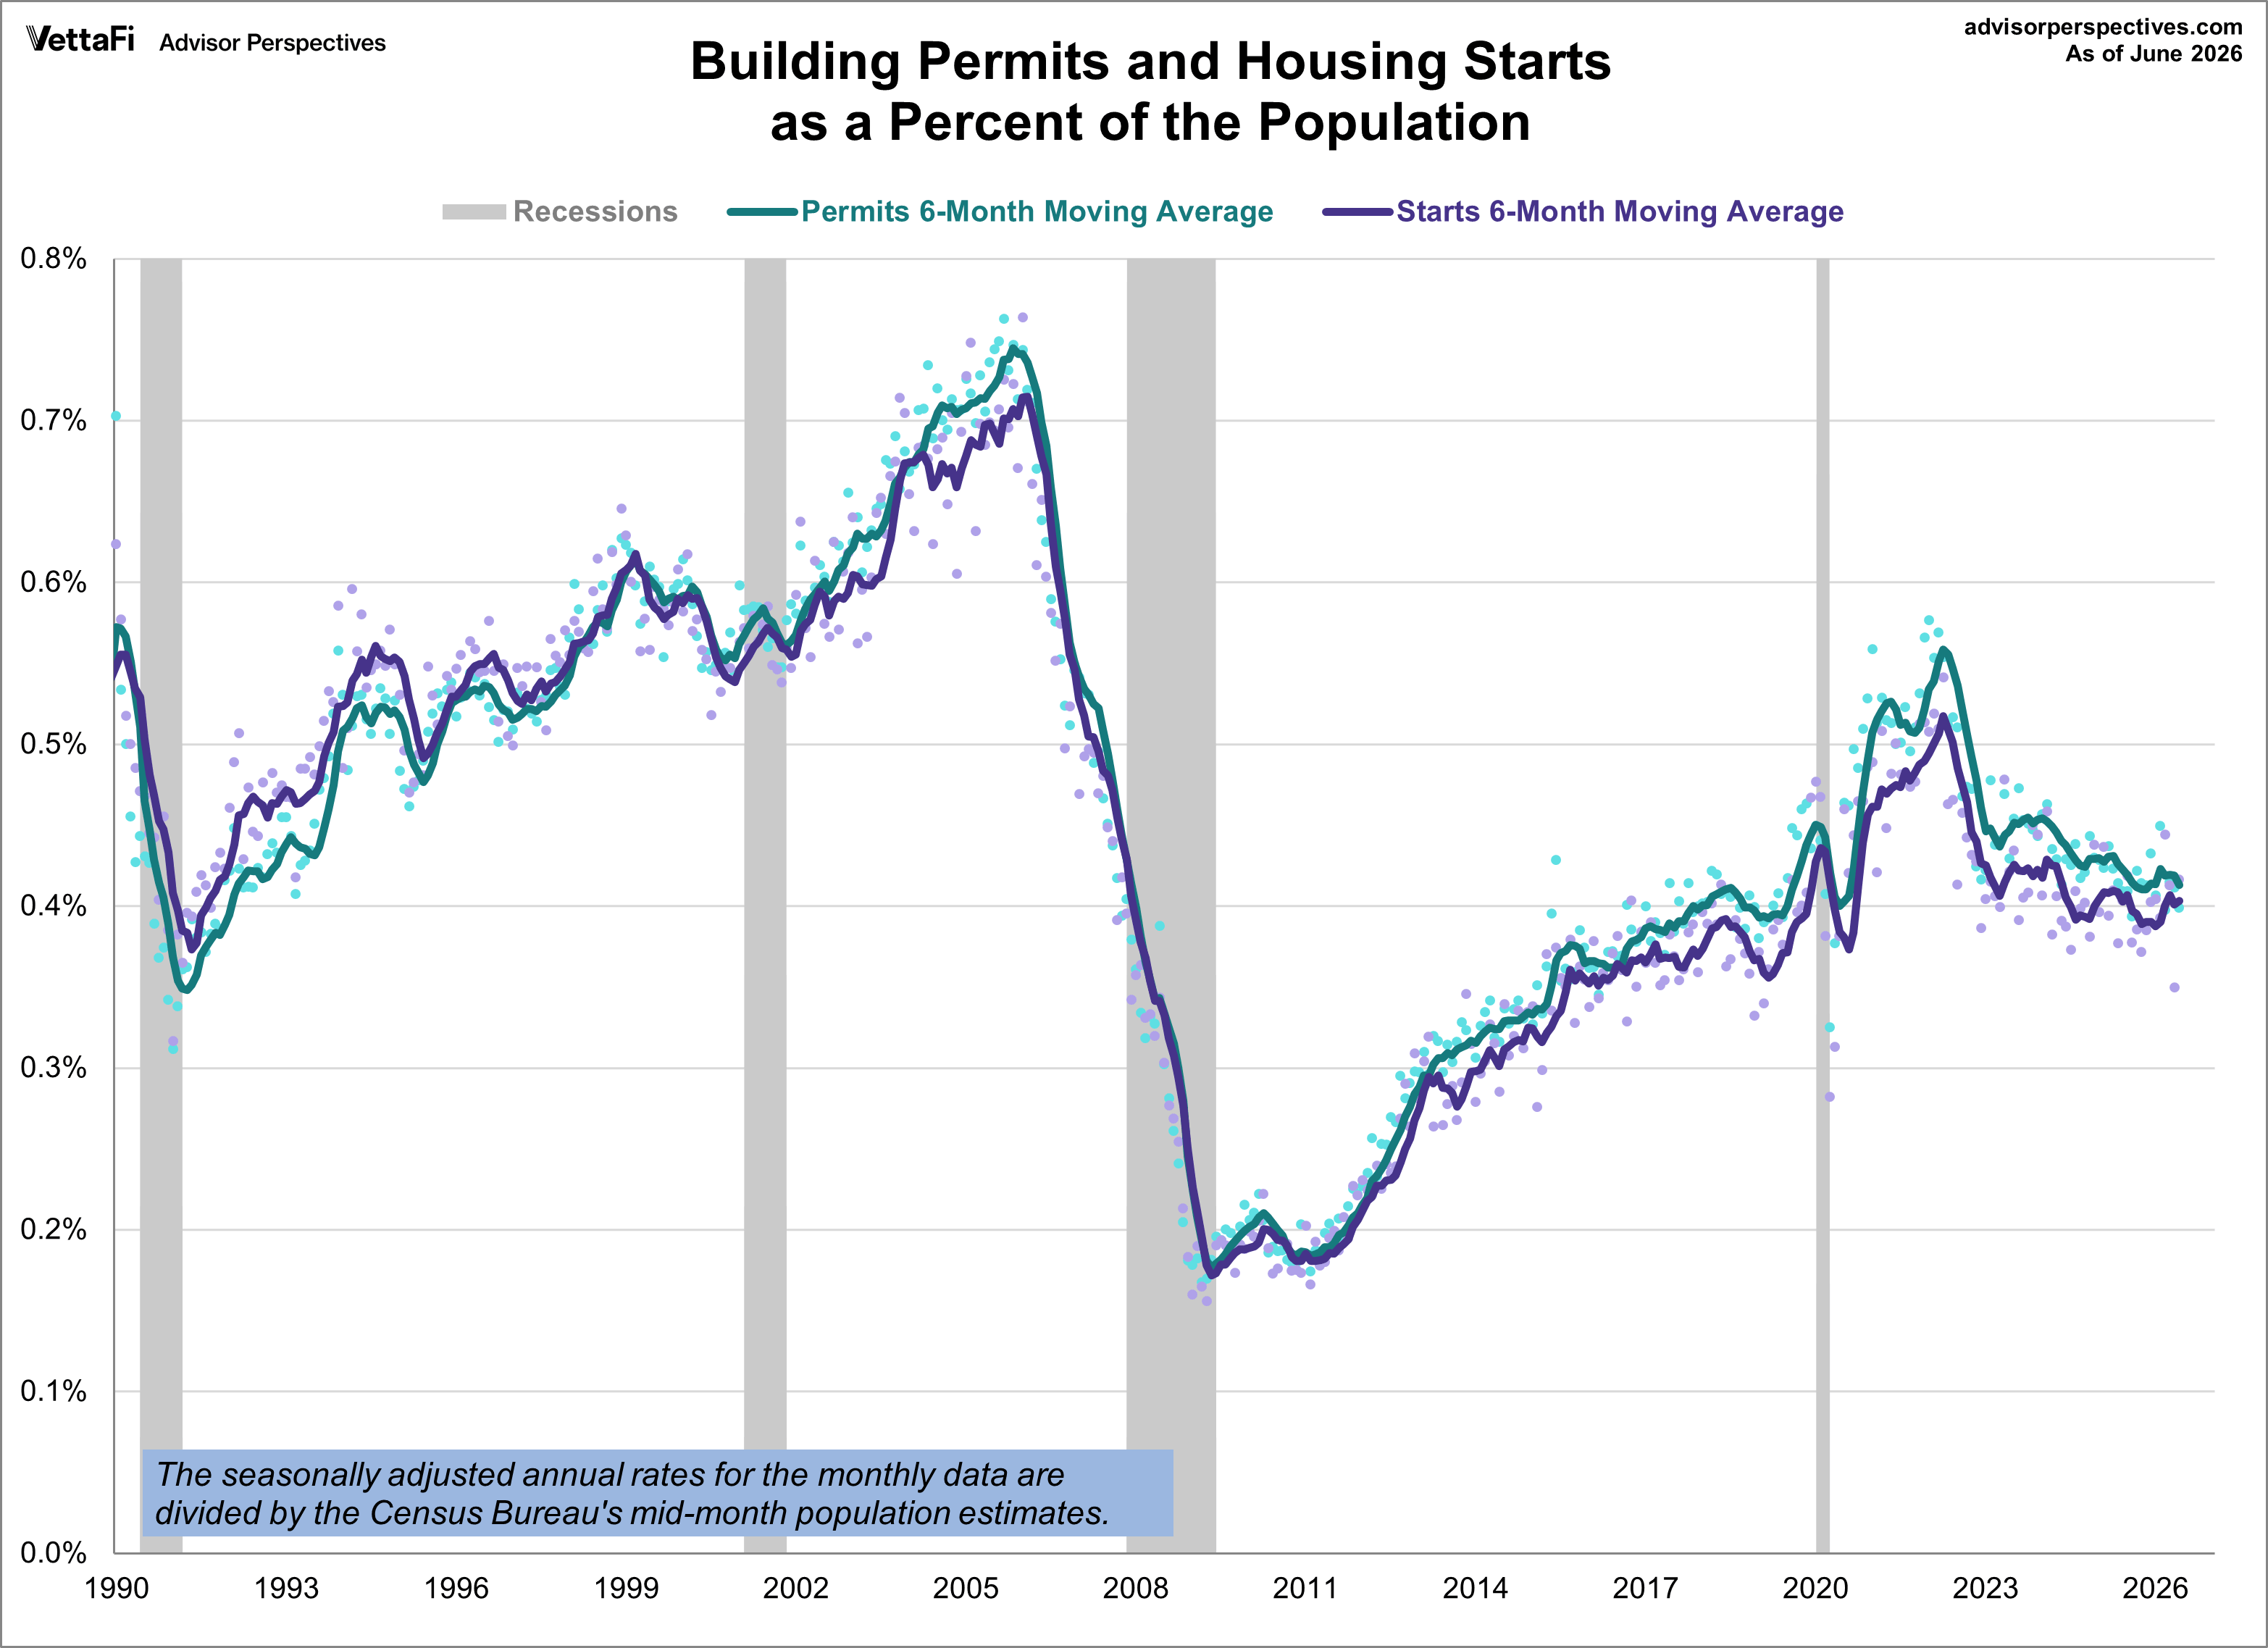
Here is a closer look at the overlay since 1990.
ETFs associated with home builders include: Invesco Dynamic Building & Construction ETF (PKB), iShares U.S. Home Construction ETF (ITB) and SPDR S&P Homebuilders ETF (XHB).
ETFs associated with residential real estate include: iShares Residential and Multisector Real Estate ETF (REZ).
Membership required
Membership is now required to use this feature. To learn more:
View Membership BenefitsSponsored Content
Editorial Calendar
View Full Calendar Eastern Time Zone
+ Add the editorial calendar to your Google Calendar.
Upcoming Virtual Events View All


