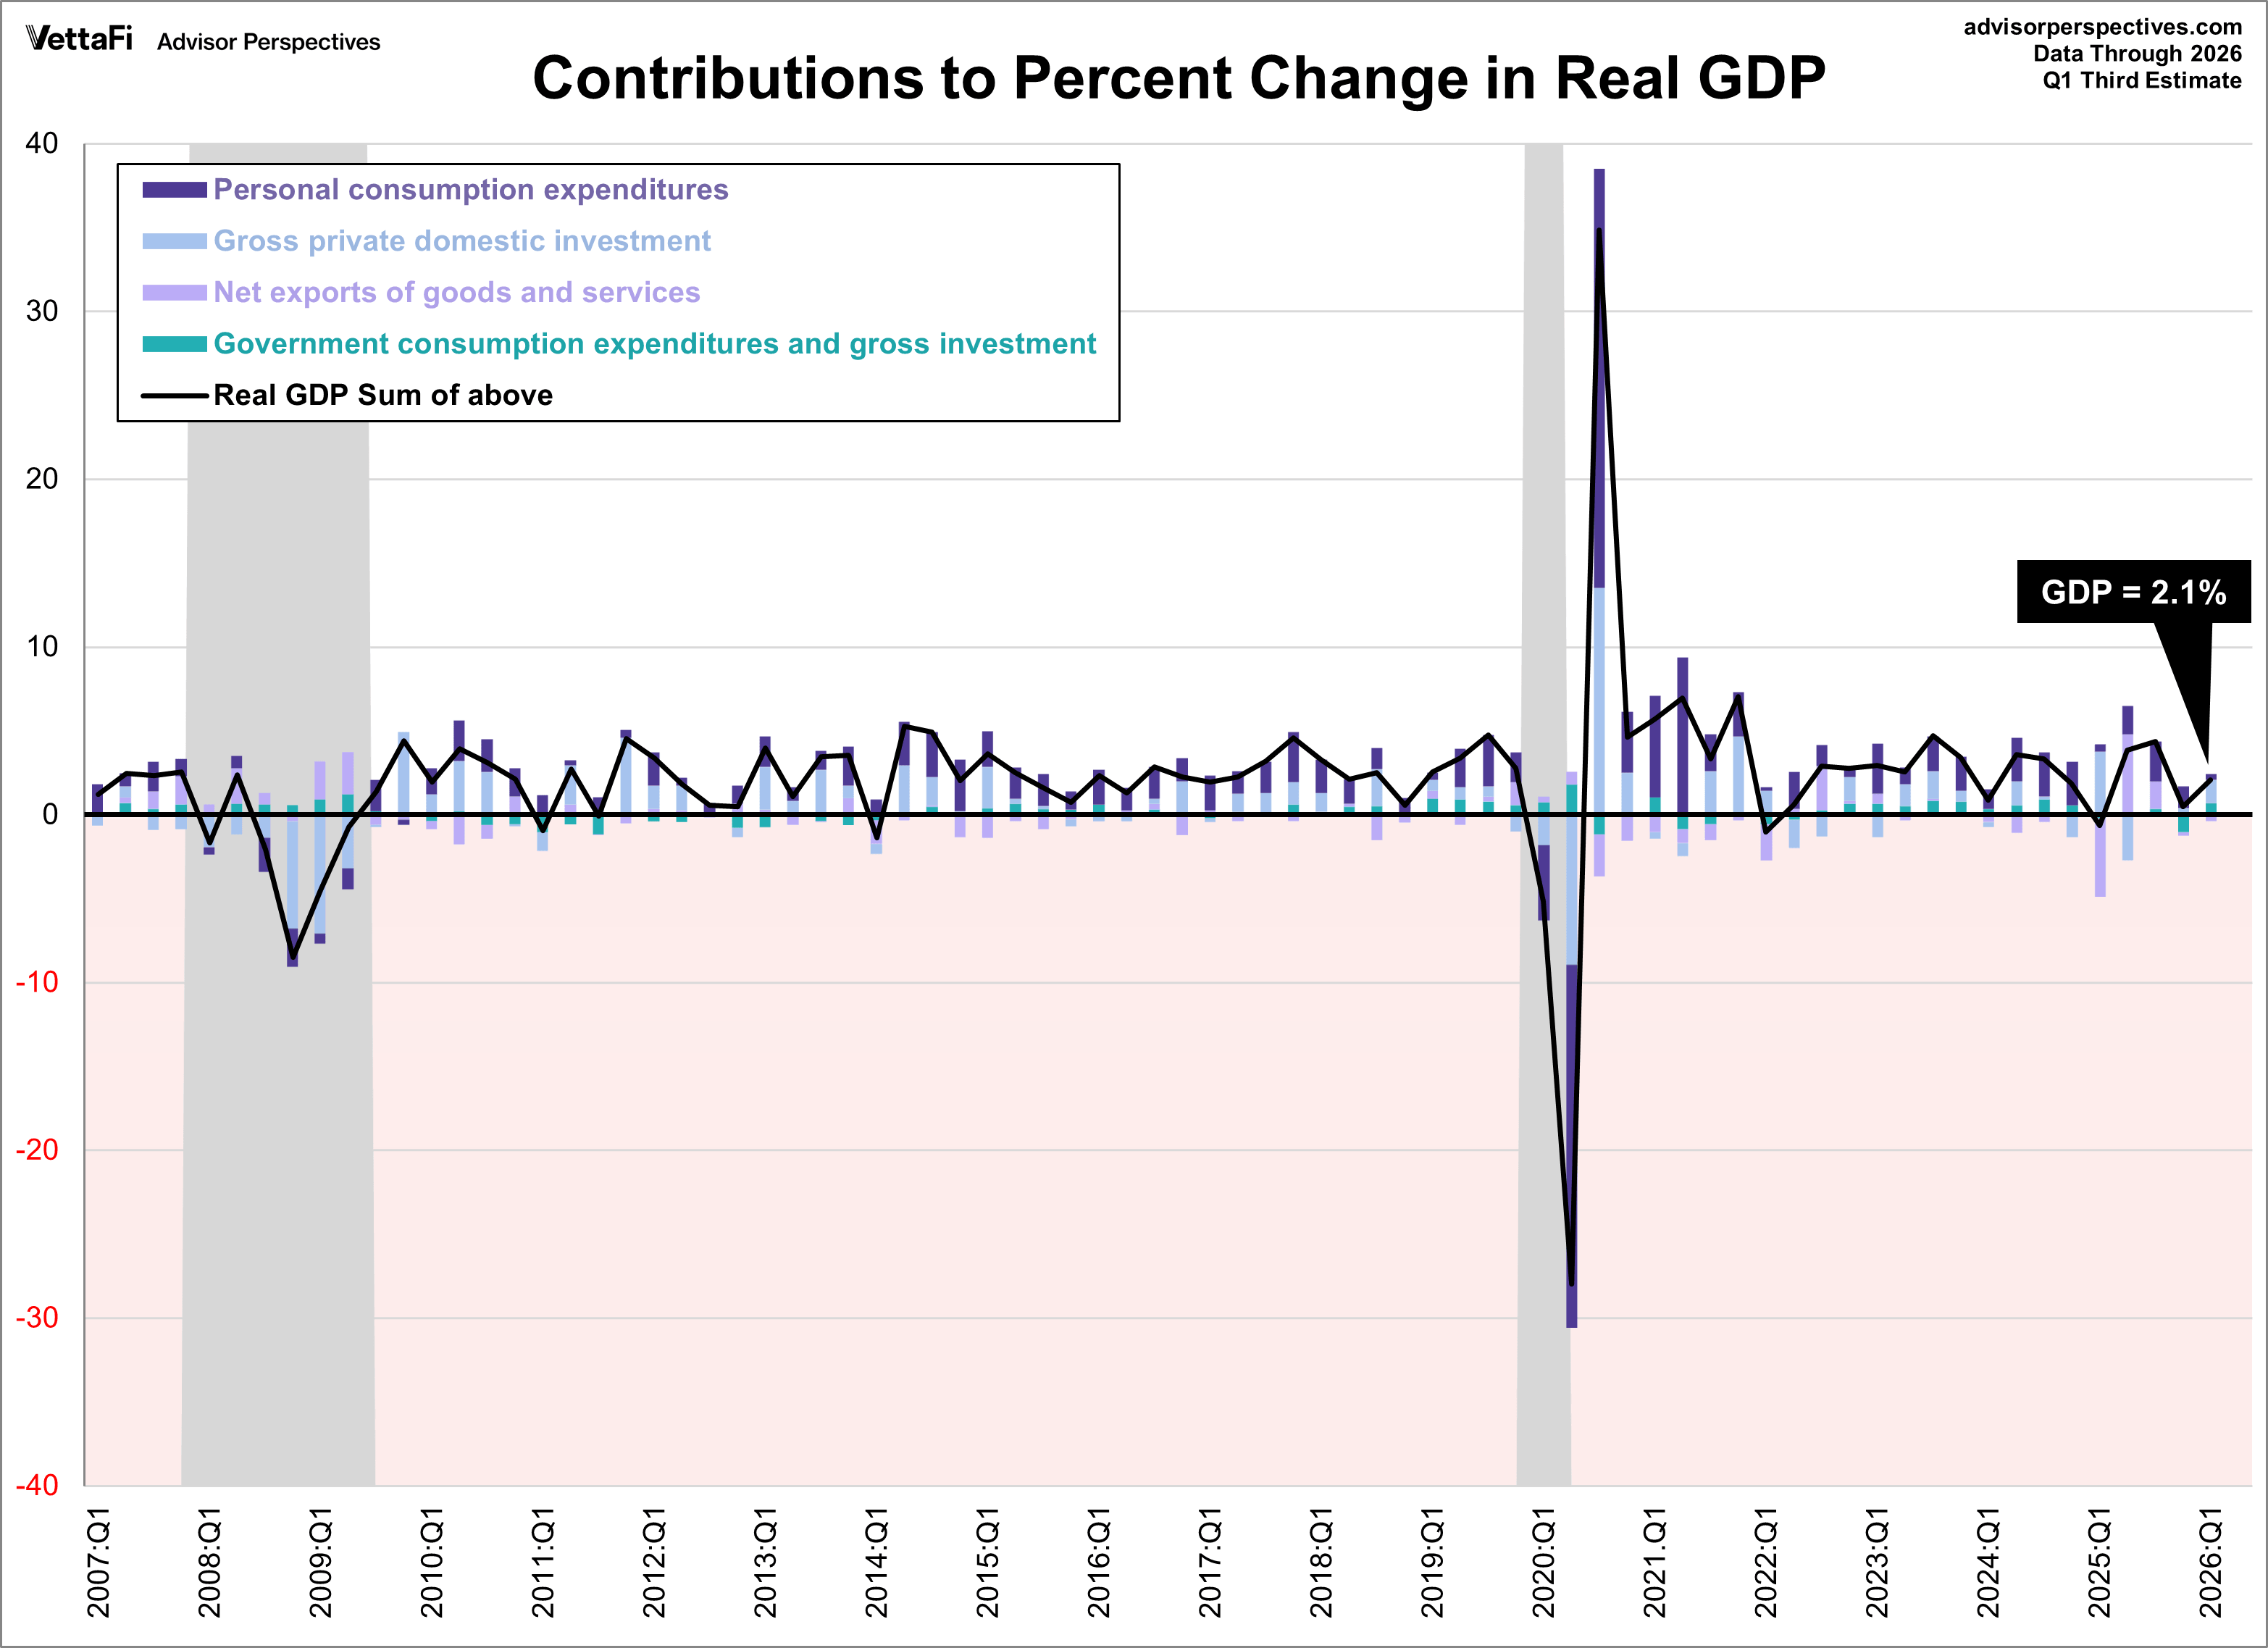
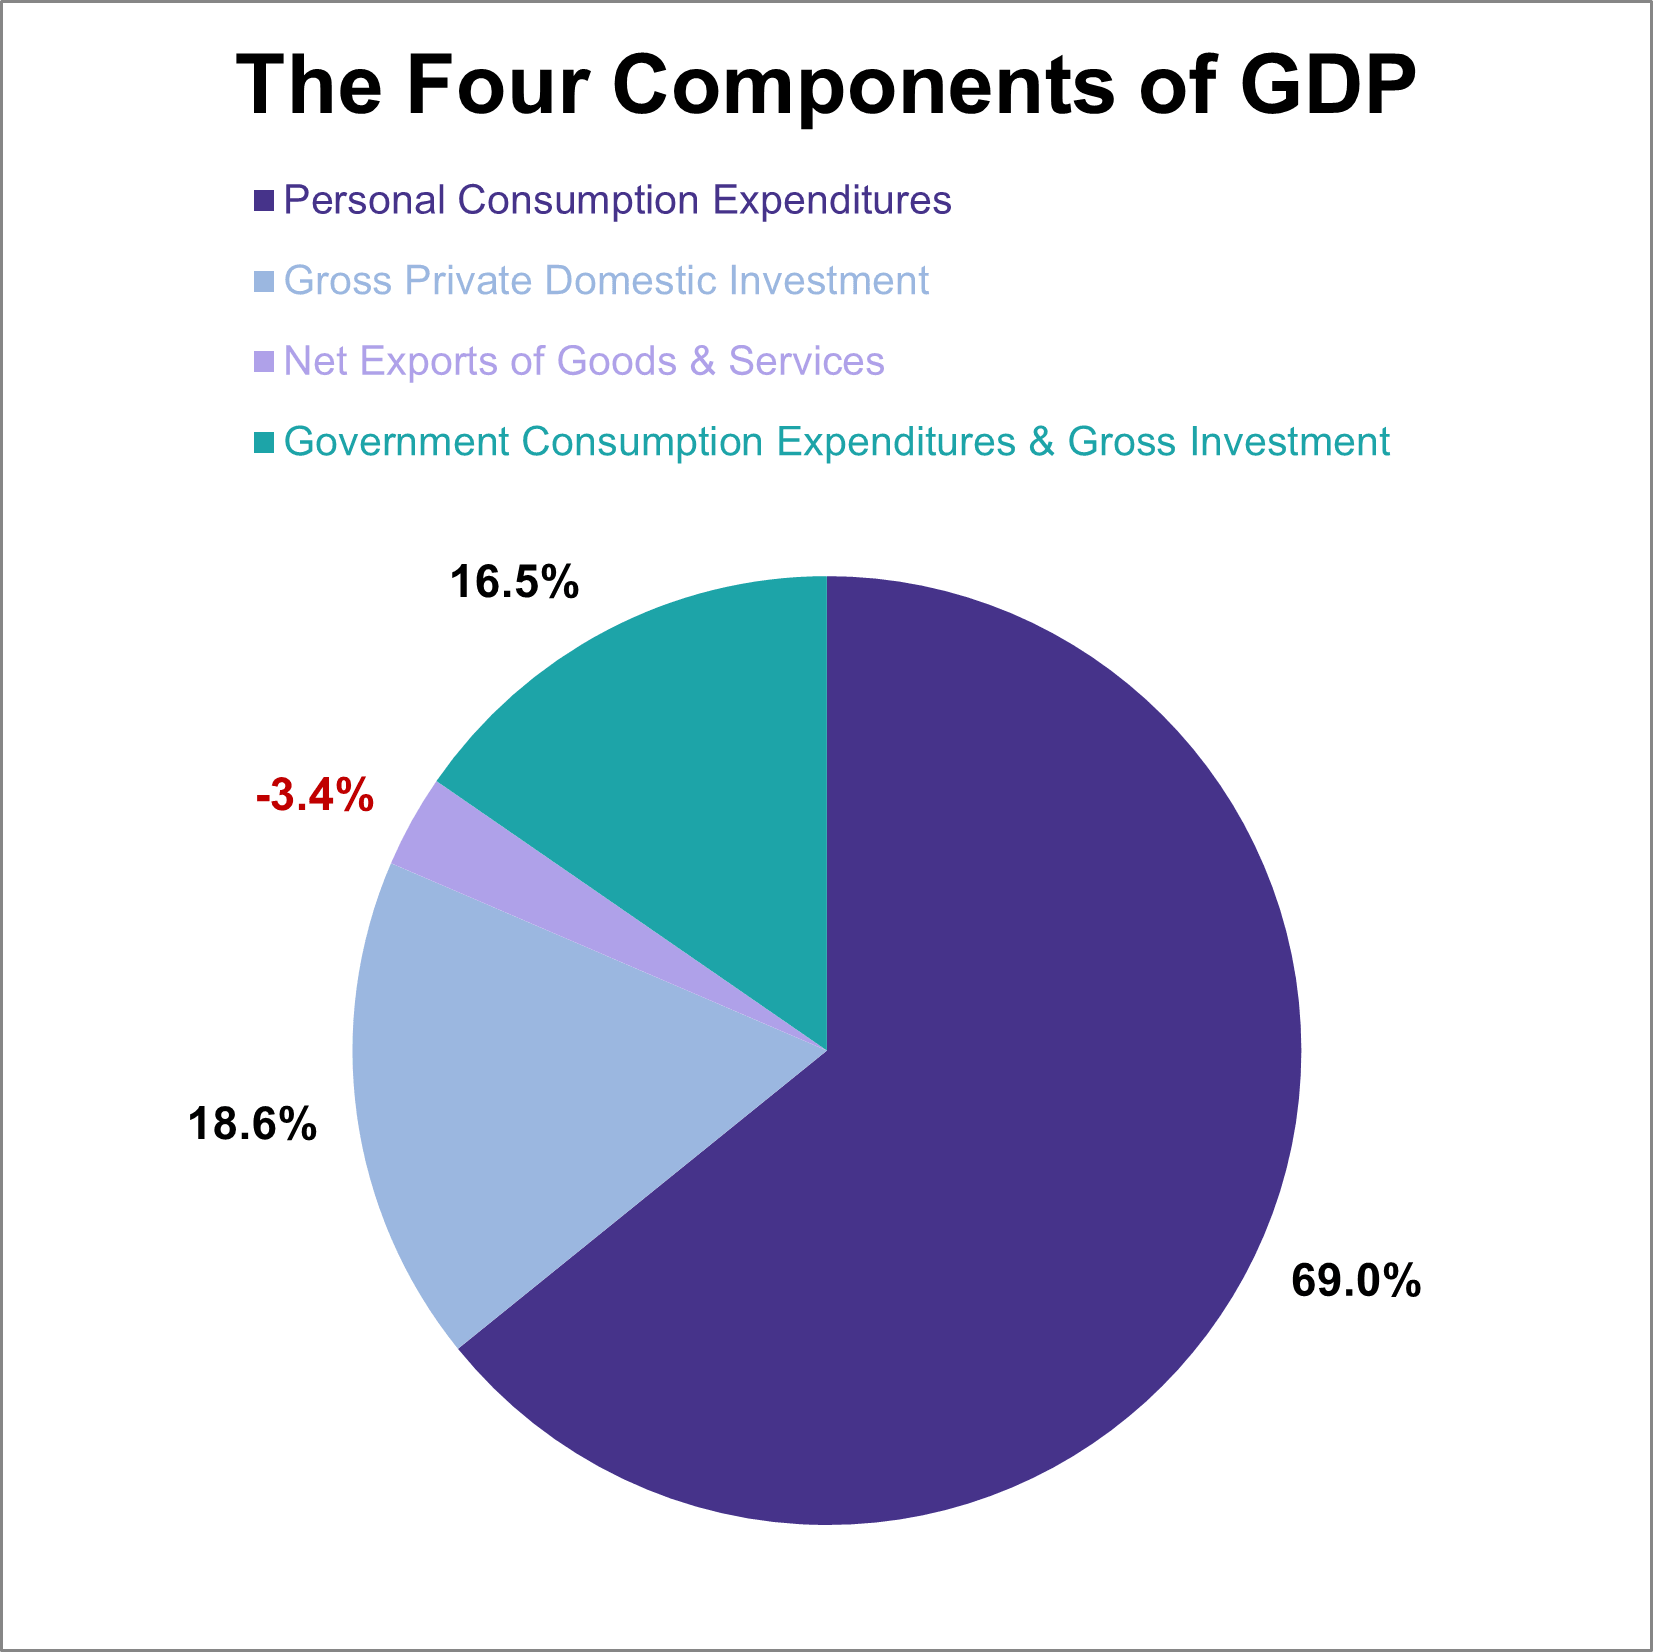
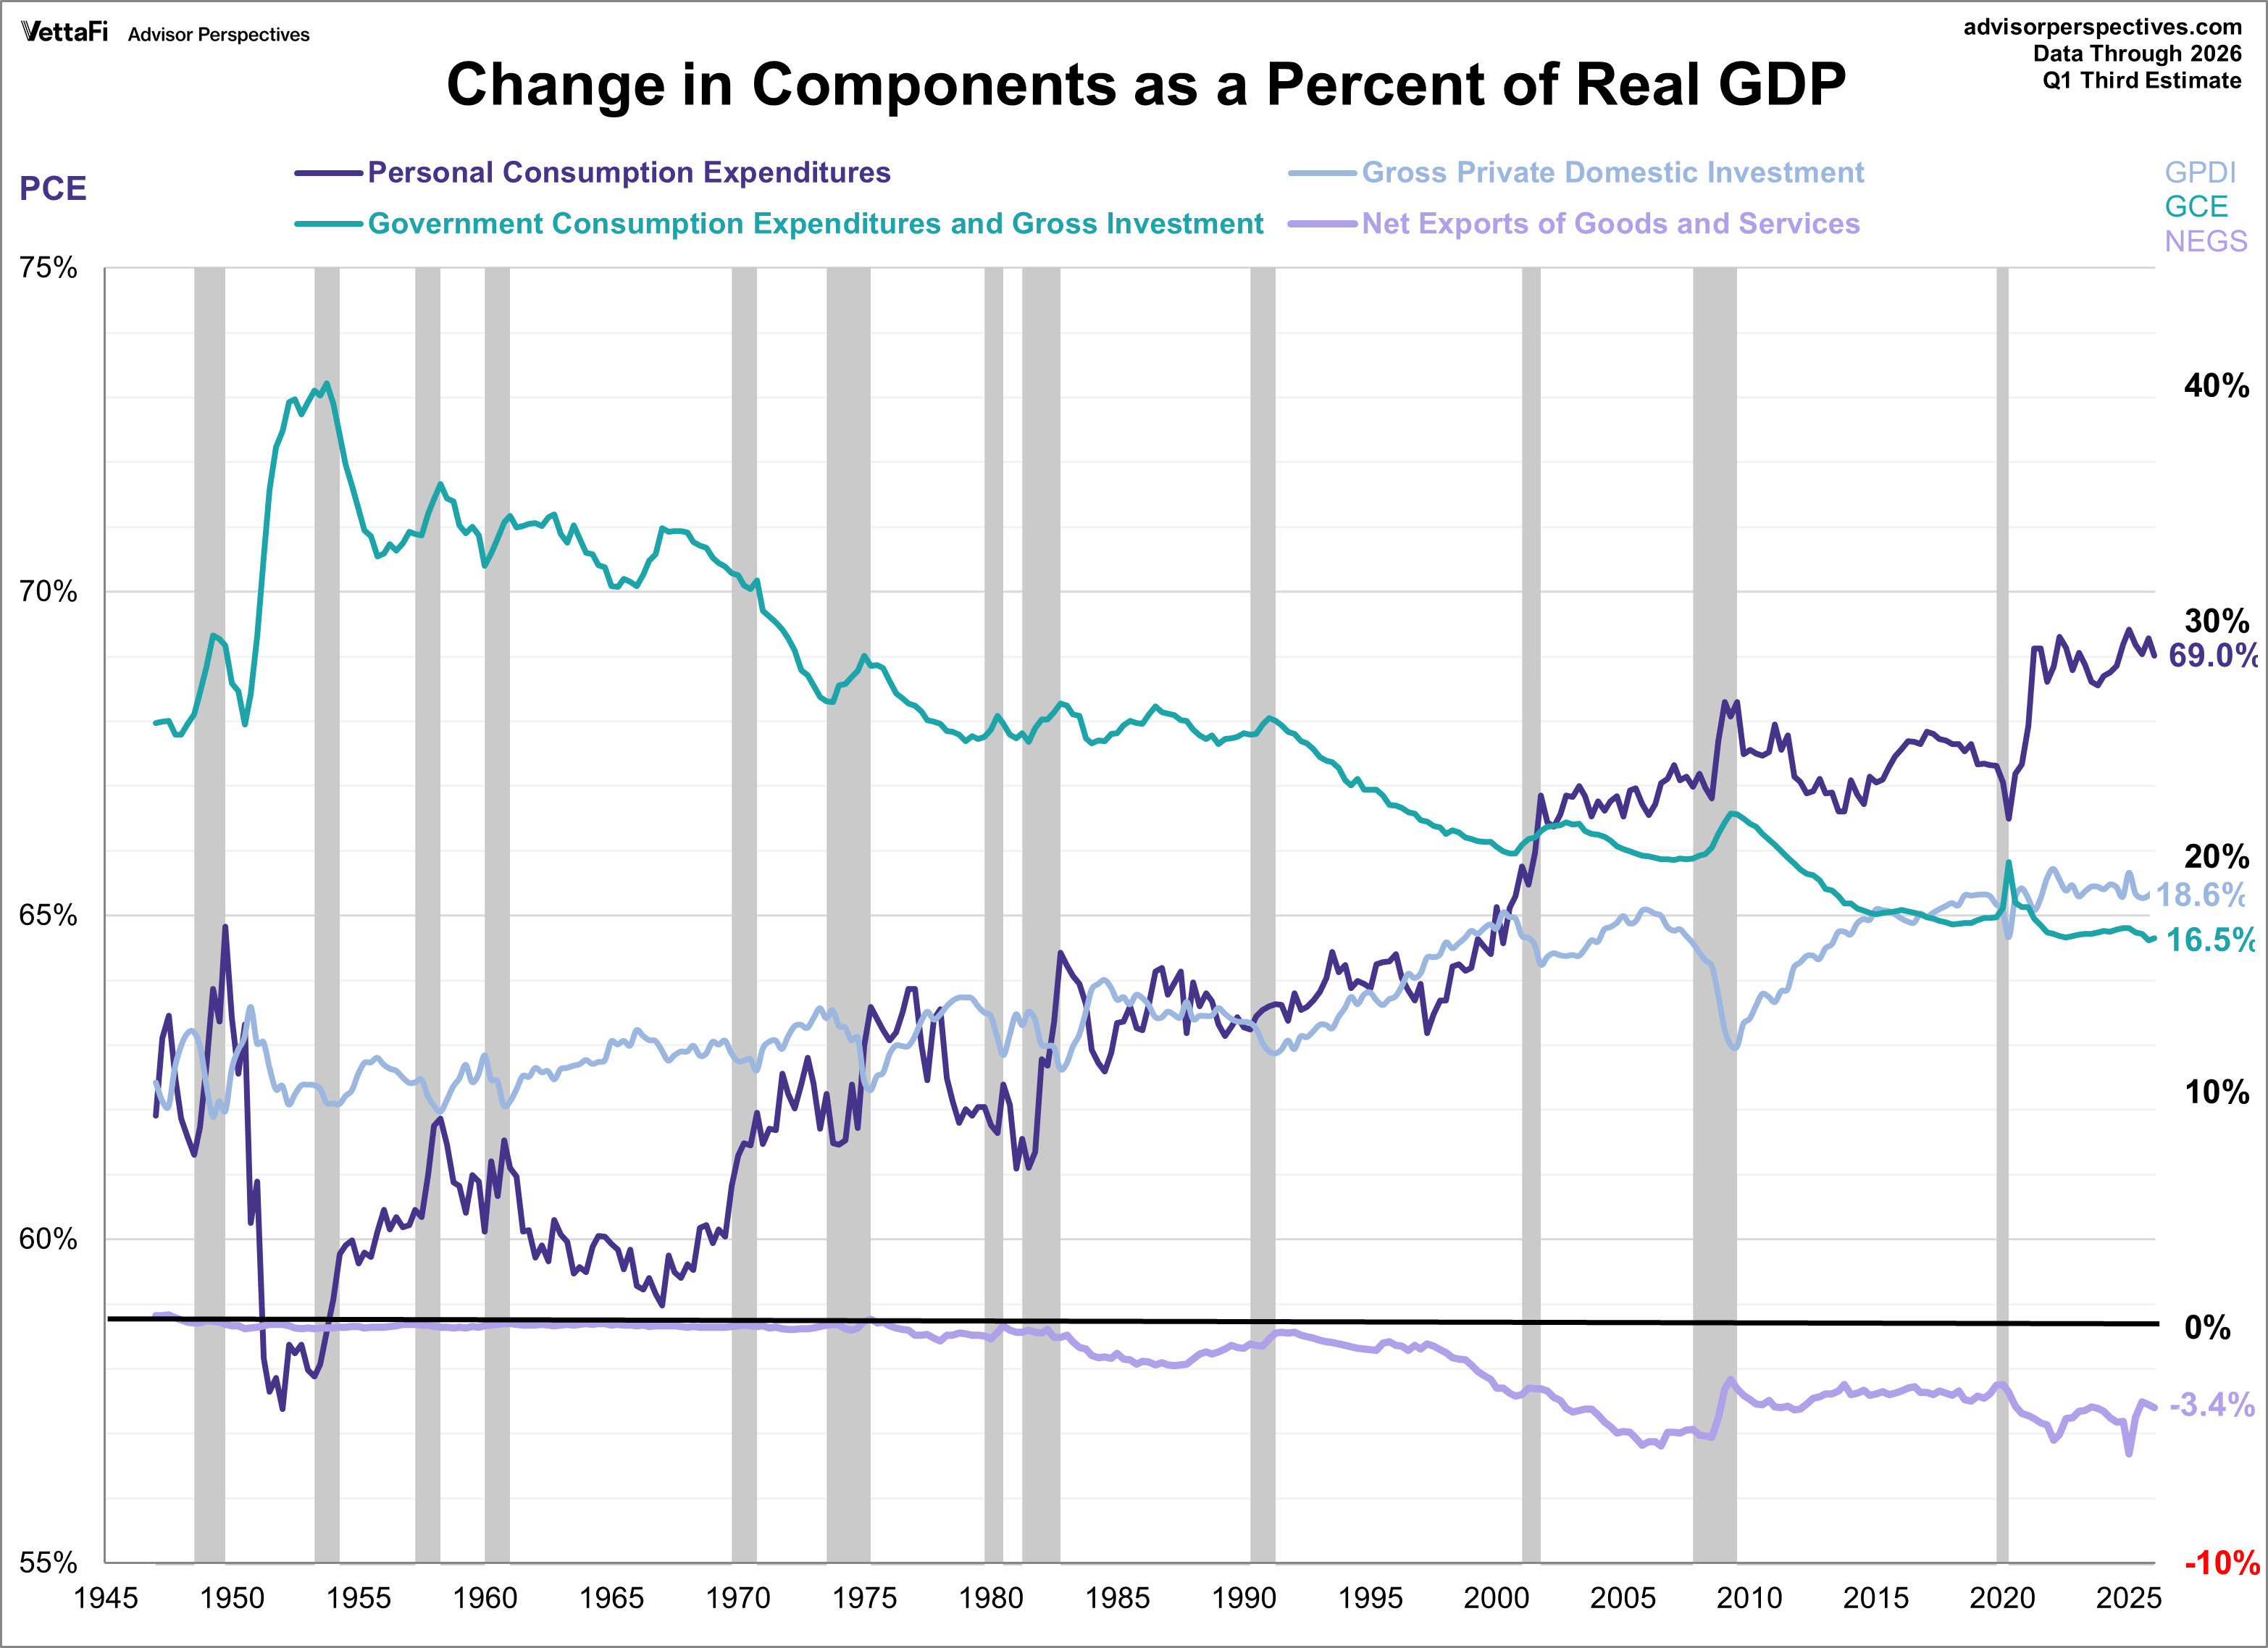
Real gross domestic product (GDP) is comprised of four major subcomponents: personal consumption expenditures, gross private domestic investment, net exports, and government consumption expenditures. In the latest Q1 2026 third estimate it was reported that real GDP increased at an annual rate of 2.1% with three of the four components making positive contributions.
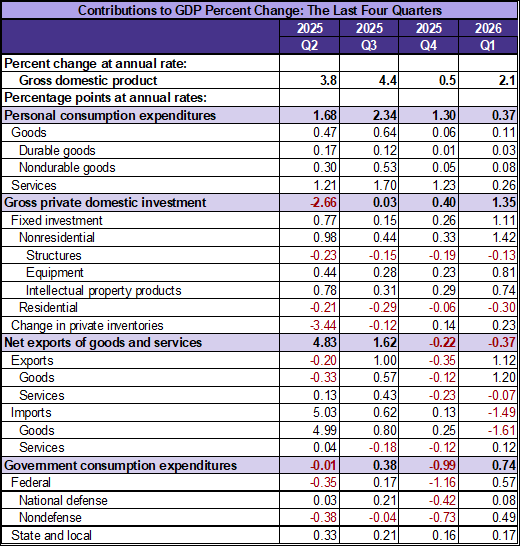
Real gross domestic product (GDP) increased at an annual rate of 2.1 percent in the first quarter of 2026 (January, February, and March), according to the third estimate released today by the U.S. Bureau of Economic Analysis. In the fourth quarter of 2025, real GDP increased 0.5 percent. The contributors to the increase in real GDP in the first quarter were increases in investment, exports, government spending, and consumer spending. Imports, which are a subtraction in the calculation of GDP, increased. (Link)
 |
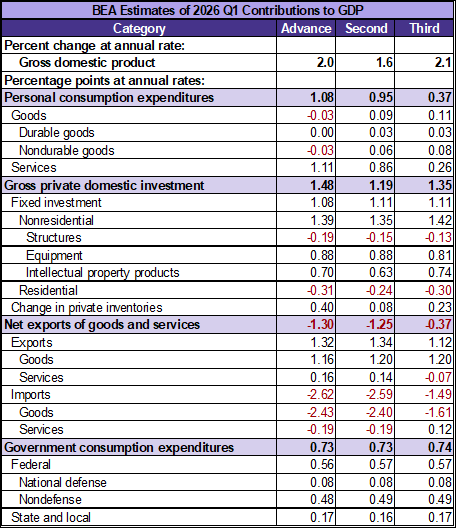 |
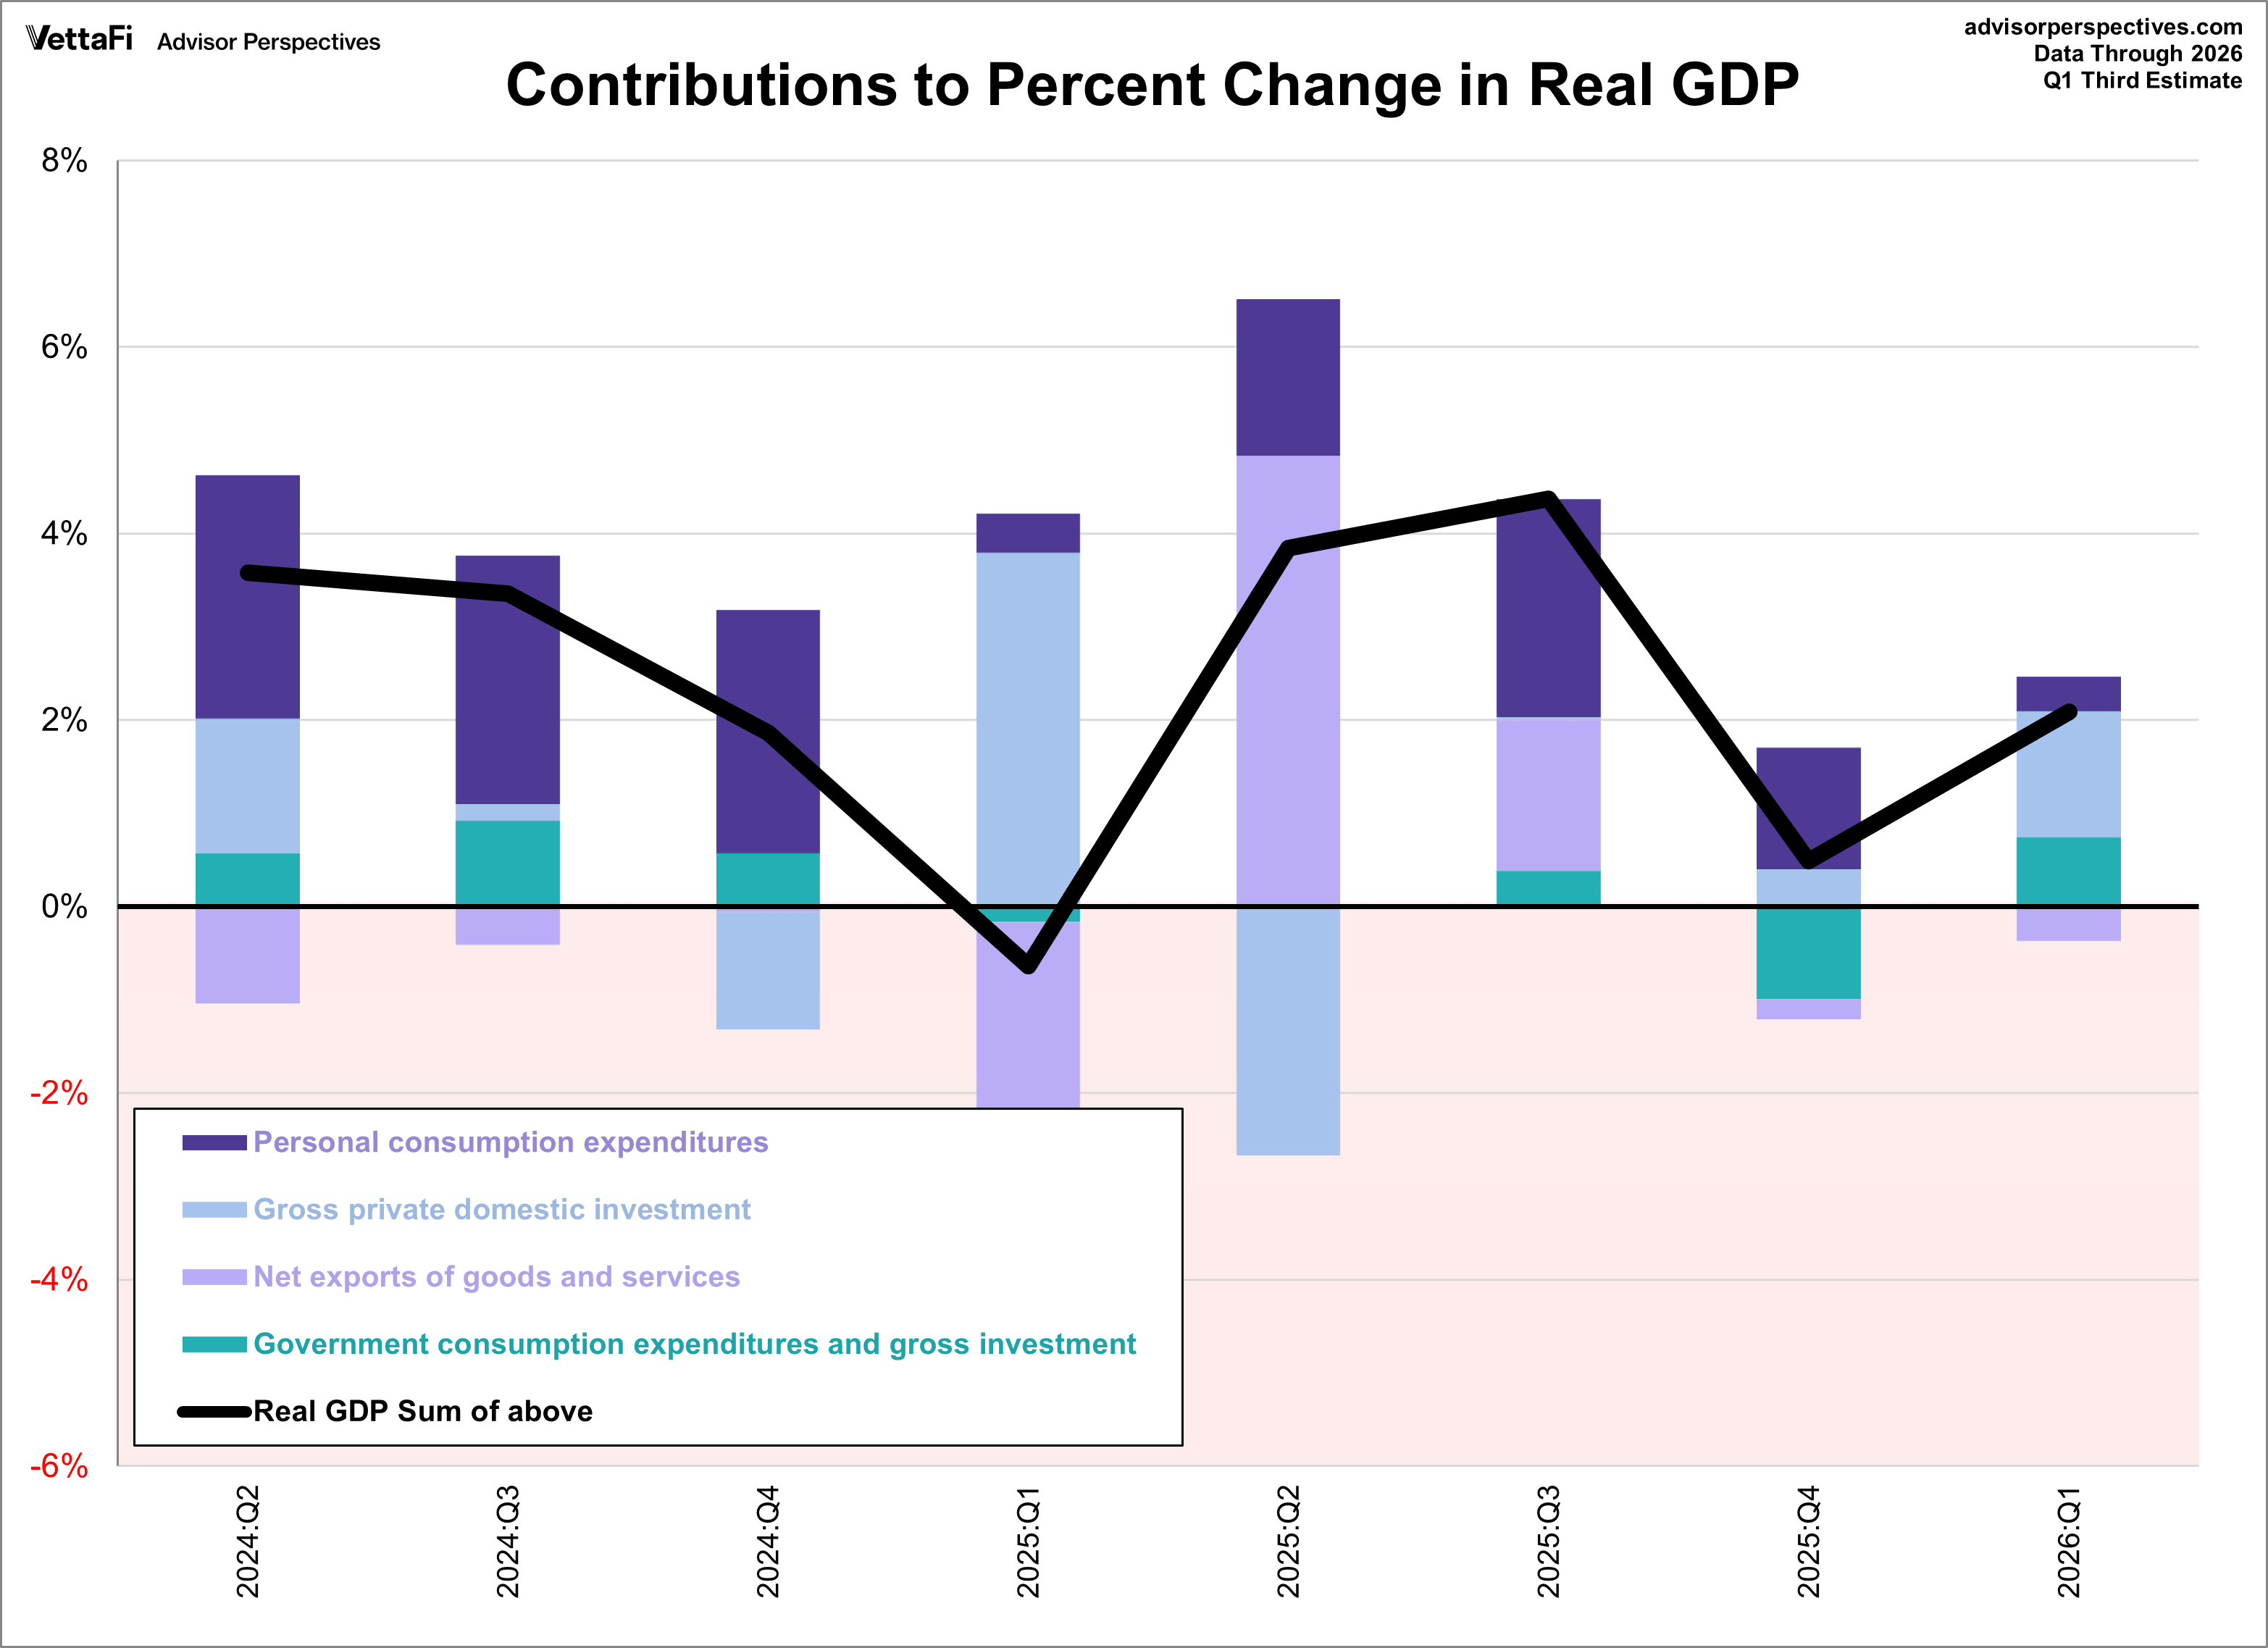
- Personal consumption expenditures (PCE) contributed 0.37
- Down from Q1 second estimate
- Down from Q4 final estimate
- Gross private domestic investment (GPDI) contributed 1.35
- Up from Q1 second estimate
- Up from Q4 final estimate
- Net exports of goods and services (NEGS) contributed -0.37
- Up from Q1 second estimate
- Down from Q4 final estimate
- Government consumption expenditures (GCE) contributed 0.74
- Up from Q1 second estimate
- Up from Q4 final estimate
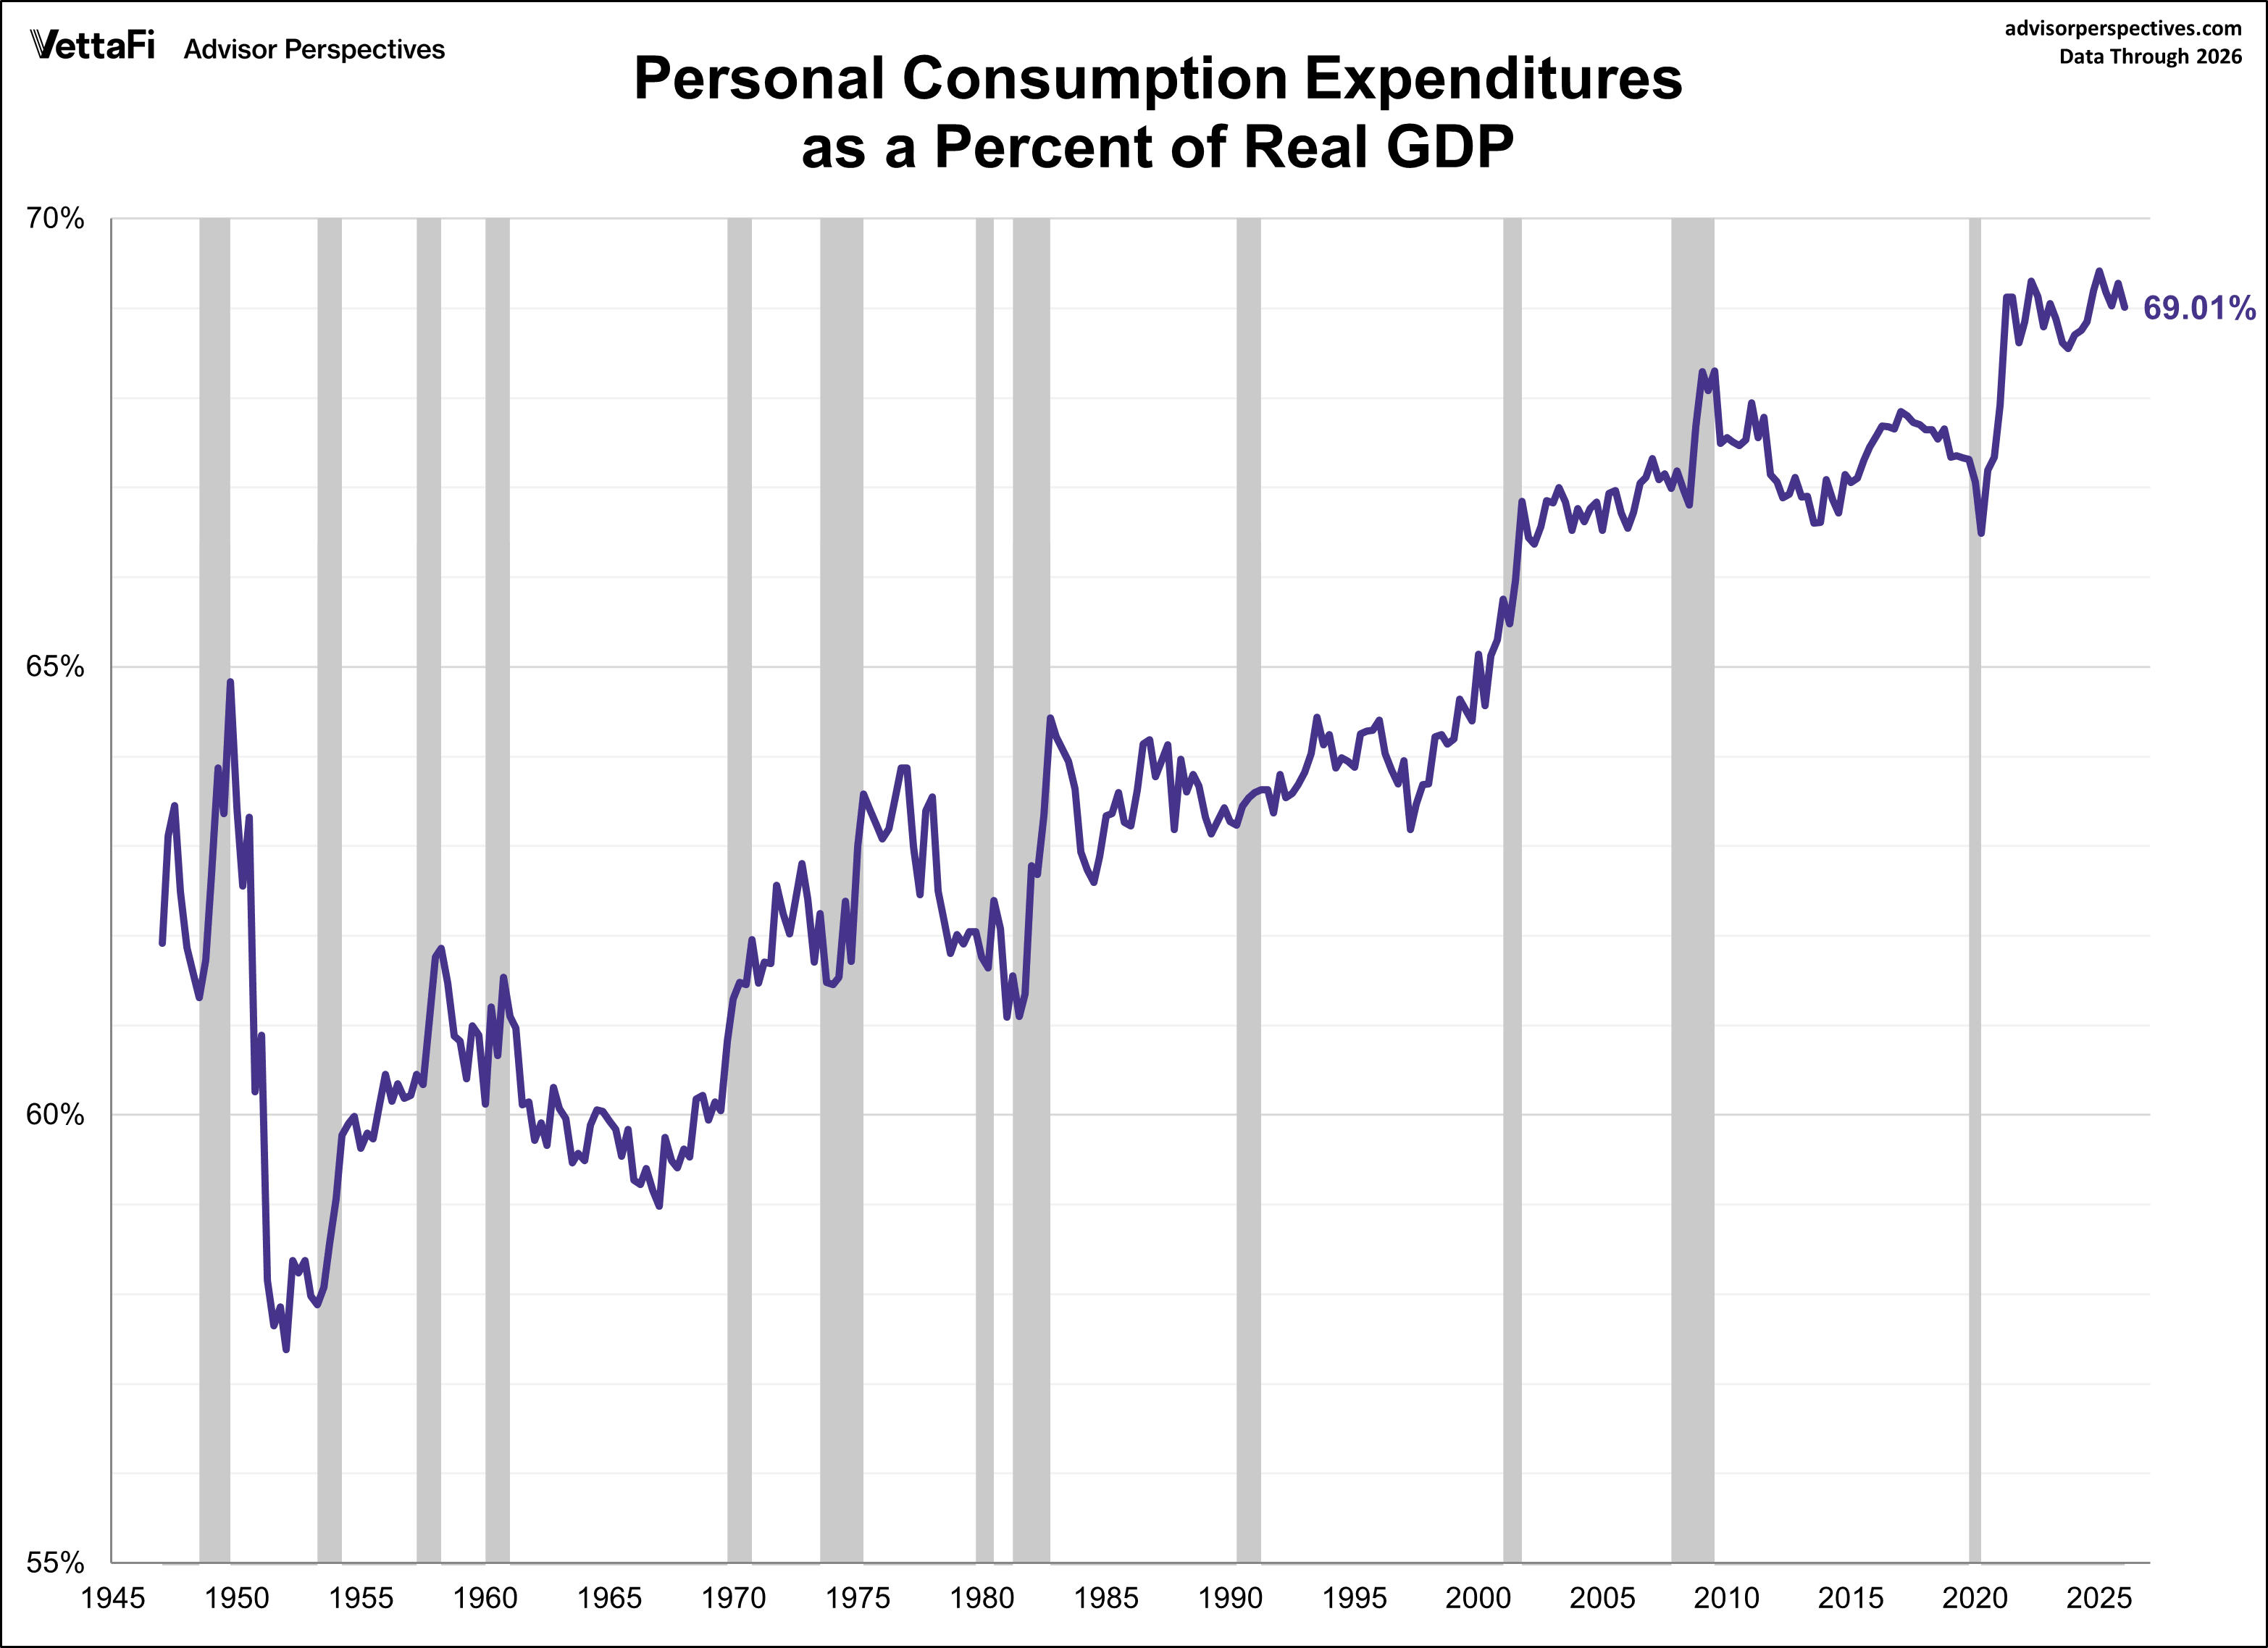
Over time, the personal consumption expenditures (PCE) component has demonstrated the strongest and most consistent correlation with real GDP. When PCE is positive, GDP tends to be positive as well, and when PCE declines, GDP often follows. However, there have been exceptions, such as in Q2 2022 and more recently, Q1 2025.