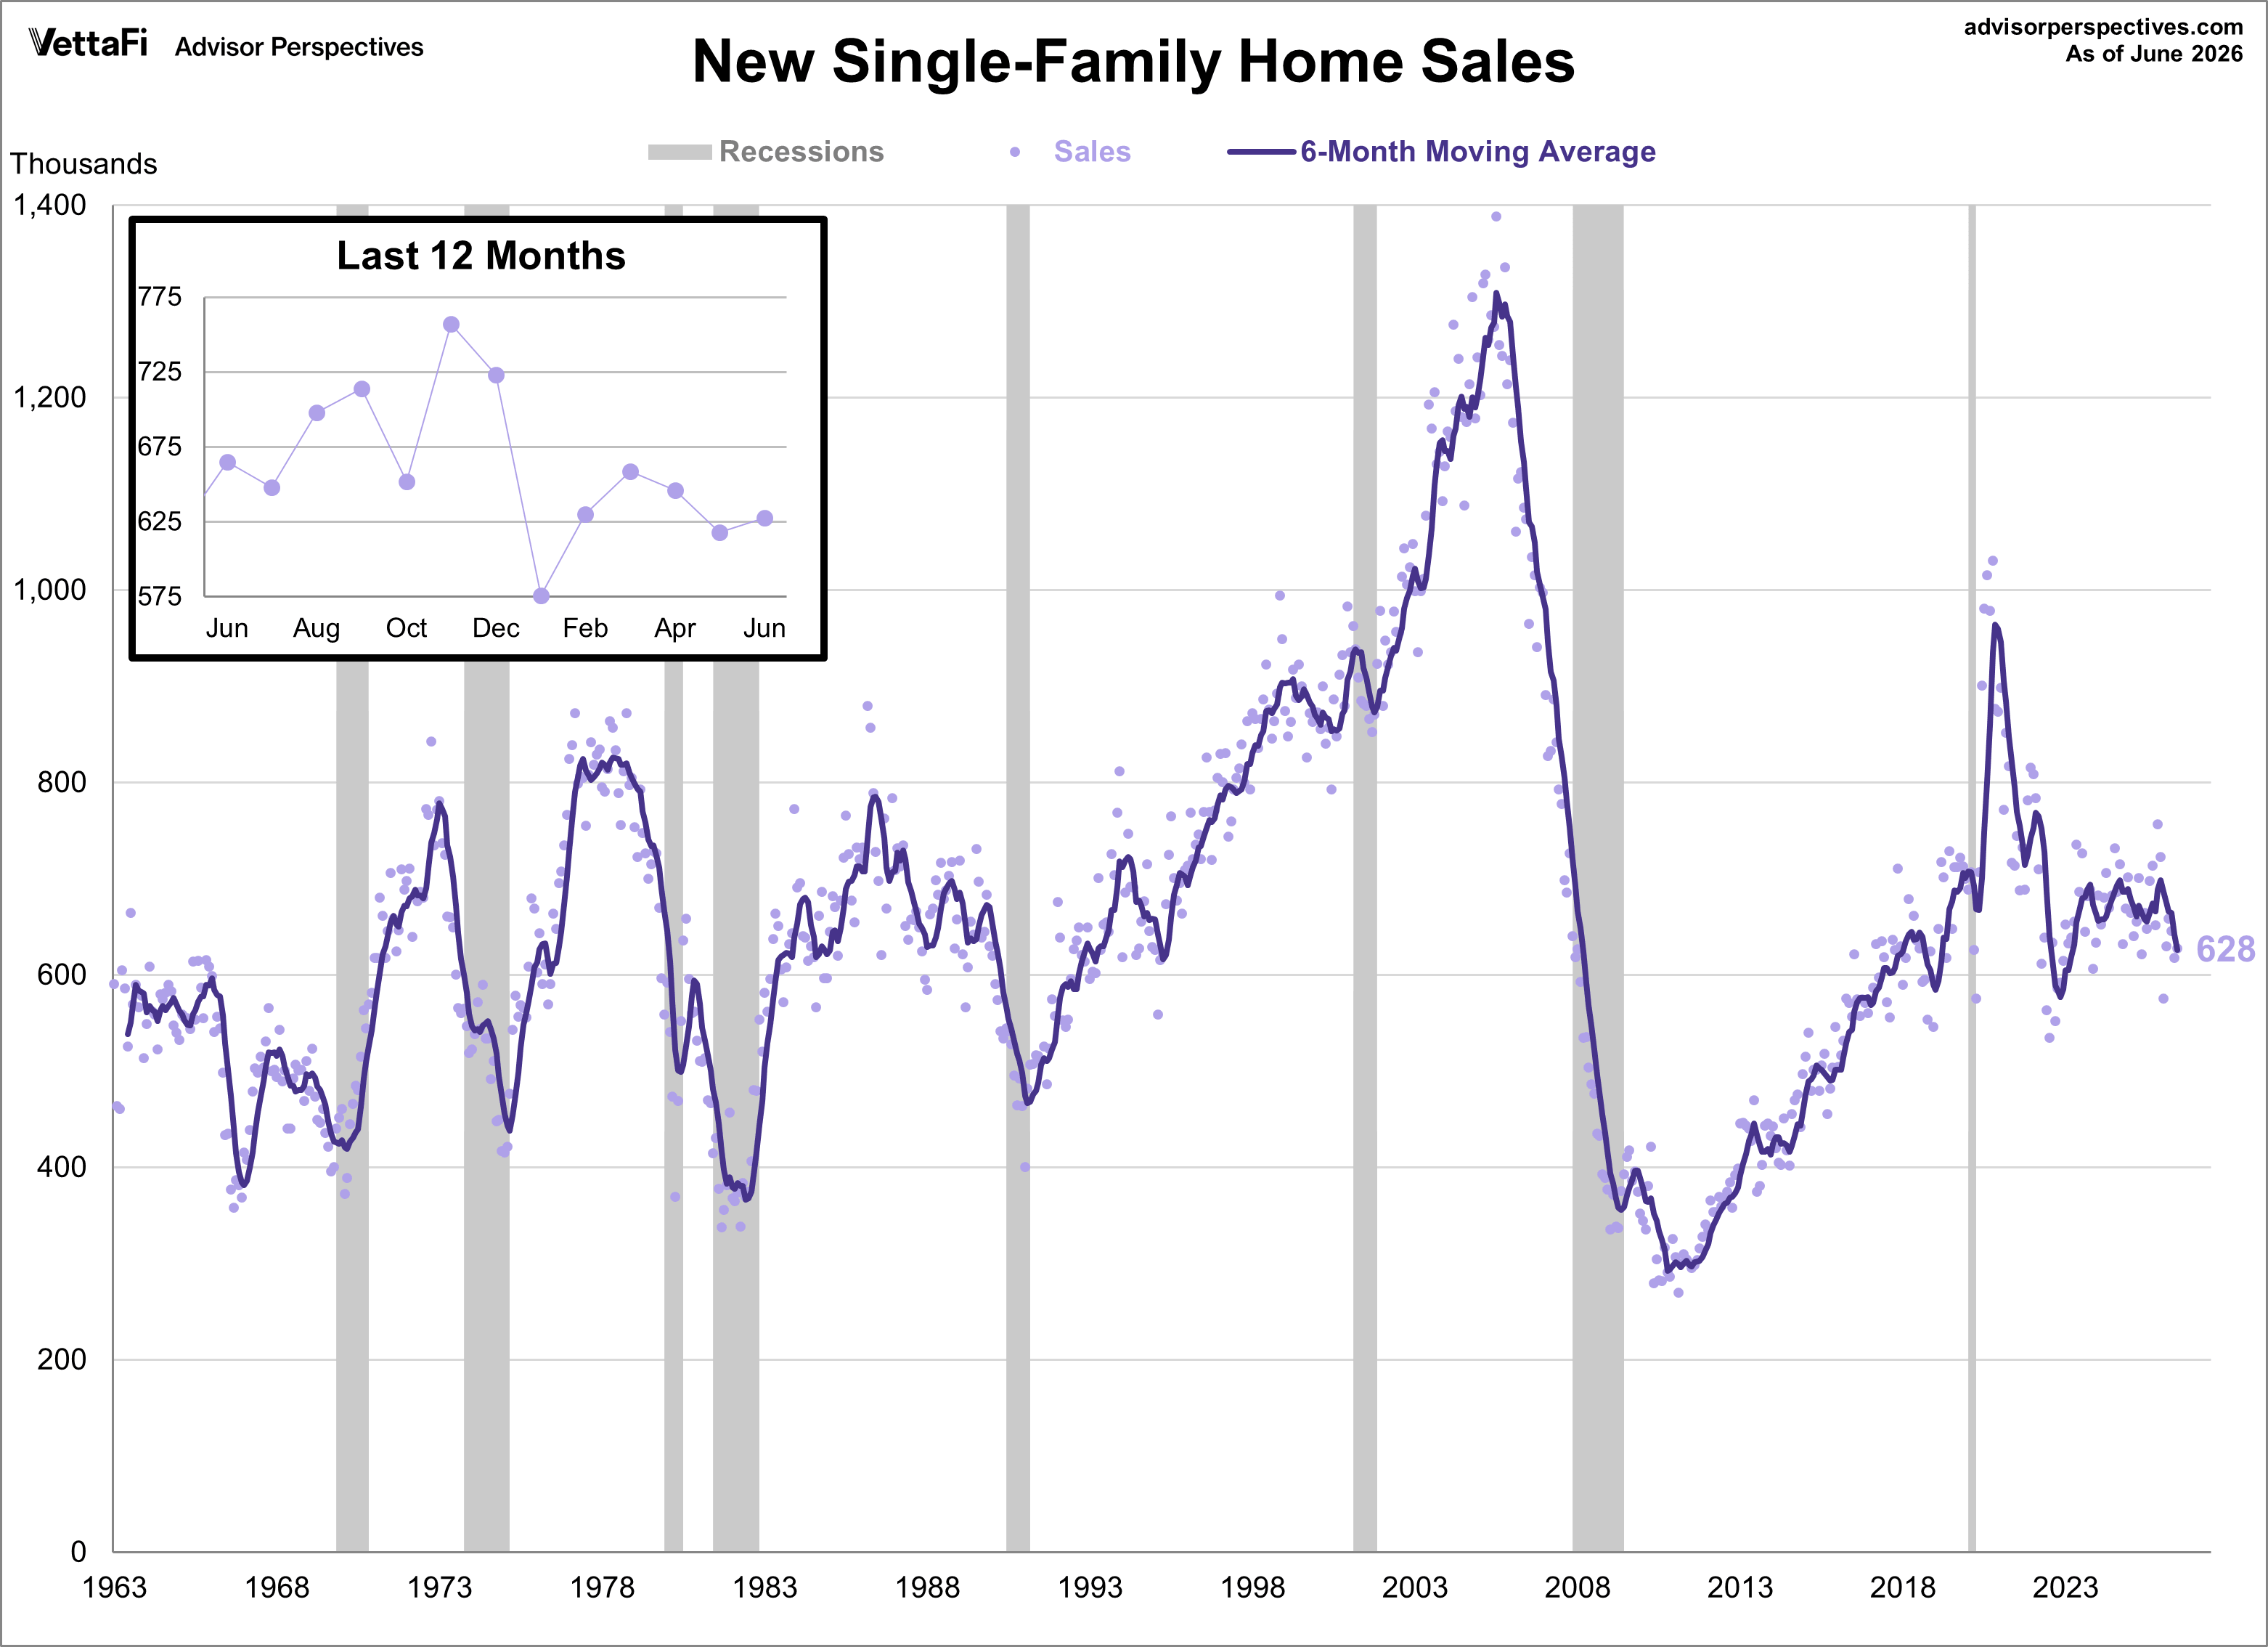
According to the Census Bureau, new home sales were at a seasonally adjusted annual rate of 628,000 in June. This represents a 1.6% increase from May's upwardly revised rate of 618,000 but a 5.6% drop from the previous year. The latest reading was higher than the forecast of 609,000.
Key Takeaways
- New home sales rose to a seasonally adjusted annual rate of 628,000 in June, beating forecasts.
-
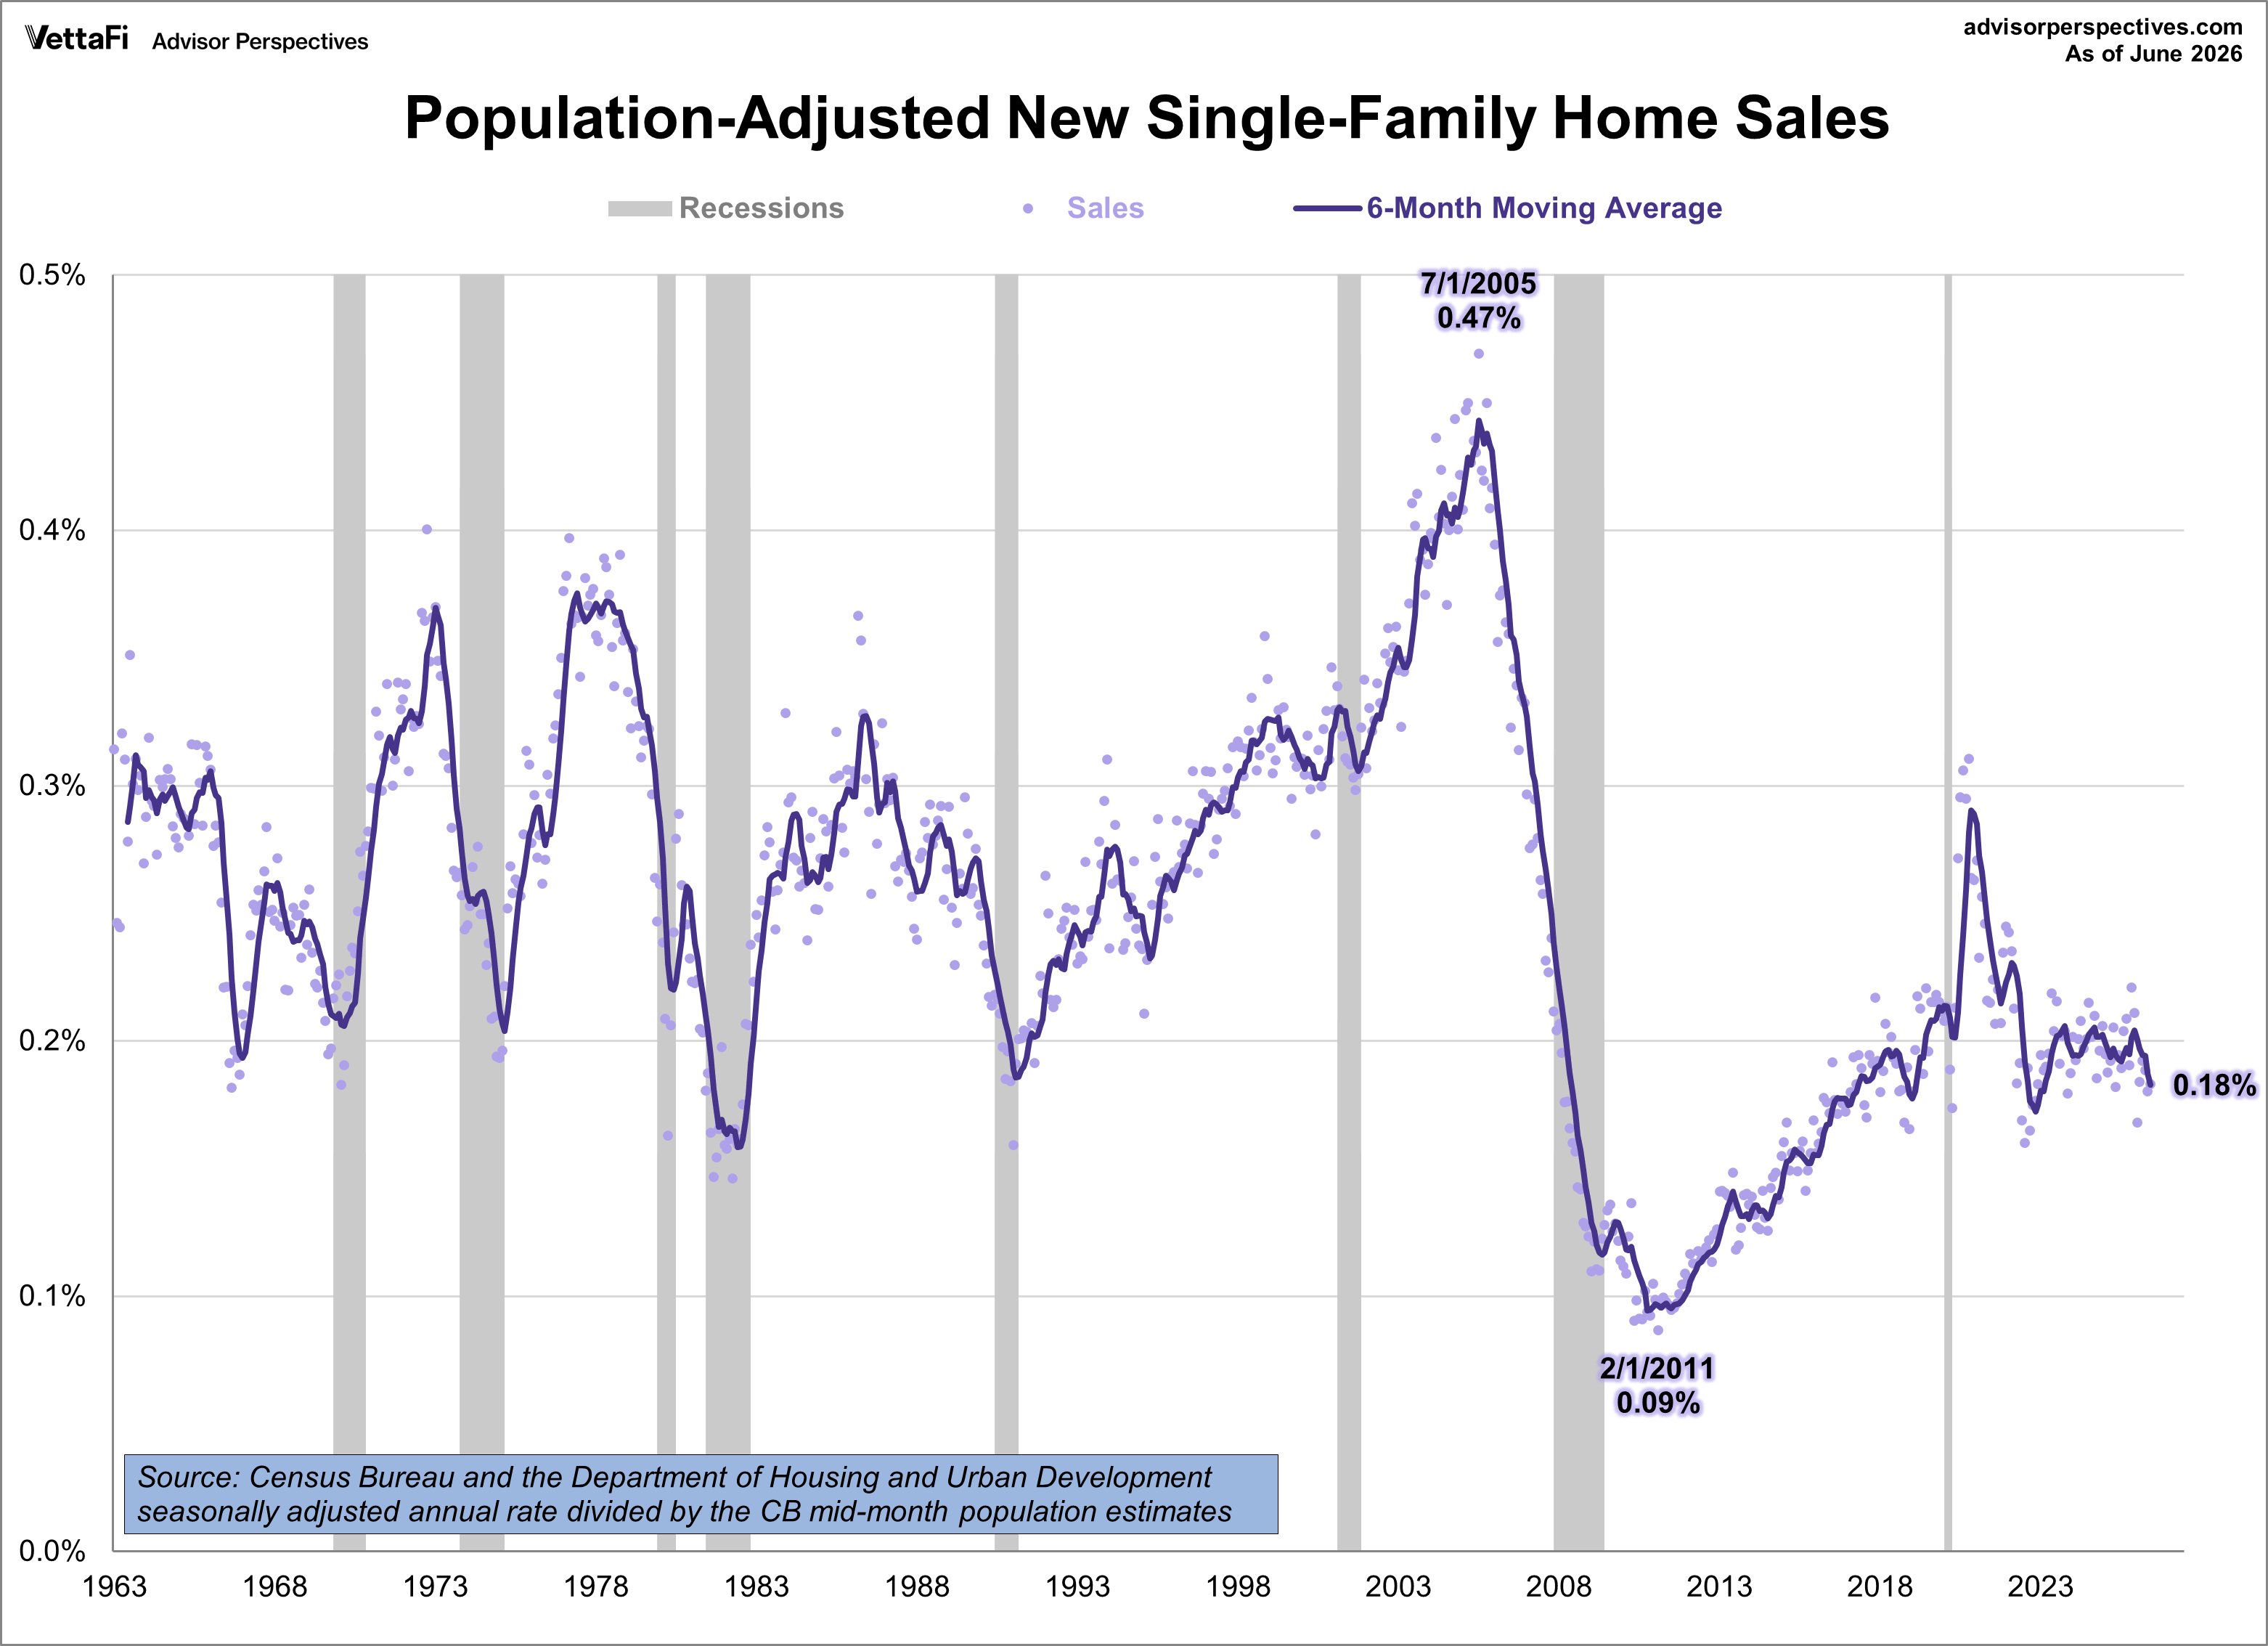
Population-adjusted new home sales are down 41.7% compared to the first data recorded in 1963.
-
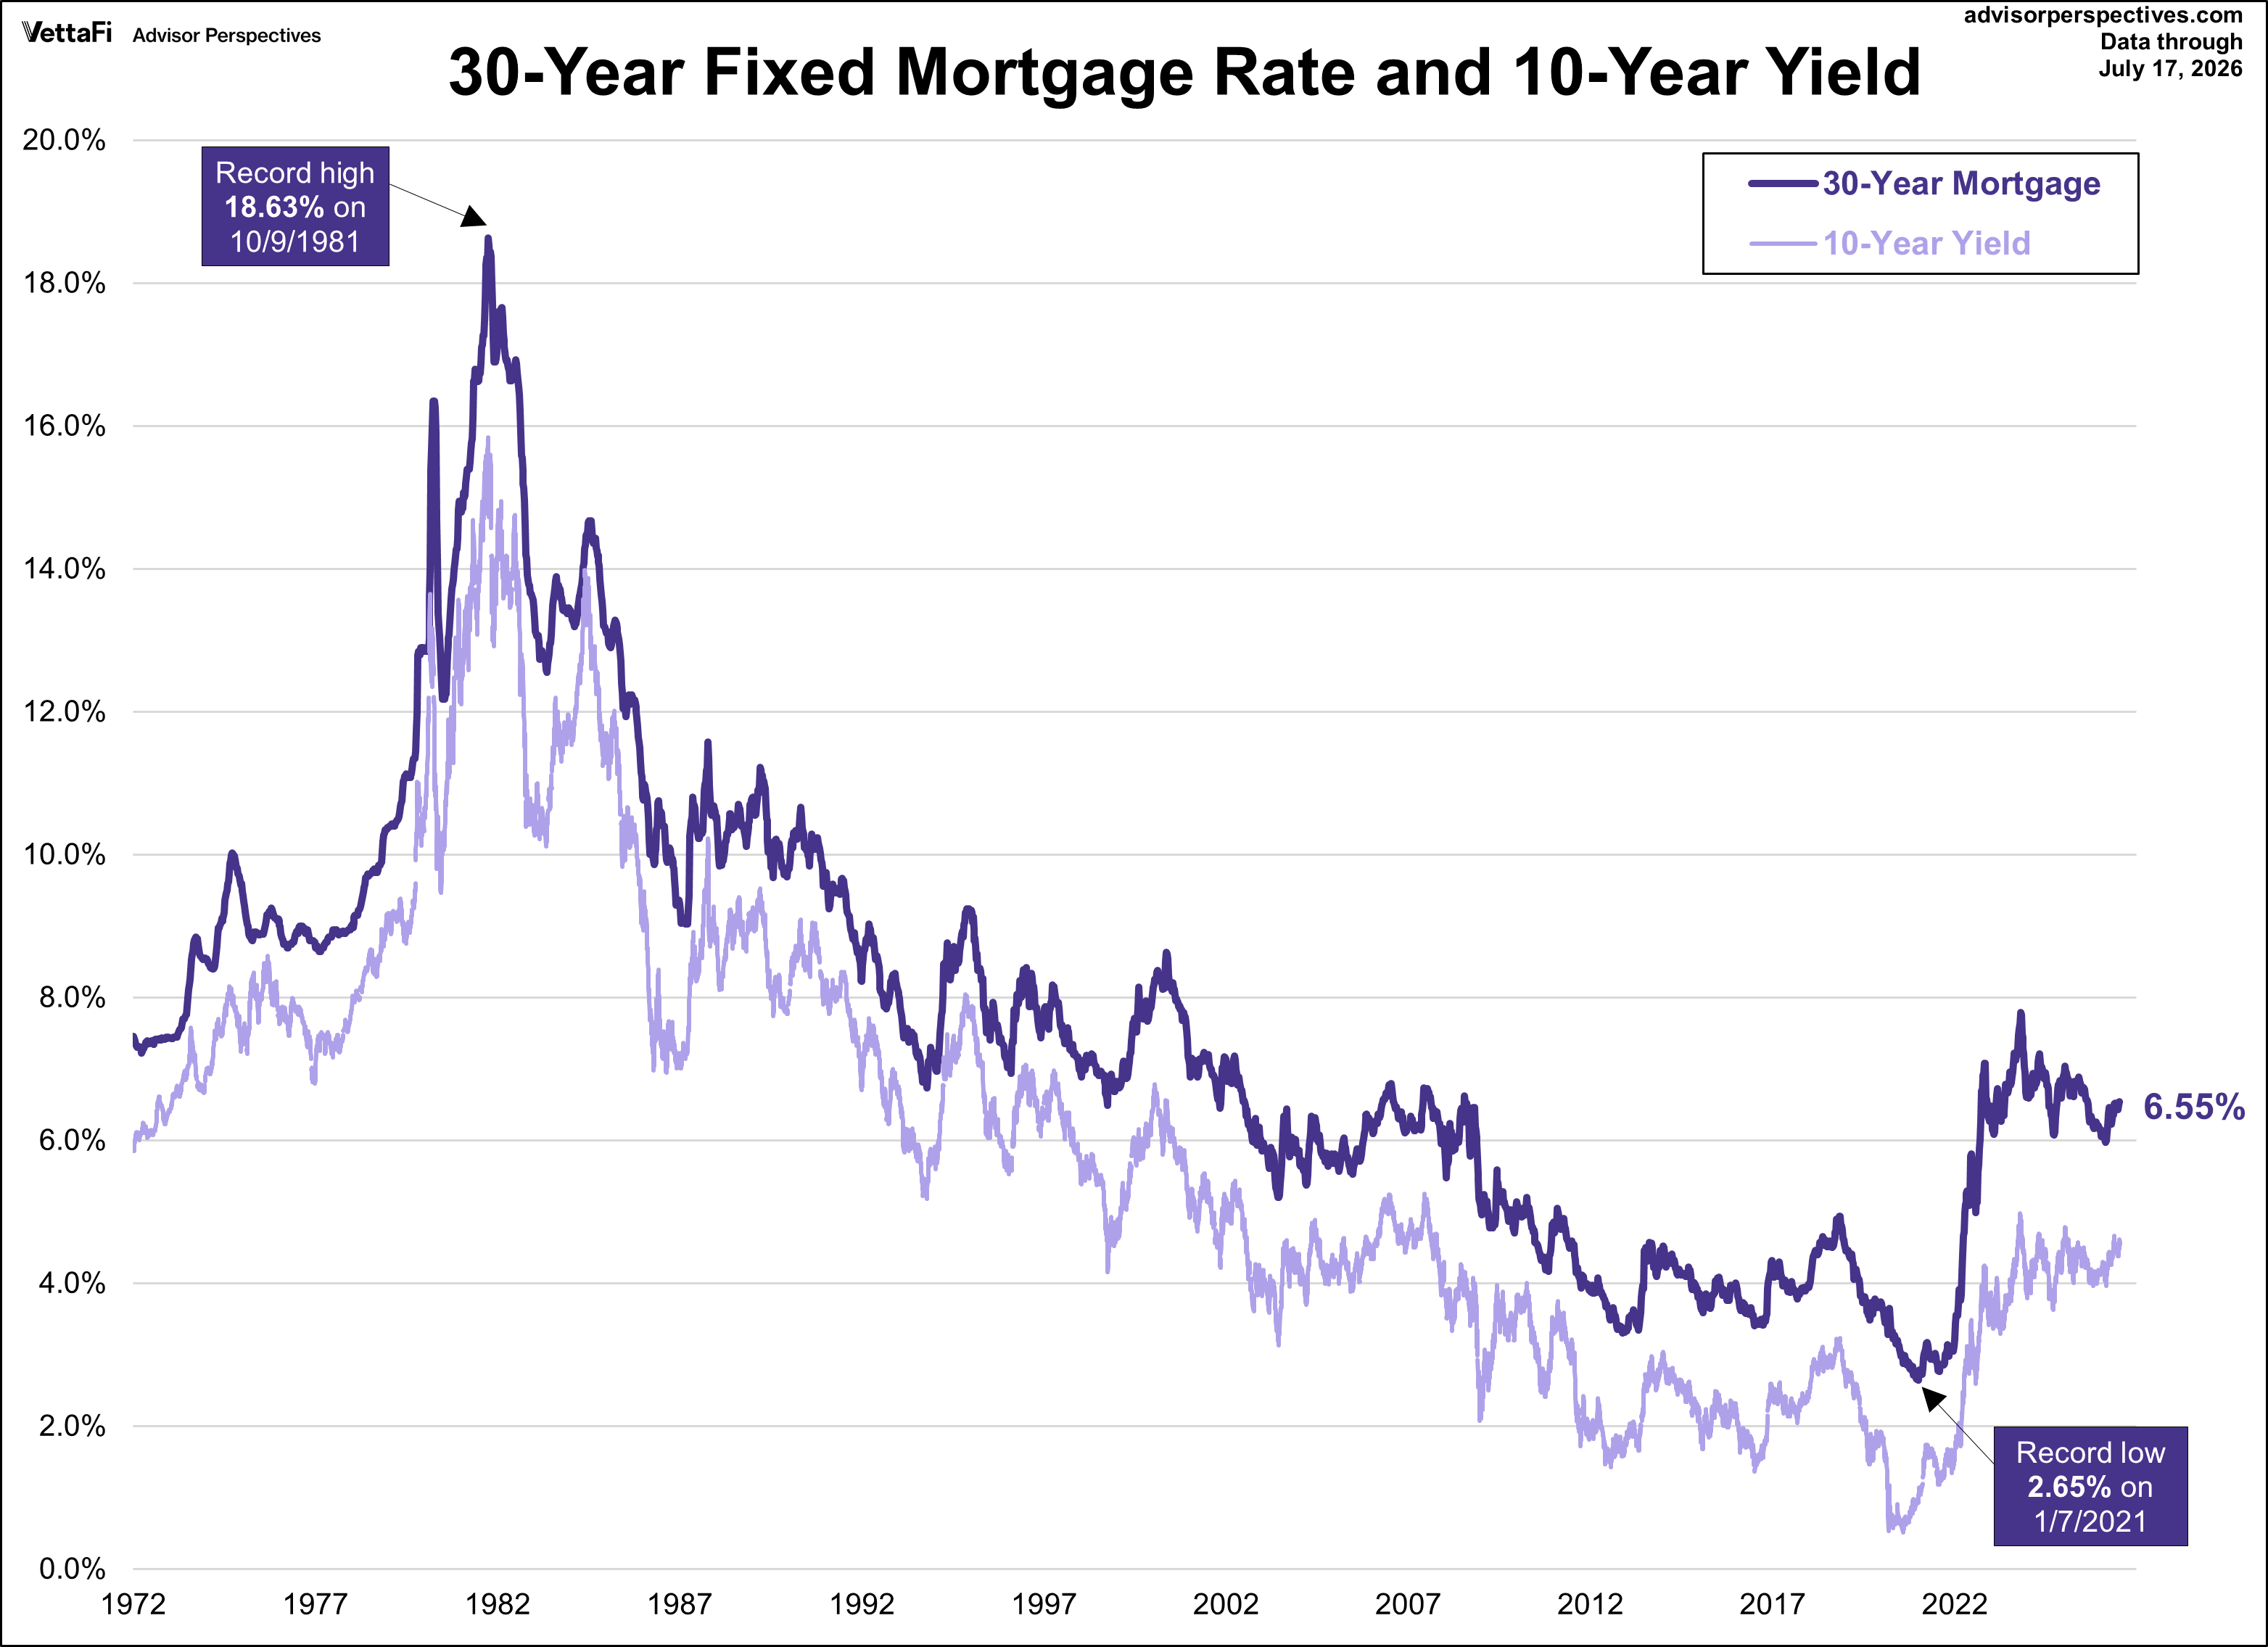
Mortgage rates for a 30-year fixed loan averaged 6.49% in June 2026 according to Freddie Mac.
For a long-term perspective, here is a snapshot of the series beginning in 1963. We've included a six-month moving average to highlight the trend in this highly volatile series.

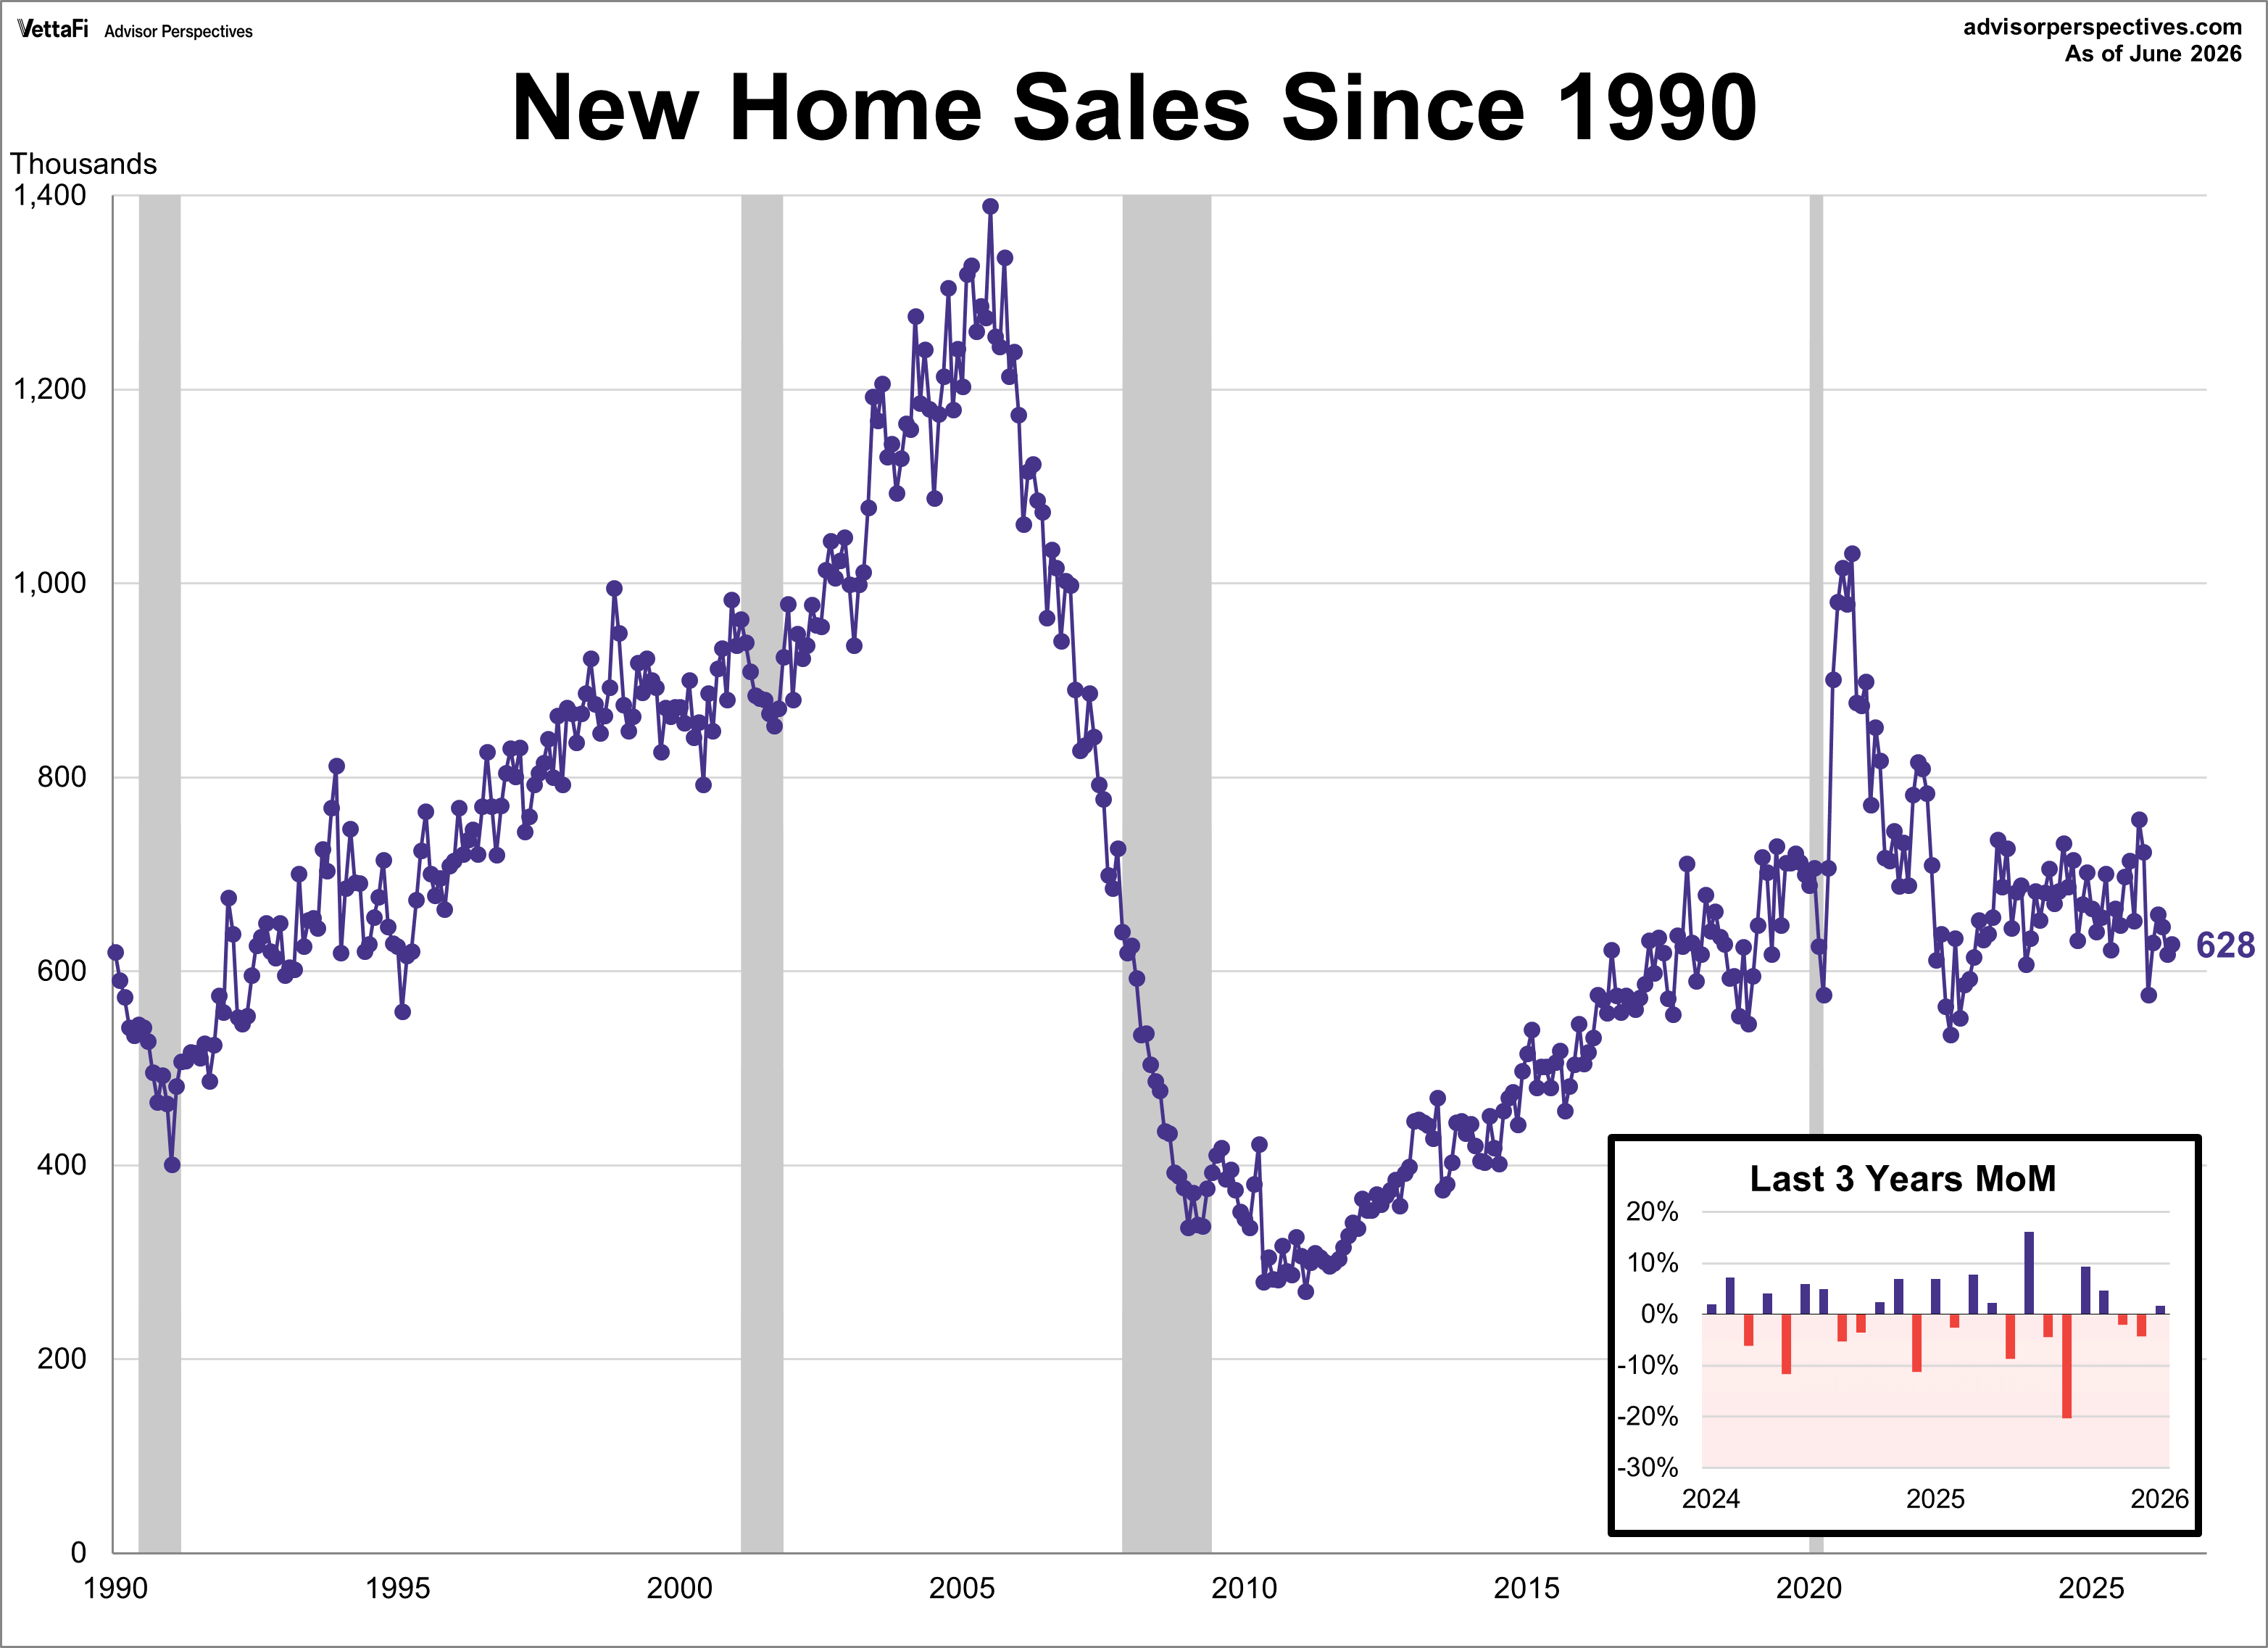
For a closer look, the next chart shows new home sales since 1990. Over this time frame, we see the steady rise in new home sales following the early-90s recession and the acceleration in sales during the real estate bubble that peaked in 2005. Starting in 2011, there was a similar rise in new home sales that peaked near the end of 2020 and retracted for about two years. New home sales showed consistent growth at the start of 2023 but have been stagnant since then.
New Home Sales: The Population-Adjusted Reality
Simply looking at raw new home sales figures can be misleading, as a growing population naturally suggests a higher number of sales. To gain a clearer picture of housing market strength relative to population growth, we need to normalize the data with a simple population adjustment. This adjustment—expressing new home sales as a percentage of the population—allows us to see the proportion of the population actively purchasing new homes, effectively accounting for the increase in potential buyers. This reveals whether housing demand is truly keeping pace with population growth.
The Census Bureau's mid-month population estimates show a 82.2% increase in the U.S. population since 1963. Here is a chart of new home sales as a percentage of the population.
This adjusted data reveals key trends. A rising percentage indicates a healthy market with increased demand relative to population, while a declining percentage suggests a weakening market and reduced demand. New home sales as a percentage of the population peaked at 0.47% in July 2005, showing strong demand, and bottomed at 0.09% in February 2011, reflecting a severe downturn.
New single-family home sales are 6.3% above the 1963 start of this data series while the population-adjusted version is down 41.7% from the first 1963 sales.
The 30-Year Fixed Rate Mortgage
According to Freddie Mac, the average 30-year fixed rate mortgage in June 2026 was 6.49%, the highest level since last August.
New Home Sales: Median Price
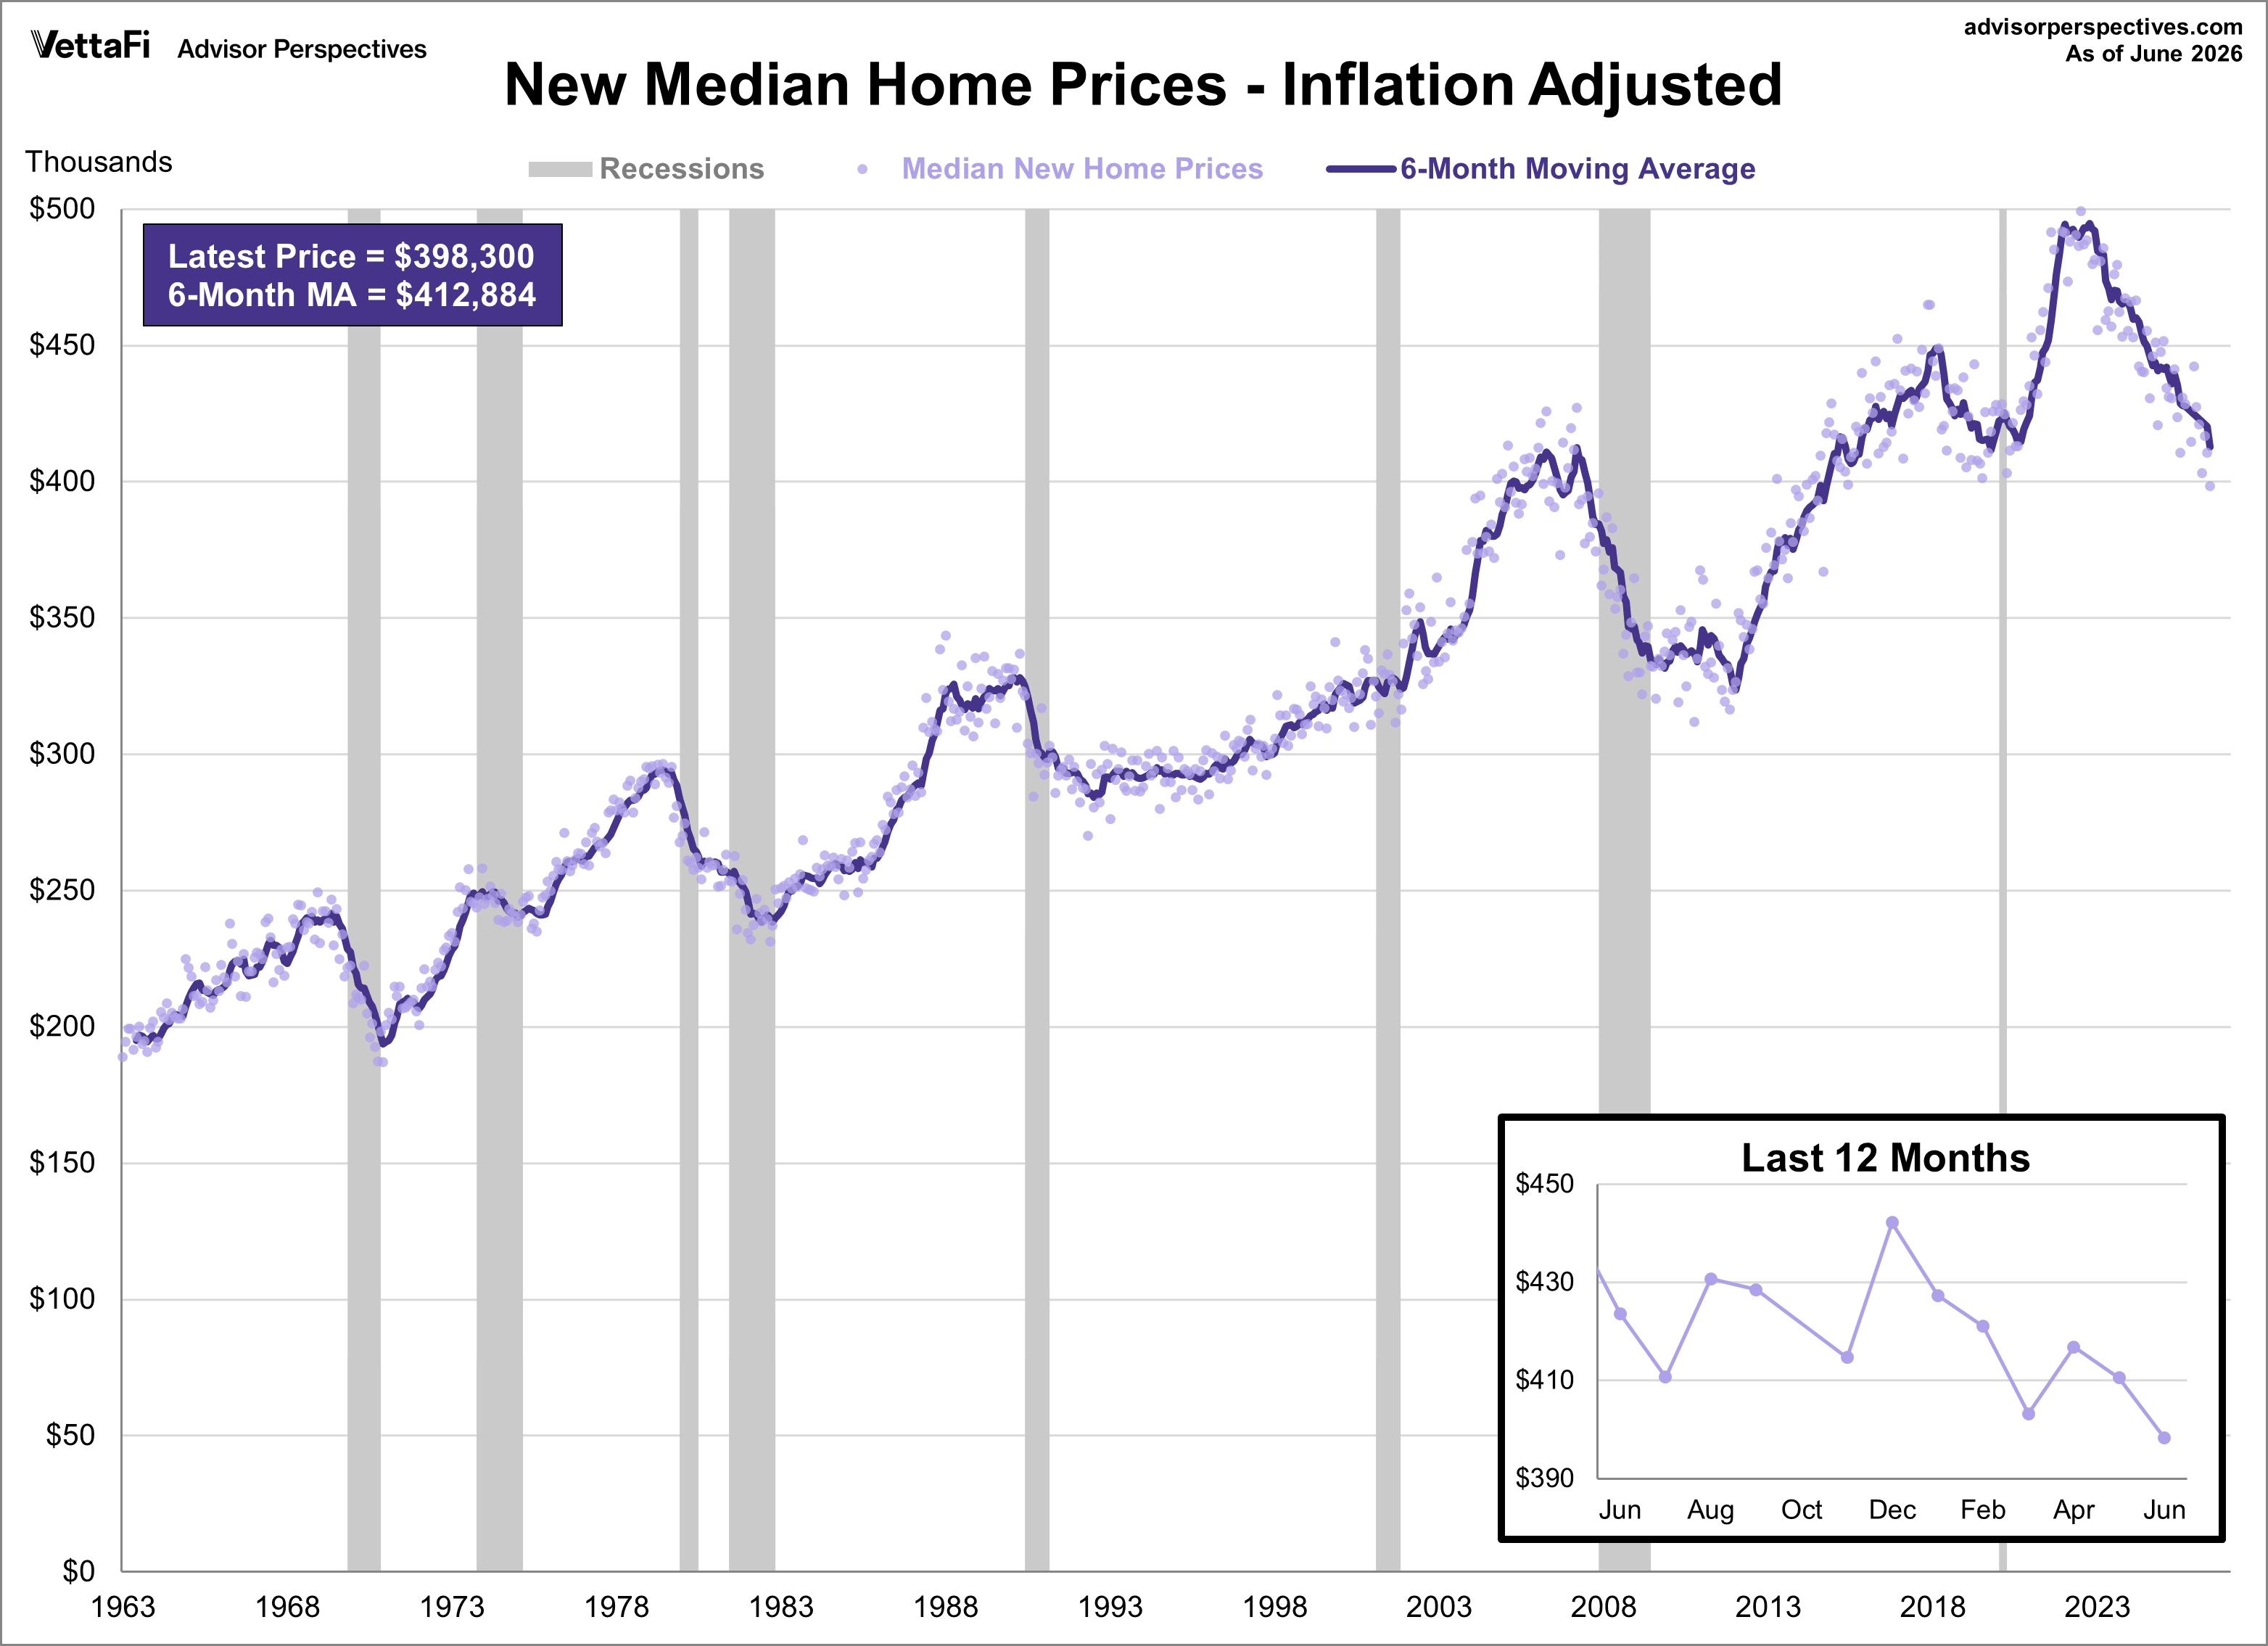
The median price for a new home fell for a second straight month to its lowest level in almost a year, coming in at $398,300. This represents a 3.3% decline from the previous month and a 2.7% drop from one year ago.
However, after adjusting for inflation, the real median price for a new home is at its lowest level since 2014. Additionally, the real price shows a monthly change of -3.0% and an annual change of -6.0%.
This next chart shows the inflation-adjusted median sales price of new homes since 1963, using the consumer price index for all urban consumers (CPI-U) for the inflation adjustment. We've included a six-month moving average to give us a clearer sense of the trend.
ETFs associated with residential real-estate include: iShares Residential and Multisector Real Estate ETF (REZ).
ETFs associated with home builders include: Invesco Dynamic Building & Construction ETF (PKB), iShares U.S. Home Construction ETF (ITB) and SPDR S&P Homebuilders ETF (XHB).
For additional perspectives on residential real estate, here is the complete list of our monthly updates:
Read more updates by Jen Nash