Travel on all roads and streets decreased in May. The 12-month moving average was down 0.06% month-over-month but was up 0.93% year-over-year. However, if we factor in population growth, the 12-month MA of the civilian population-adjusted data (age 16-and-over) was down 0.10% month-over-month and up 0.32% year-over-year.
Here's a detailed map of regional driving:
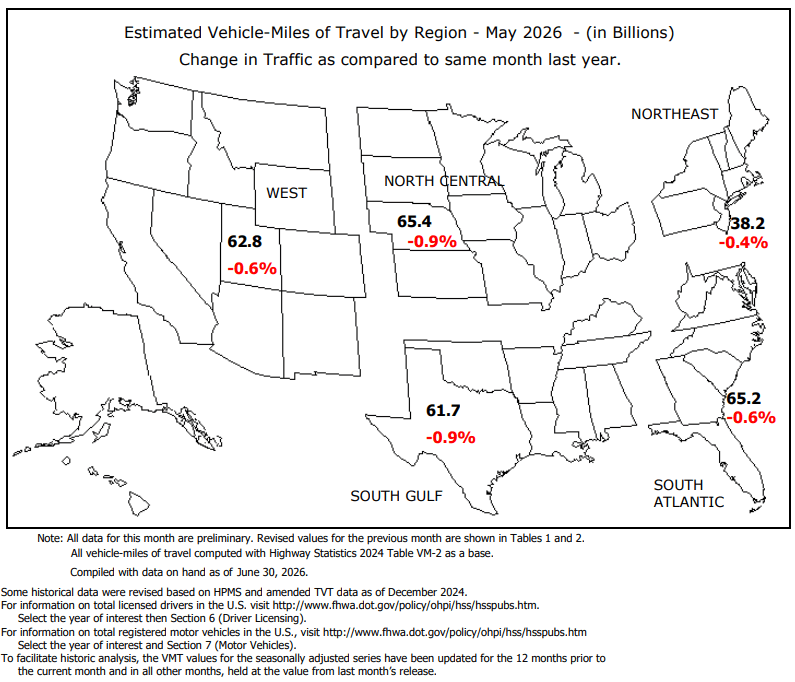
Source: Traffic Volume Trends May 2026
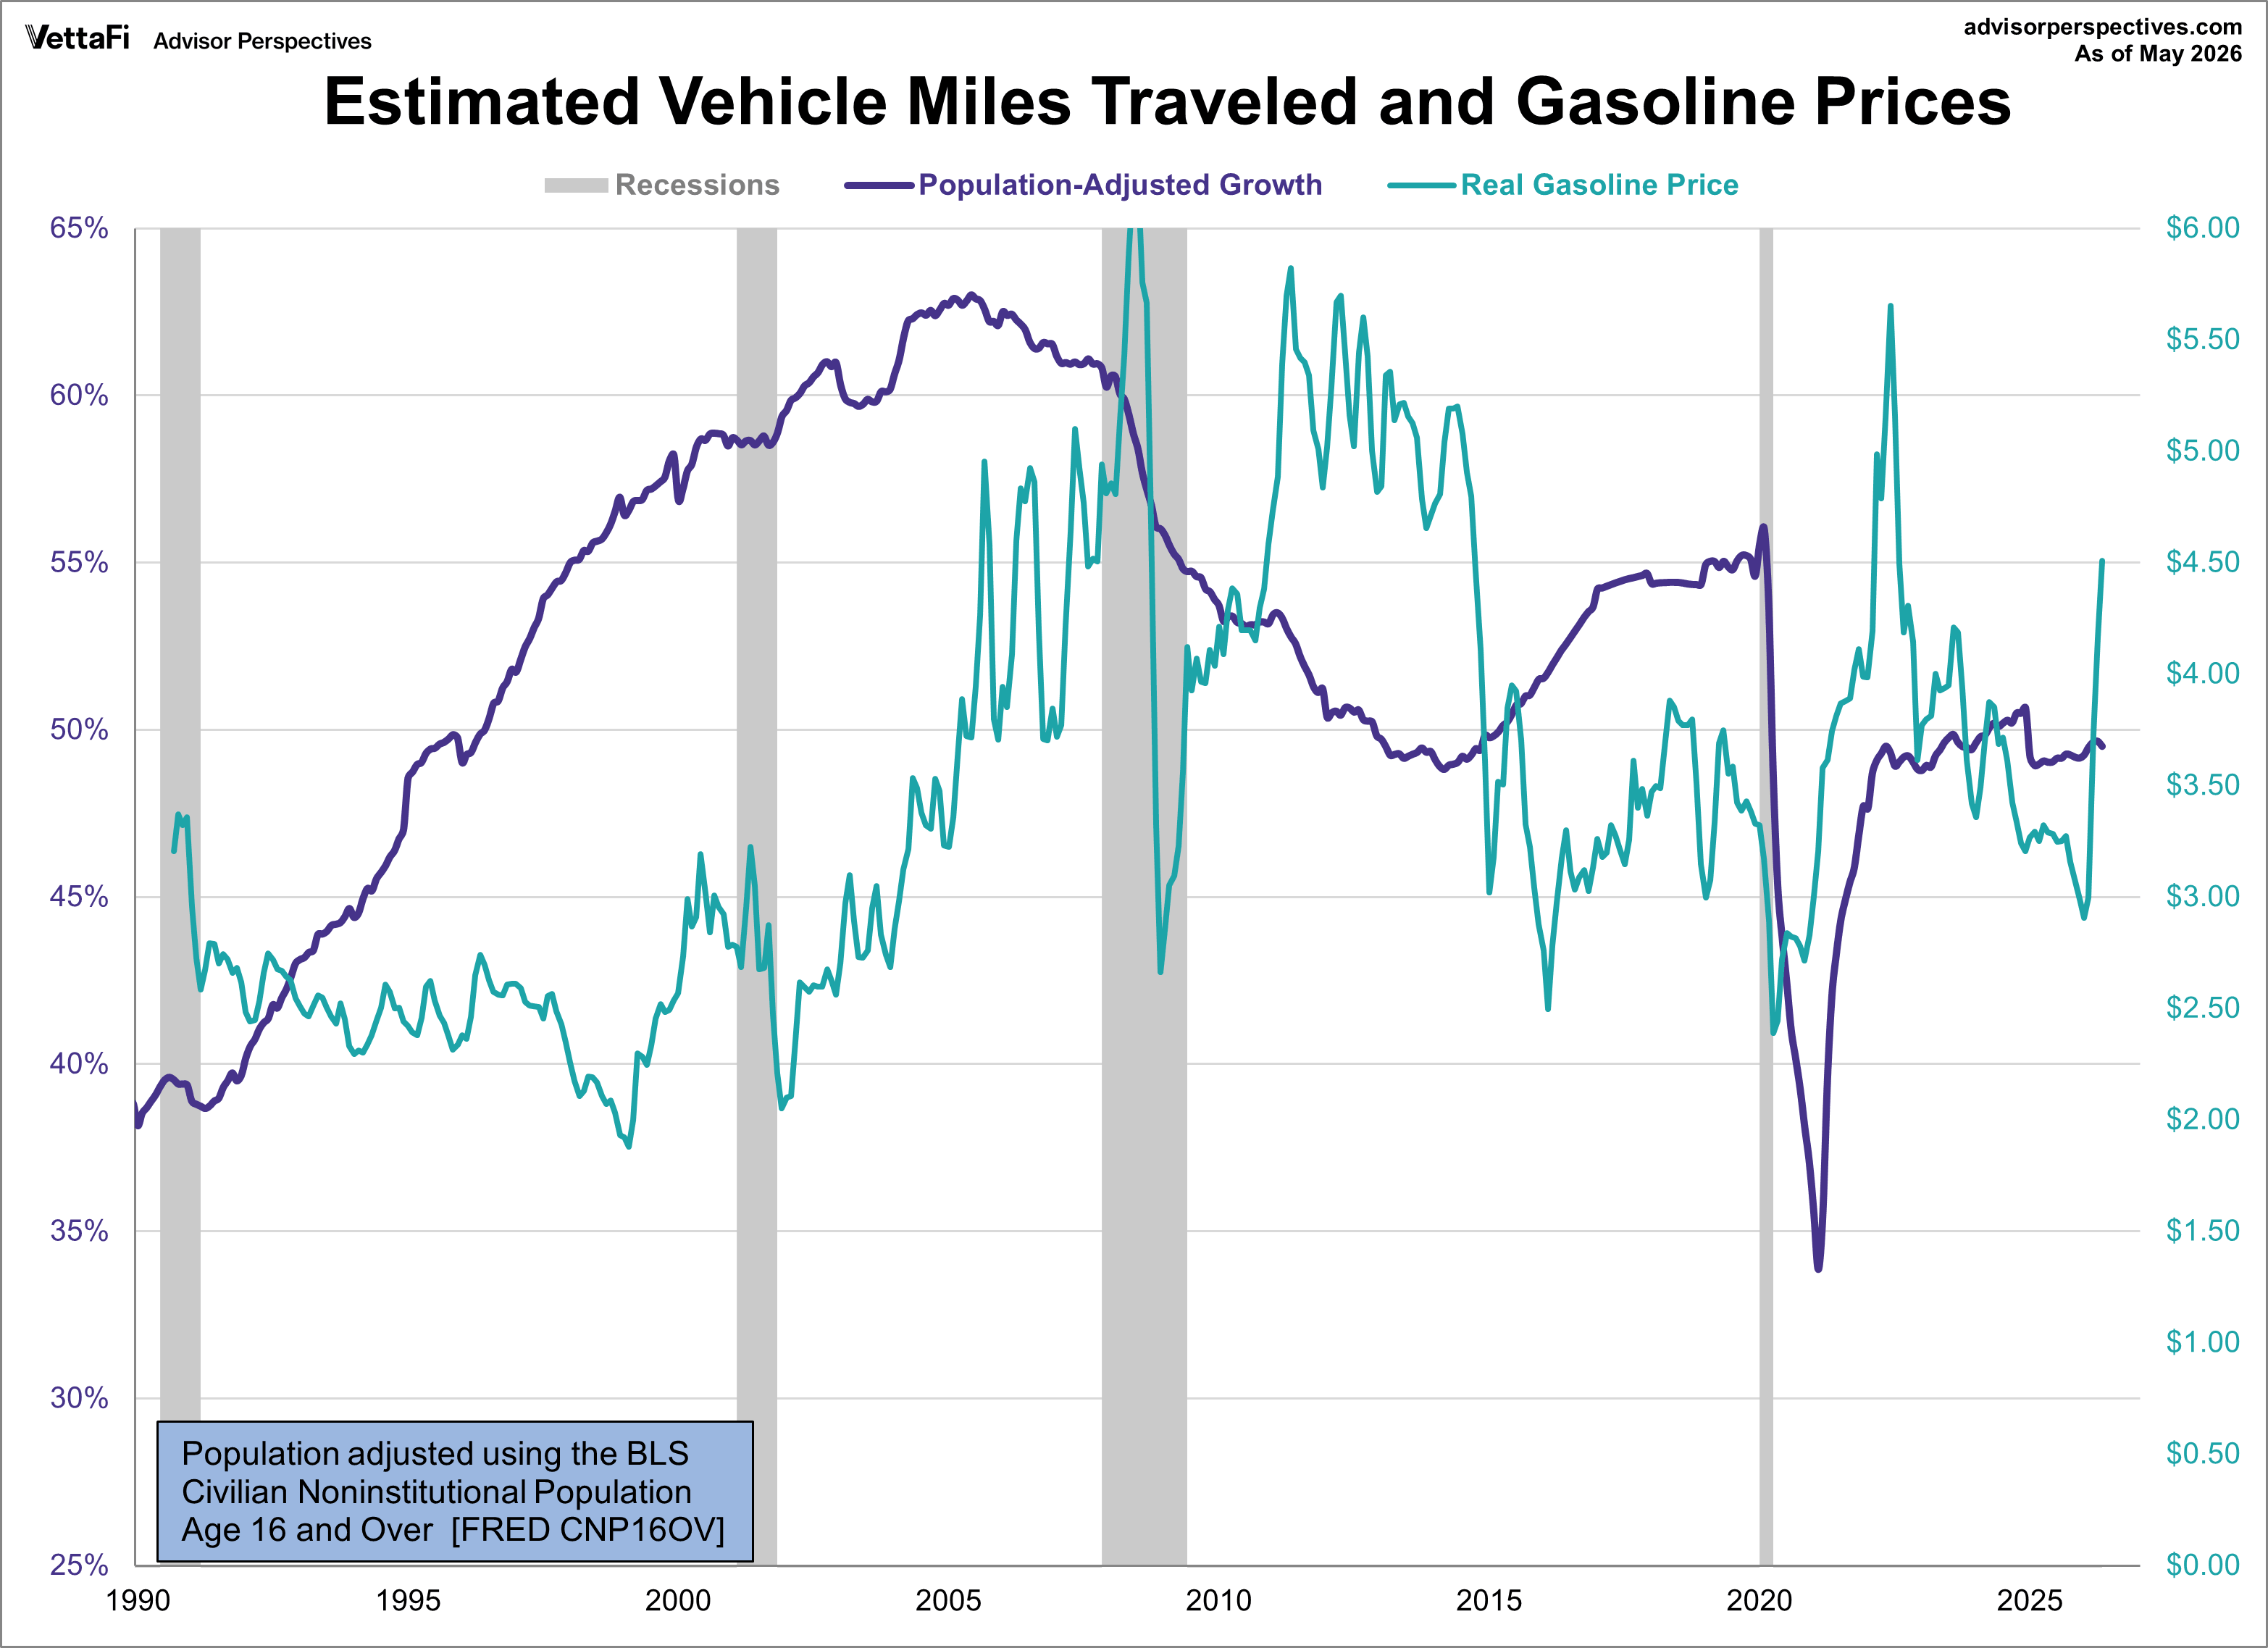
Here is a chart that illustrates this data series from its inception in 1971. It illustrates the "Moving 12-Month Total on ALL Roads," as the DOT terms it. As we can readily see, the great recession had a substantial impact on our driving habits, but habits bounced back over the next five or so years, until the COVID pandemic. The decline in driving was most likely related to the cost of gasoline during that time period (see fourth chart below).
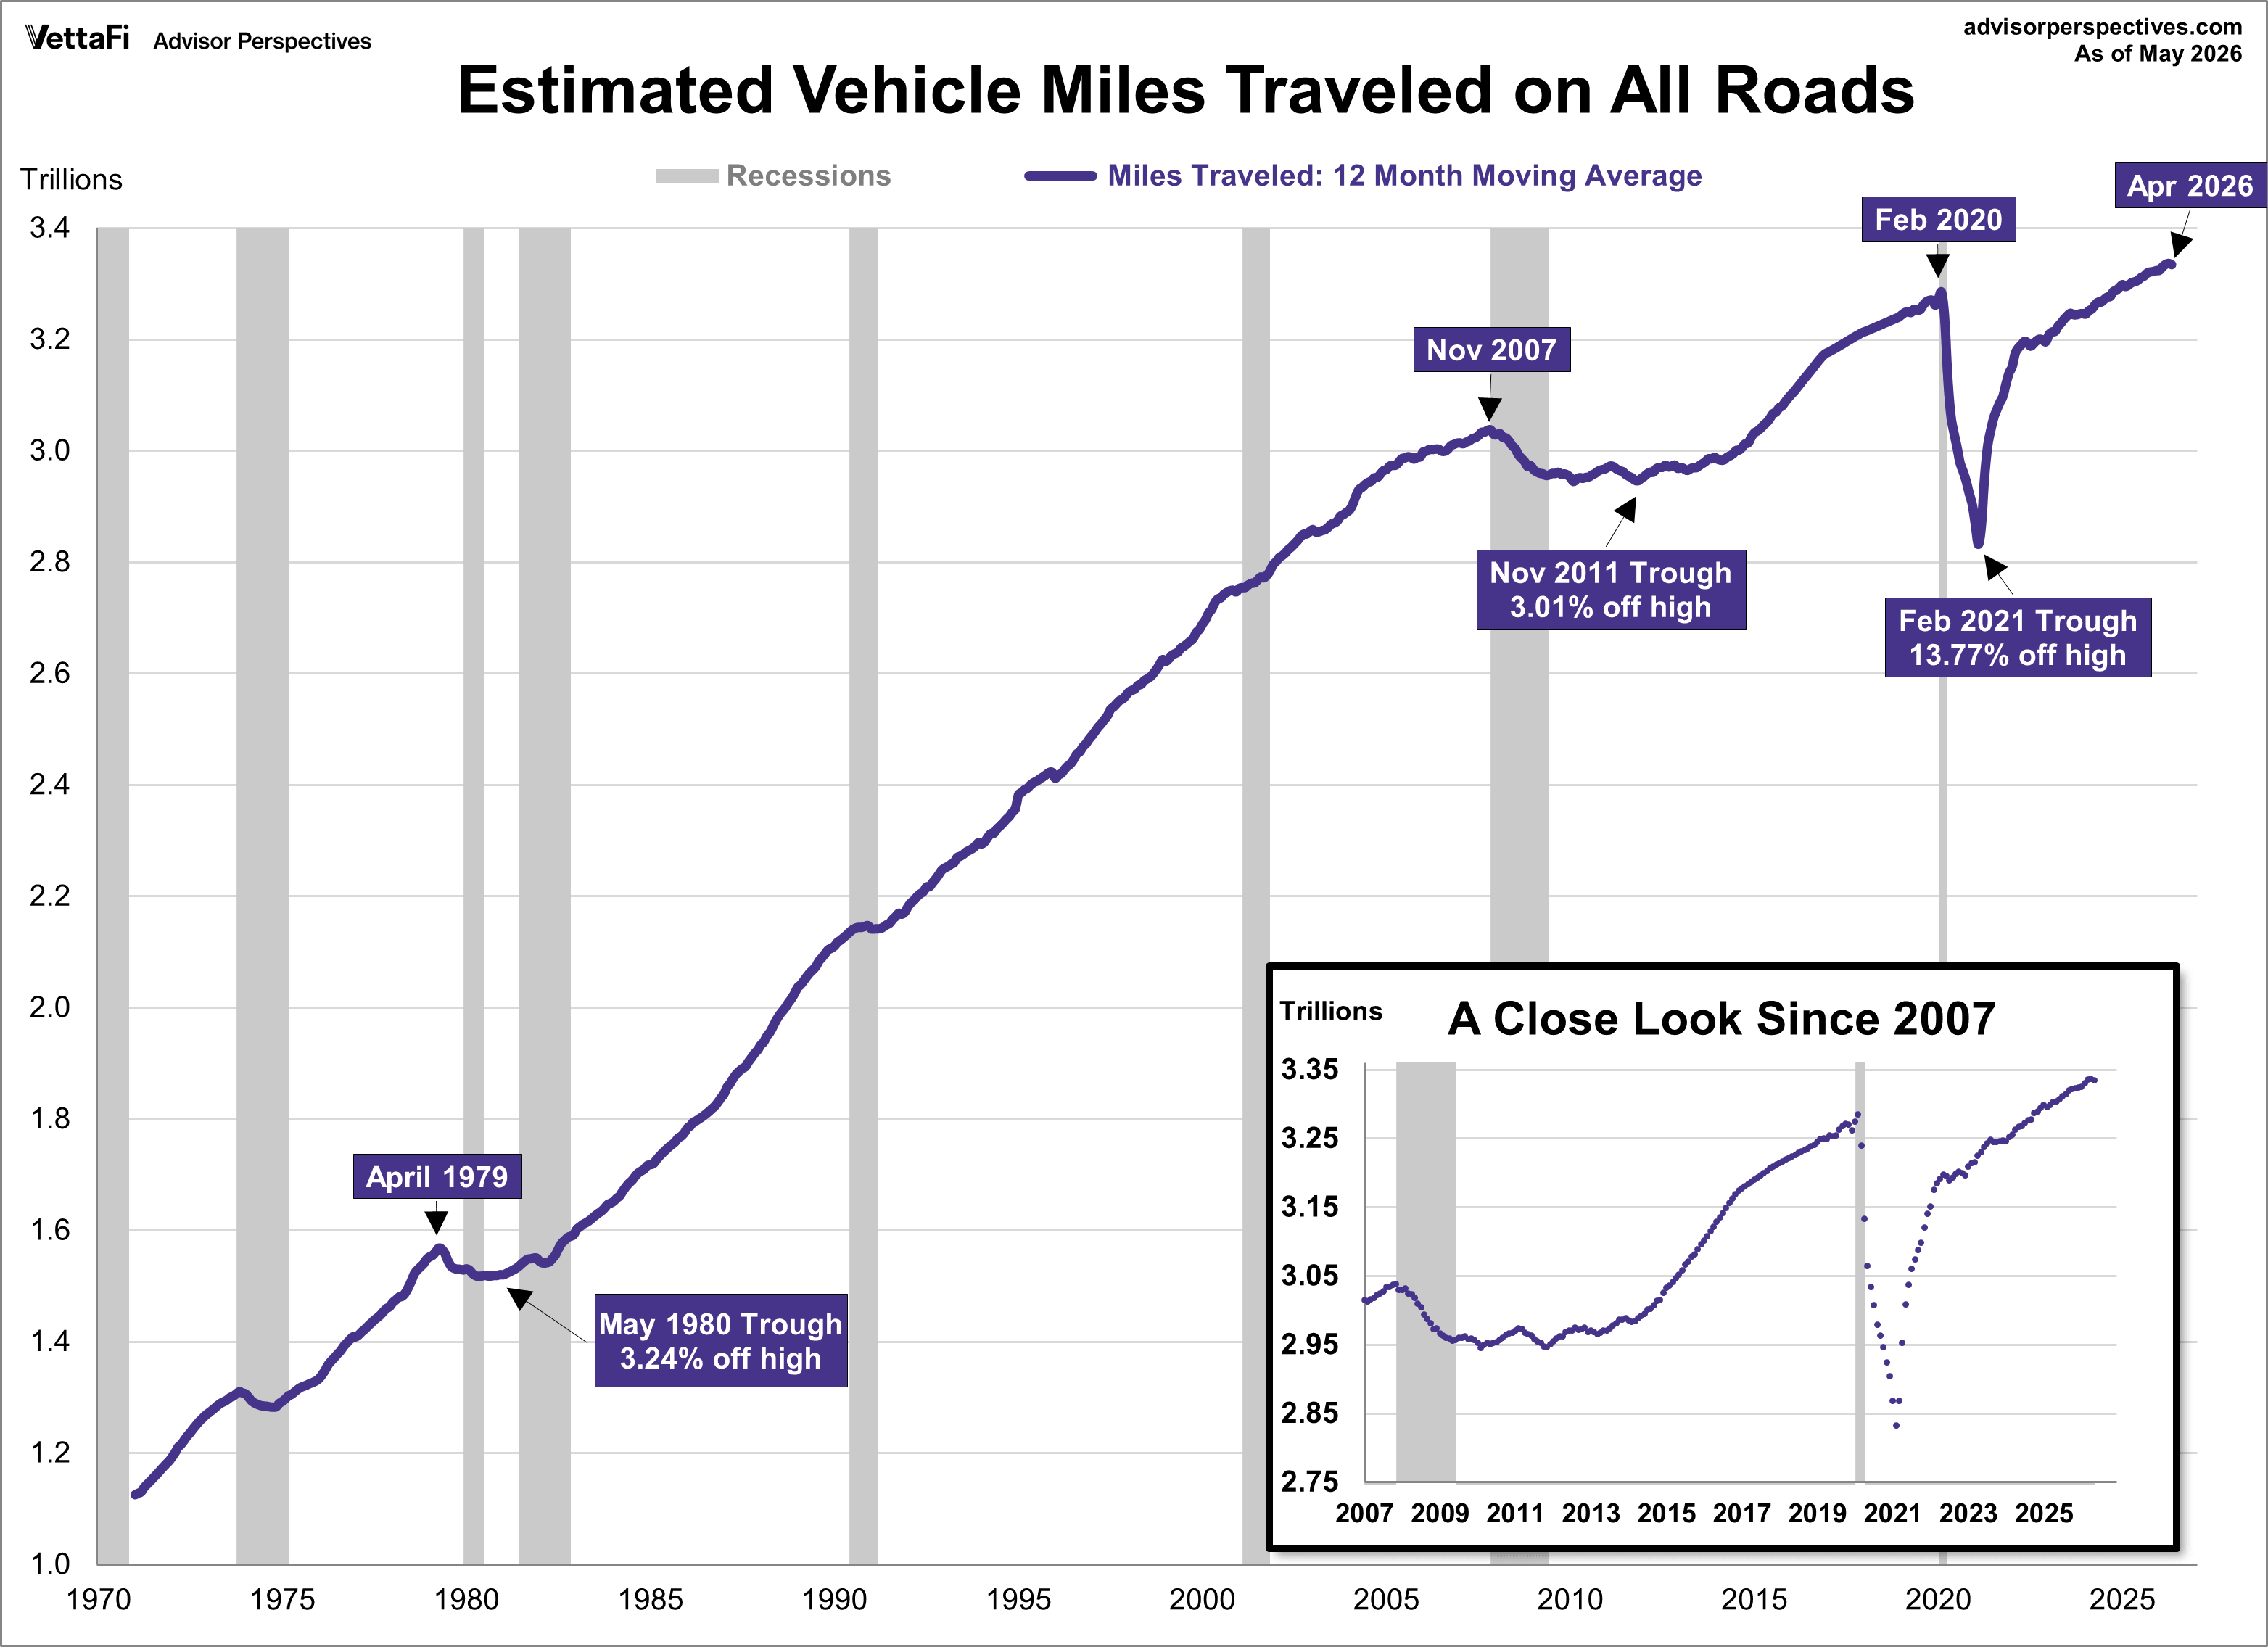
The rolling 12-month miles traveled peaked in April 1979 but then contracted for 39 months during the stagflation period of the late 1970s to early 1980s, a time marked by a double-dip recession. Thirteen months after the peak, the trend fell as low as 3.24%. Similarly, the 12-month moving average reached another peak in November 2007, just before the Great Recession, and then contracted for 87 months. During this period, the trend declined by 3.01% from its November 2007 peak.
However, the COVID-19 pandemic had the most significant impact on driving, as Americans stayed home for work, meals, and entertainment. The 12-month moving average peaked in February 2020 but then experienced the largest and steepest decline in history, falling 13.77% from its high. This trend continued contracting for 55 months until October 2024. In April 2026, the 12-month moving average reached a new all-time high and is currently 0.06% away from that high.
Vehicle Miles Traveled: The Population-Adjusted Reality
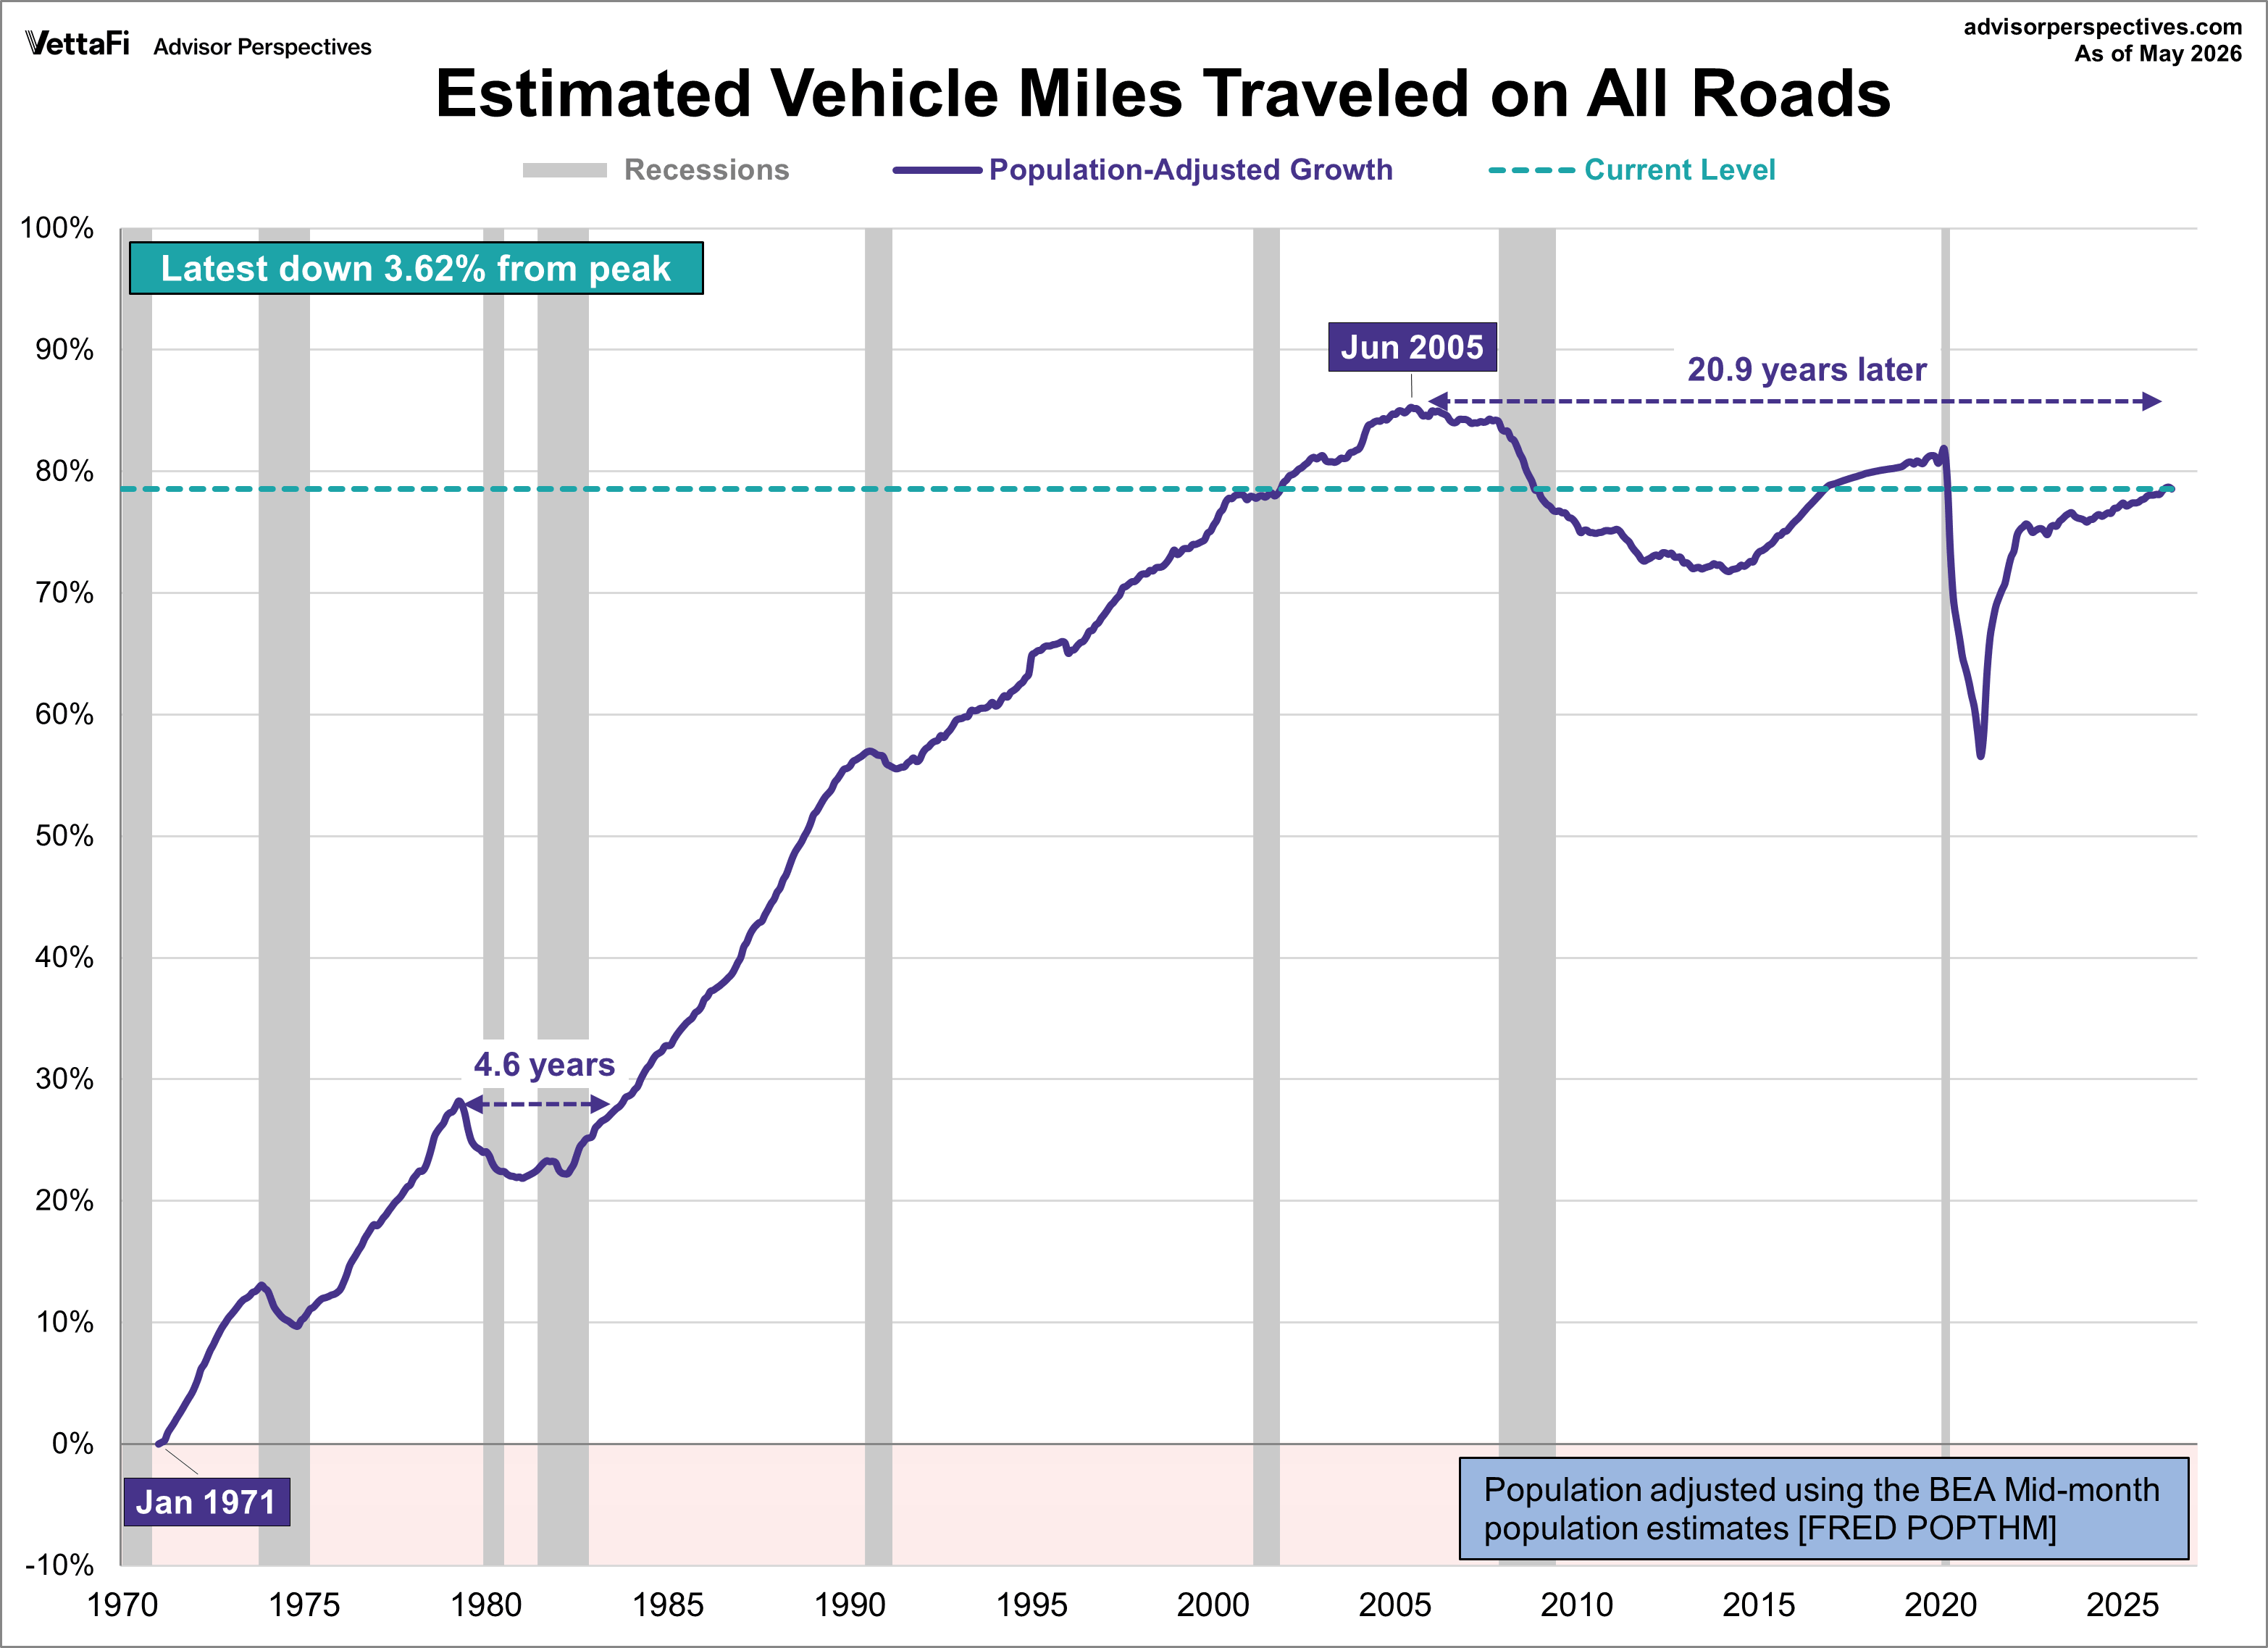
Total miles traveled, however, is one of those metrics that should be adjusted for population growth to provide the most meaningful analysis, especially if we want to understand the historical context. We can do a quick adjustment of the data using an appropriate population group as the deflator. Let's use the Bureau of Labor Statistics' Civilian Noninstitutional Population Age 16 and Over (FRED series CNP16OV). The next chart incorporates that adjustment with the growth shown on the vertical axis as the percent change from 1971.
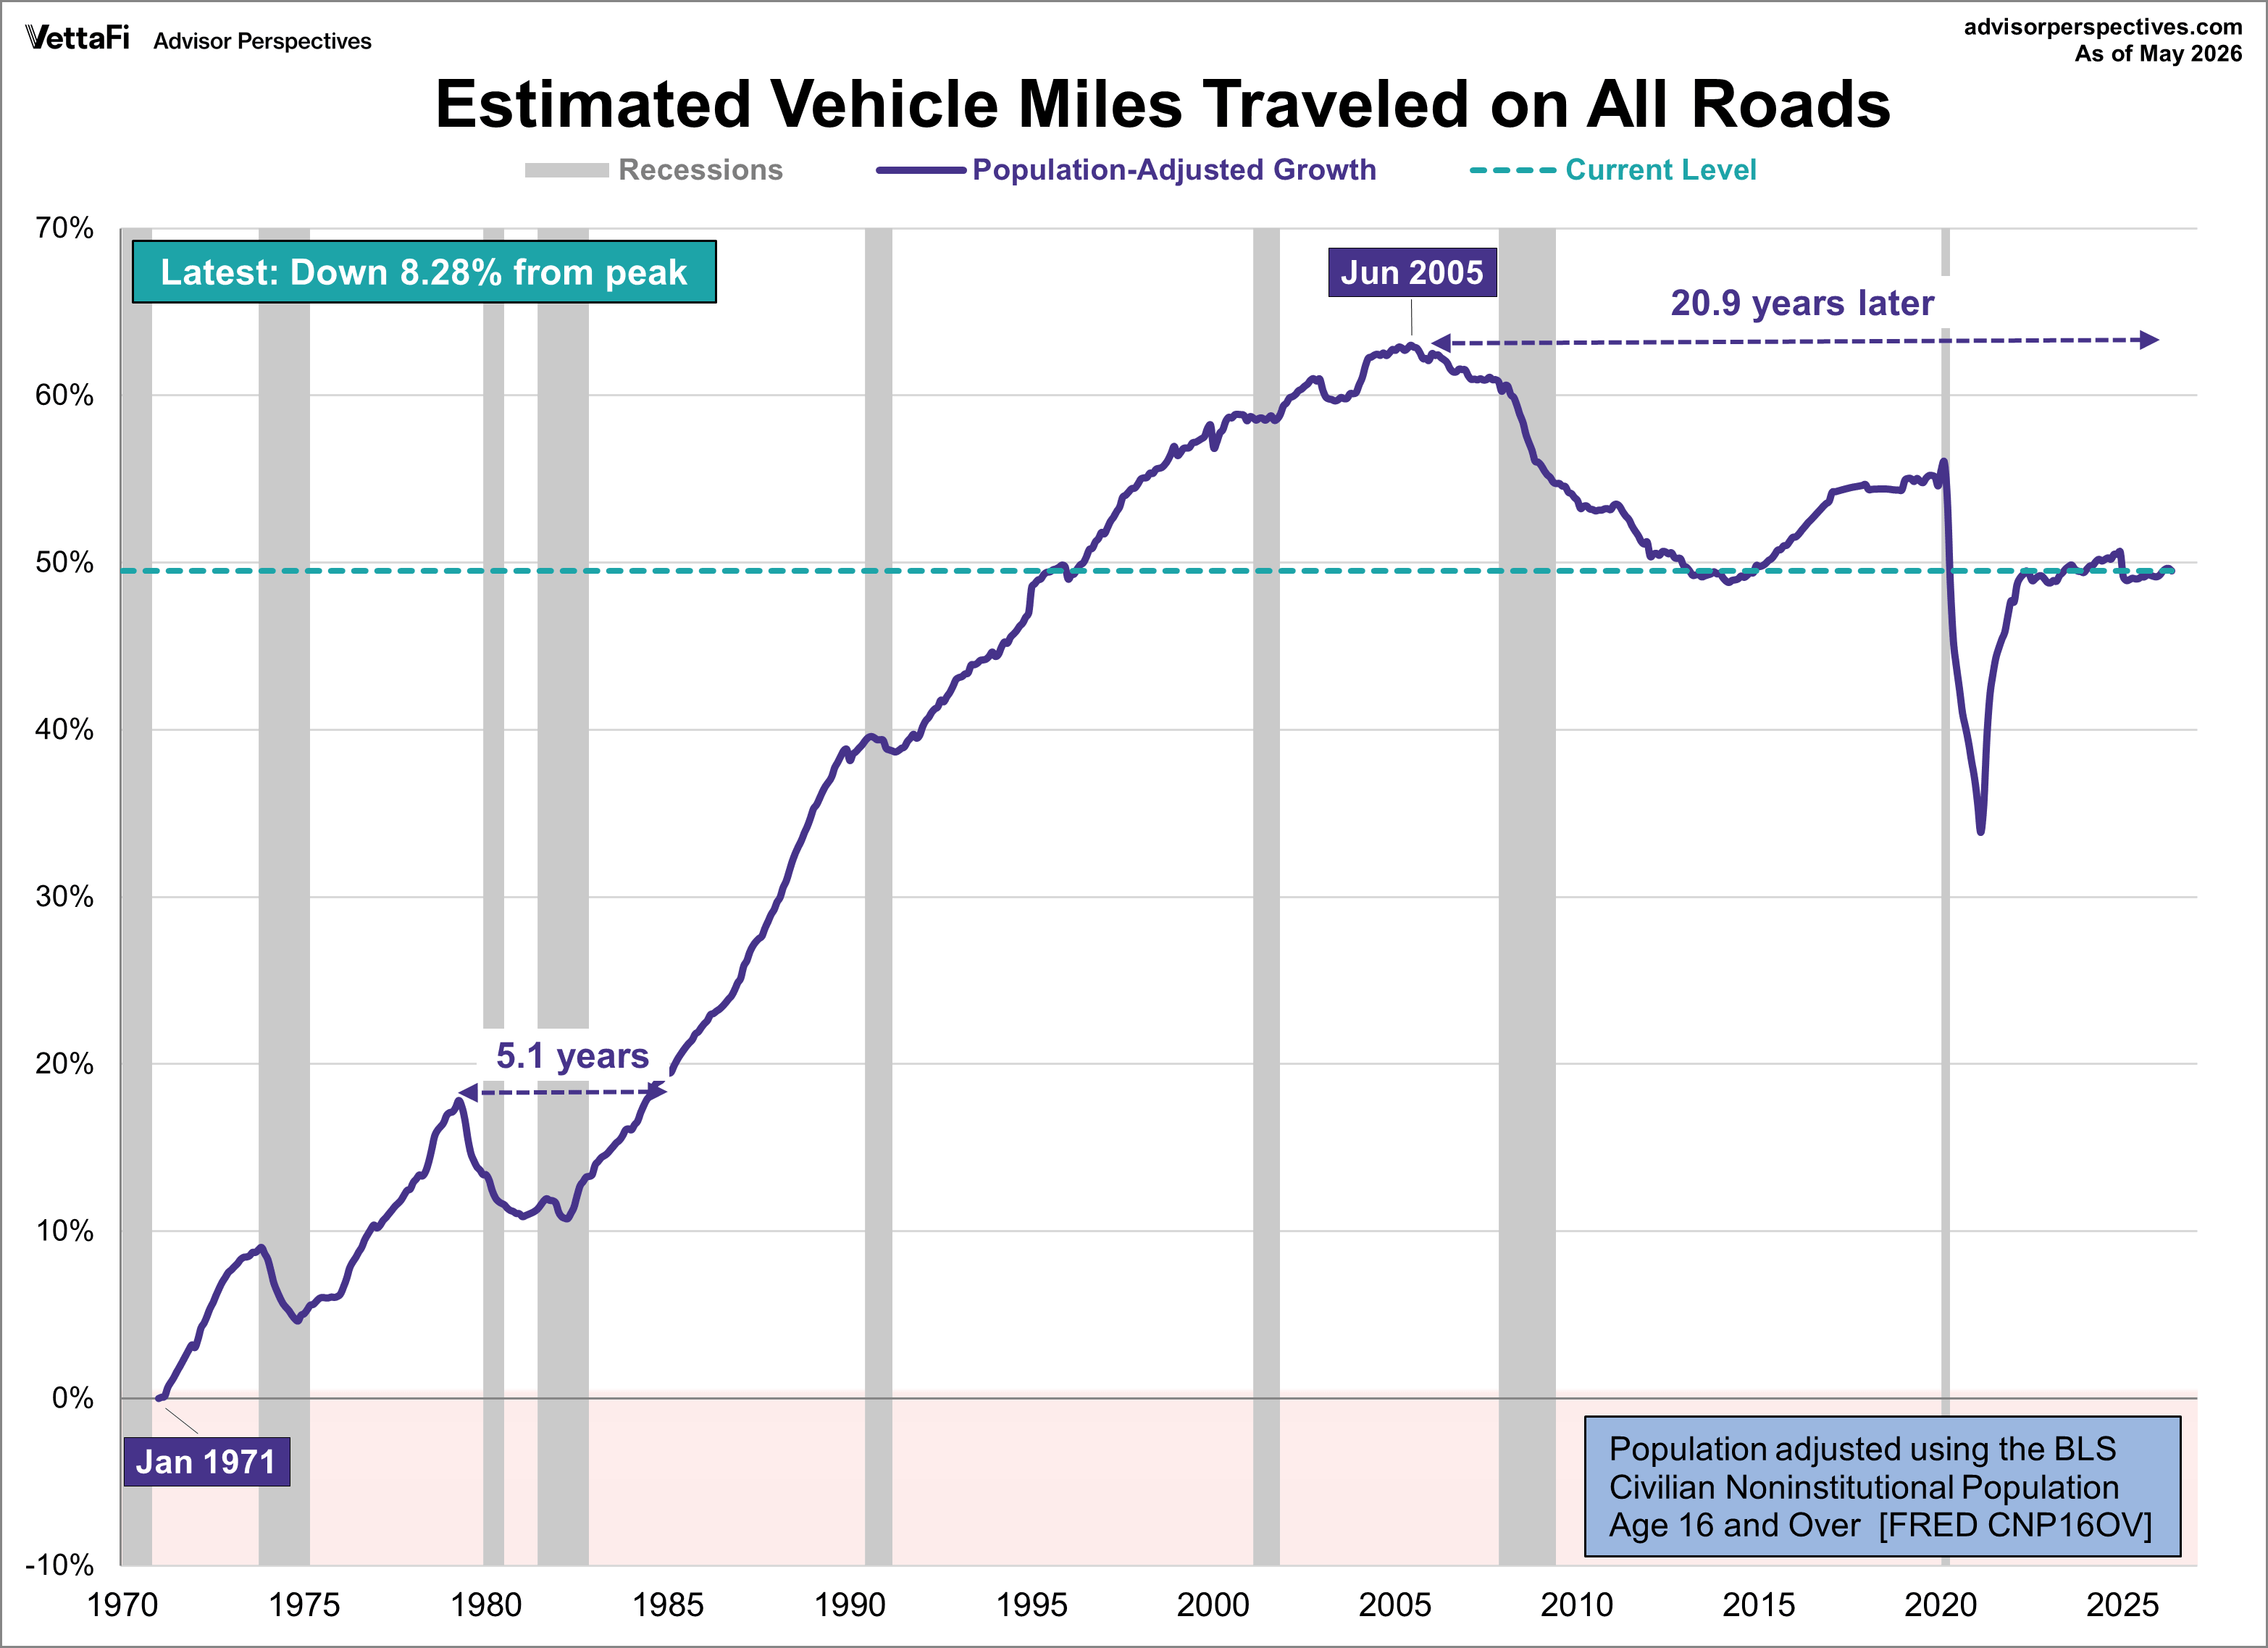
Clearly, when adjusted for population growth, the miles-traveled metric presents a much weaker picture. The nominal 39-month dip that began in April 1979 extends to 61 months, slightly more than five years, with a trough showing a 6.0% decline from the previous peak. The impact of the Great Recession, compounded by the COVID-19 recession, still appears dire when adjusted for population. Estimating the number of months from peak to peak is challenging, as pre-pandemic driving levels have yet to be reached...and may never be again.
The population-adjusted trend fell as low as 17.88% off its June 2005 peak. As of May 2026, the trend was 8.28% off the peak.