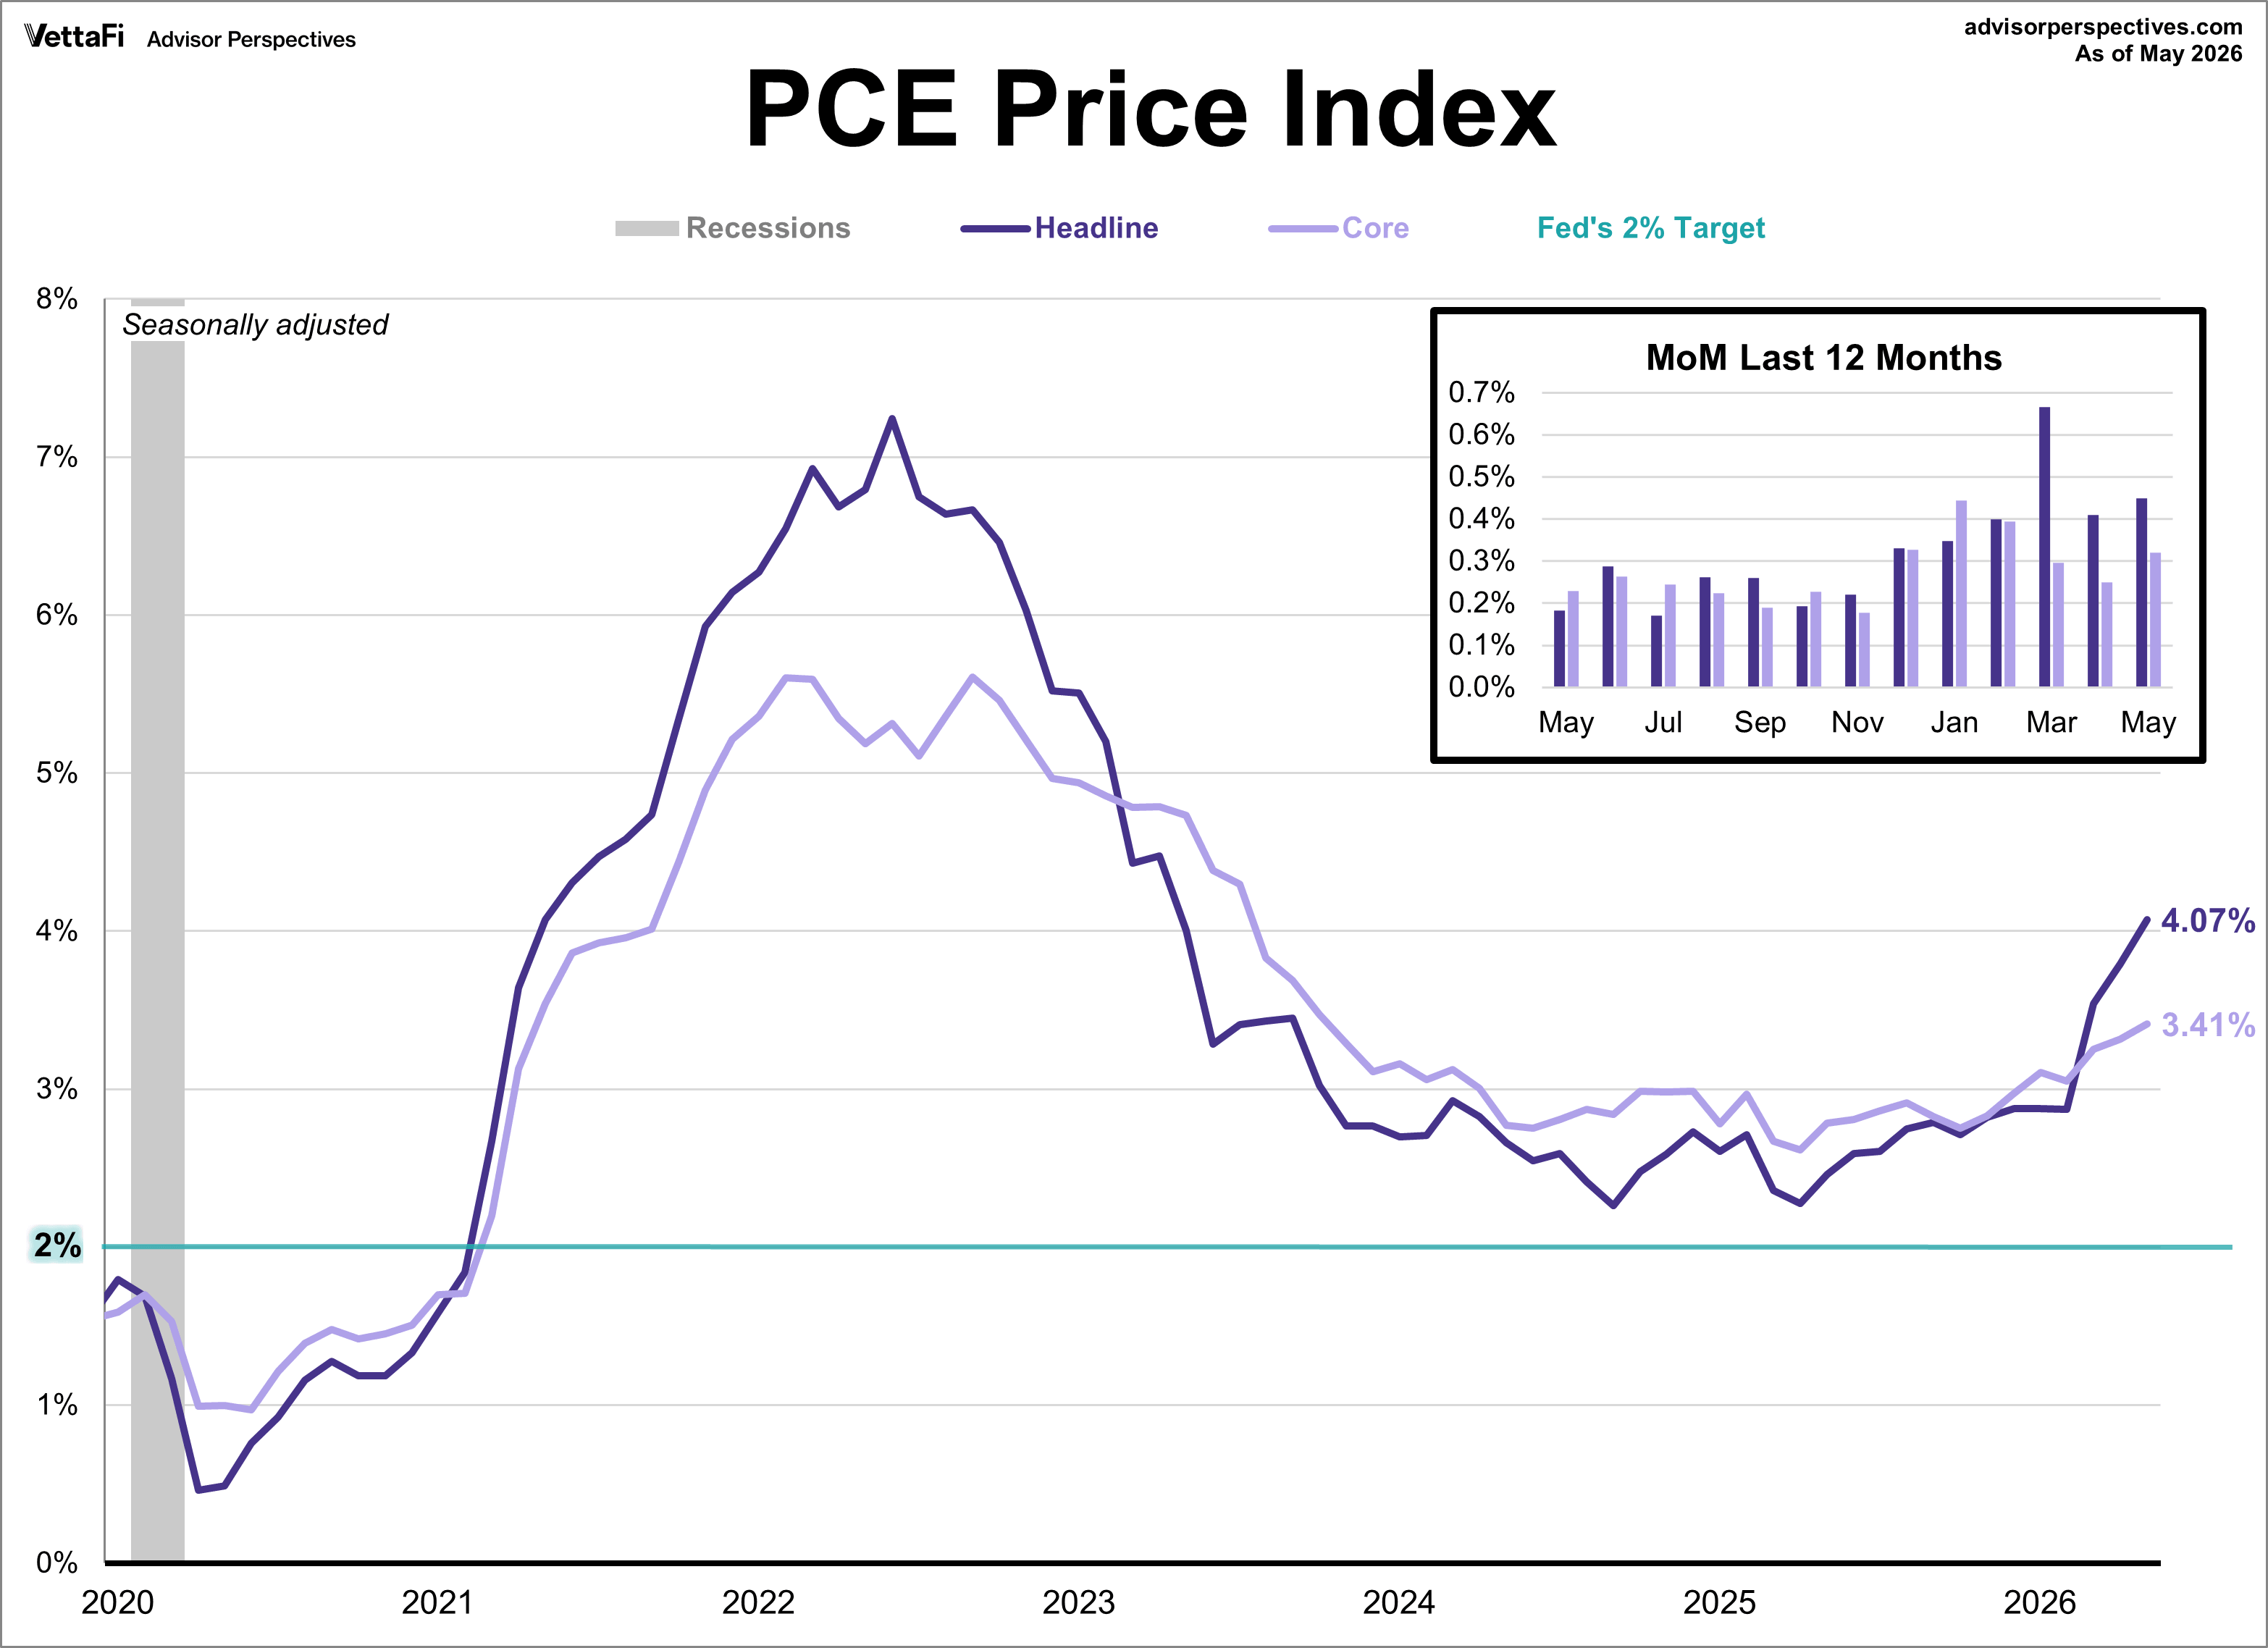
The Federal Reserve’s preferred inflation gauge, the core PCE price index, climbed 3.4% year-over-year in May, matching the forecast. This marks the highest level since October 2023 and marks a pickup from April's 3.3% reading. On a monthly basis, core prices rose 0.3% as expected.
The headline index surged 4.1% year-over-year, meeting expectations and marking its highest level since April 2023. This acceleration was driven by a 0.4% monthly jump, which was lower than the 0.5% forecast.
Understanding the PCE Price Index
Personal consumption expenditures (PCE) track the actual spending habits (personal consumption) of domestic consumers. The headline number includes all categories, capturing the immediate "sticker shock" felt by households at the pump and grocery store. Core PCE excludes food and energy, making it less volatile than the headline PCE and thus provides a clearer view of long-term inflation trends.

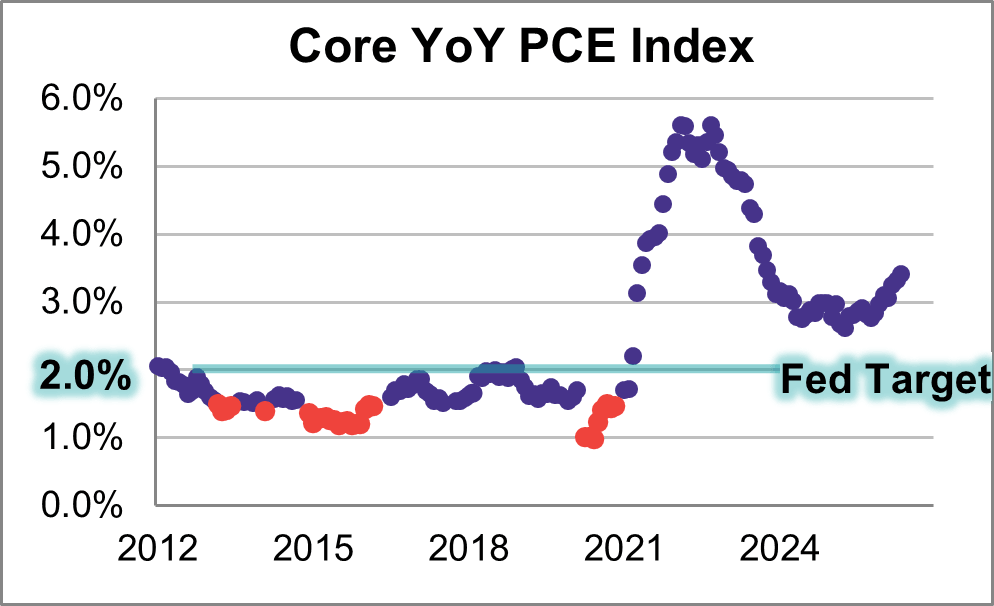
The adjacent thumbnail gives us a close-up of the trend in YoY core PCE since January 2012. The first string of red data points highlights the 12 consecutive months when core PCE hovered in a narrow range around its interim low. The second string highlights the lower range from late 2014 through 2015. Core PCE shifted higher in 2016 with a decline in 2017, 2019, and 2020, with a major jump in 2022.
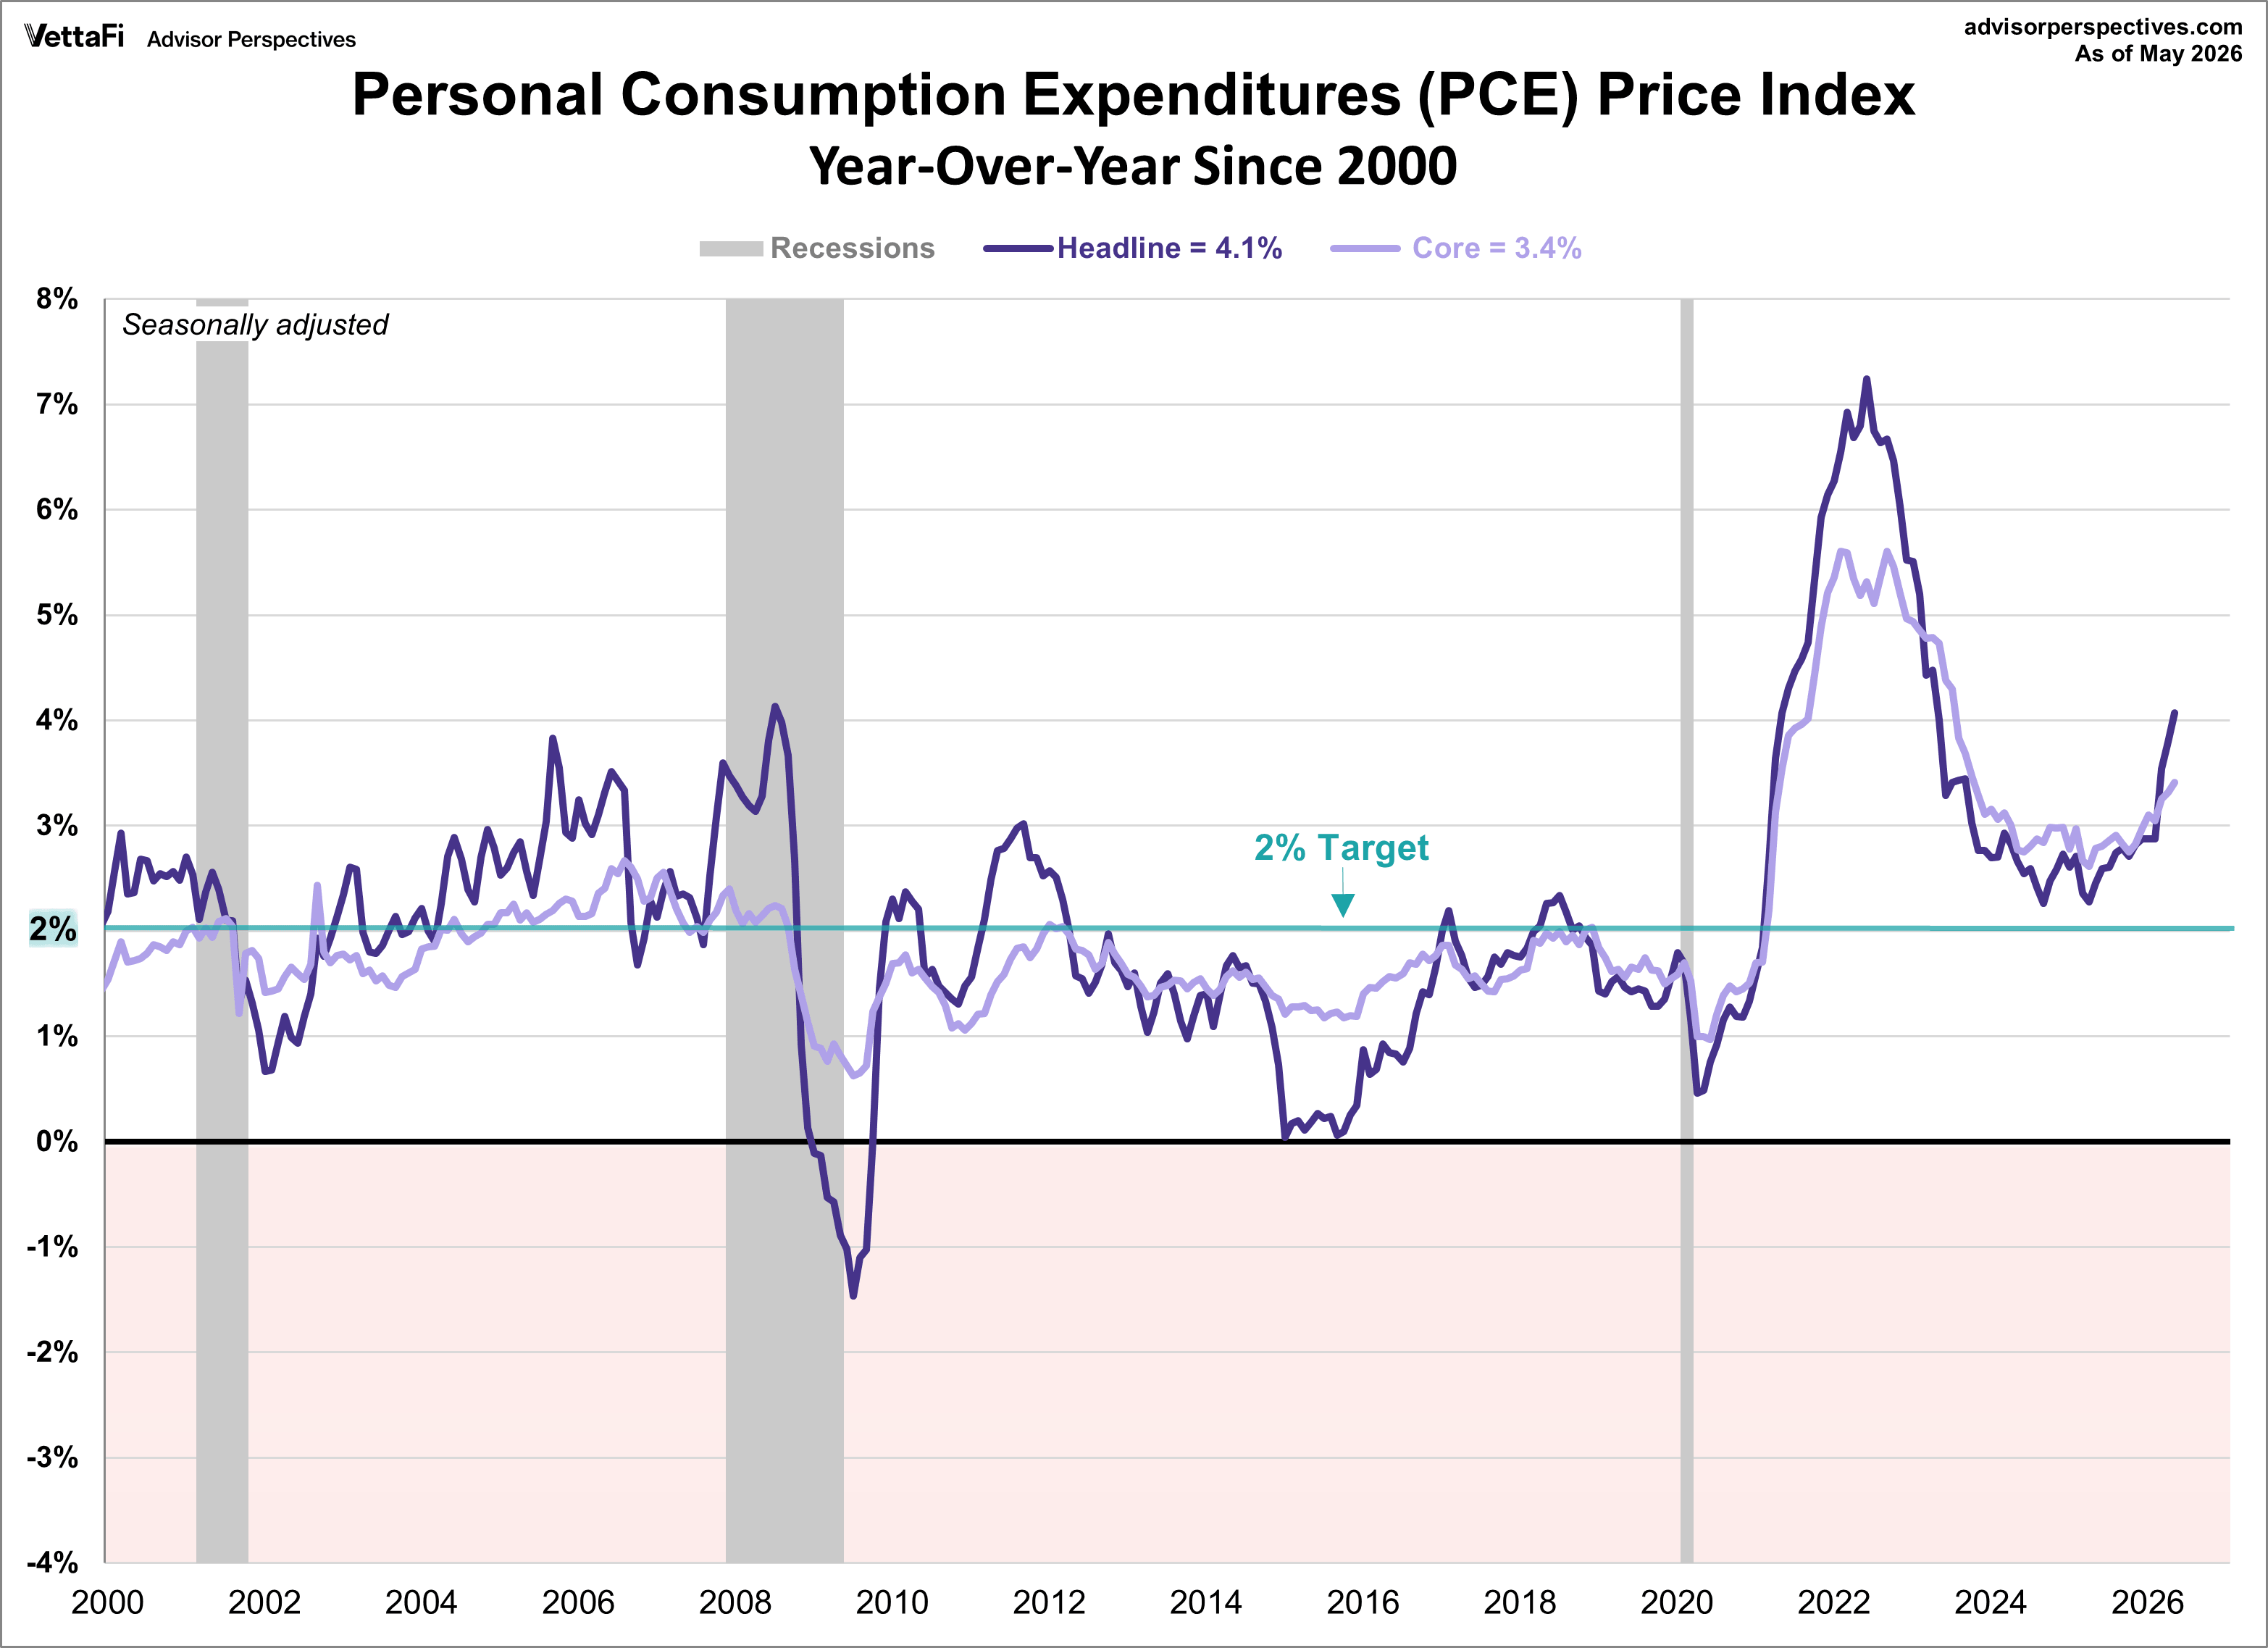
The following chart illustrates the monthly year-over-year changes since 2000, with the 2% benchmark highlighted as the Fed's ultimate target.
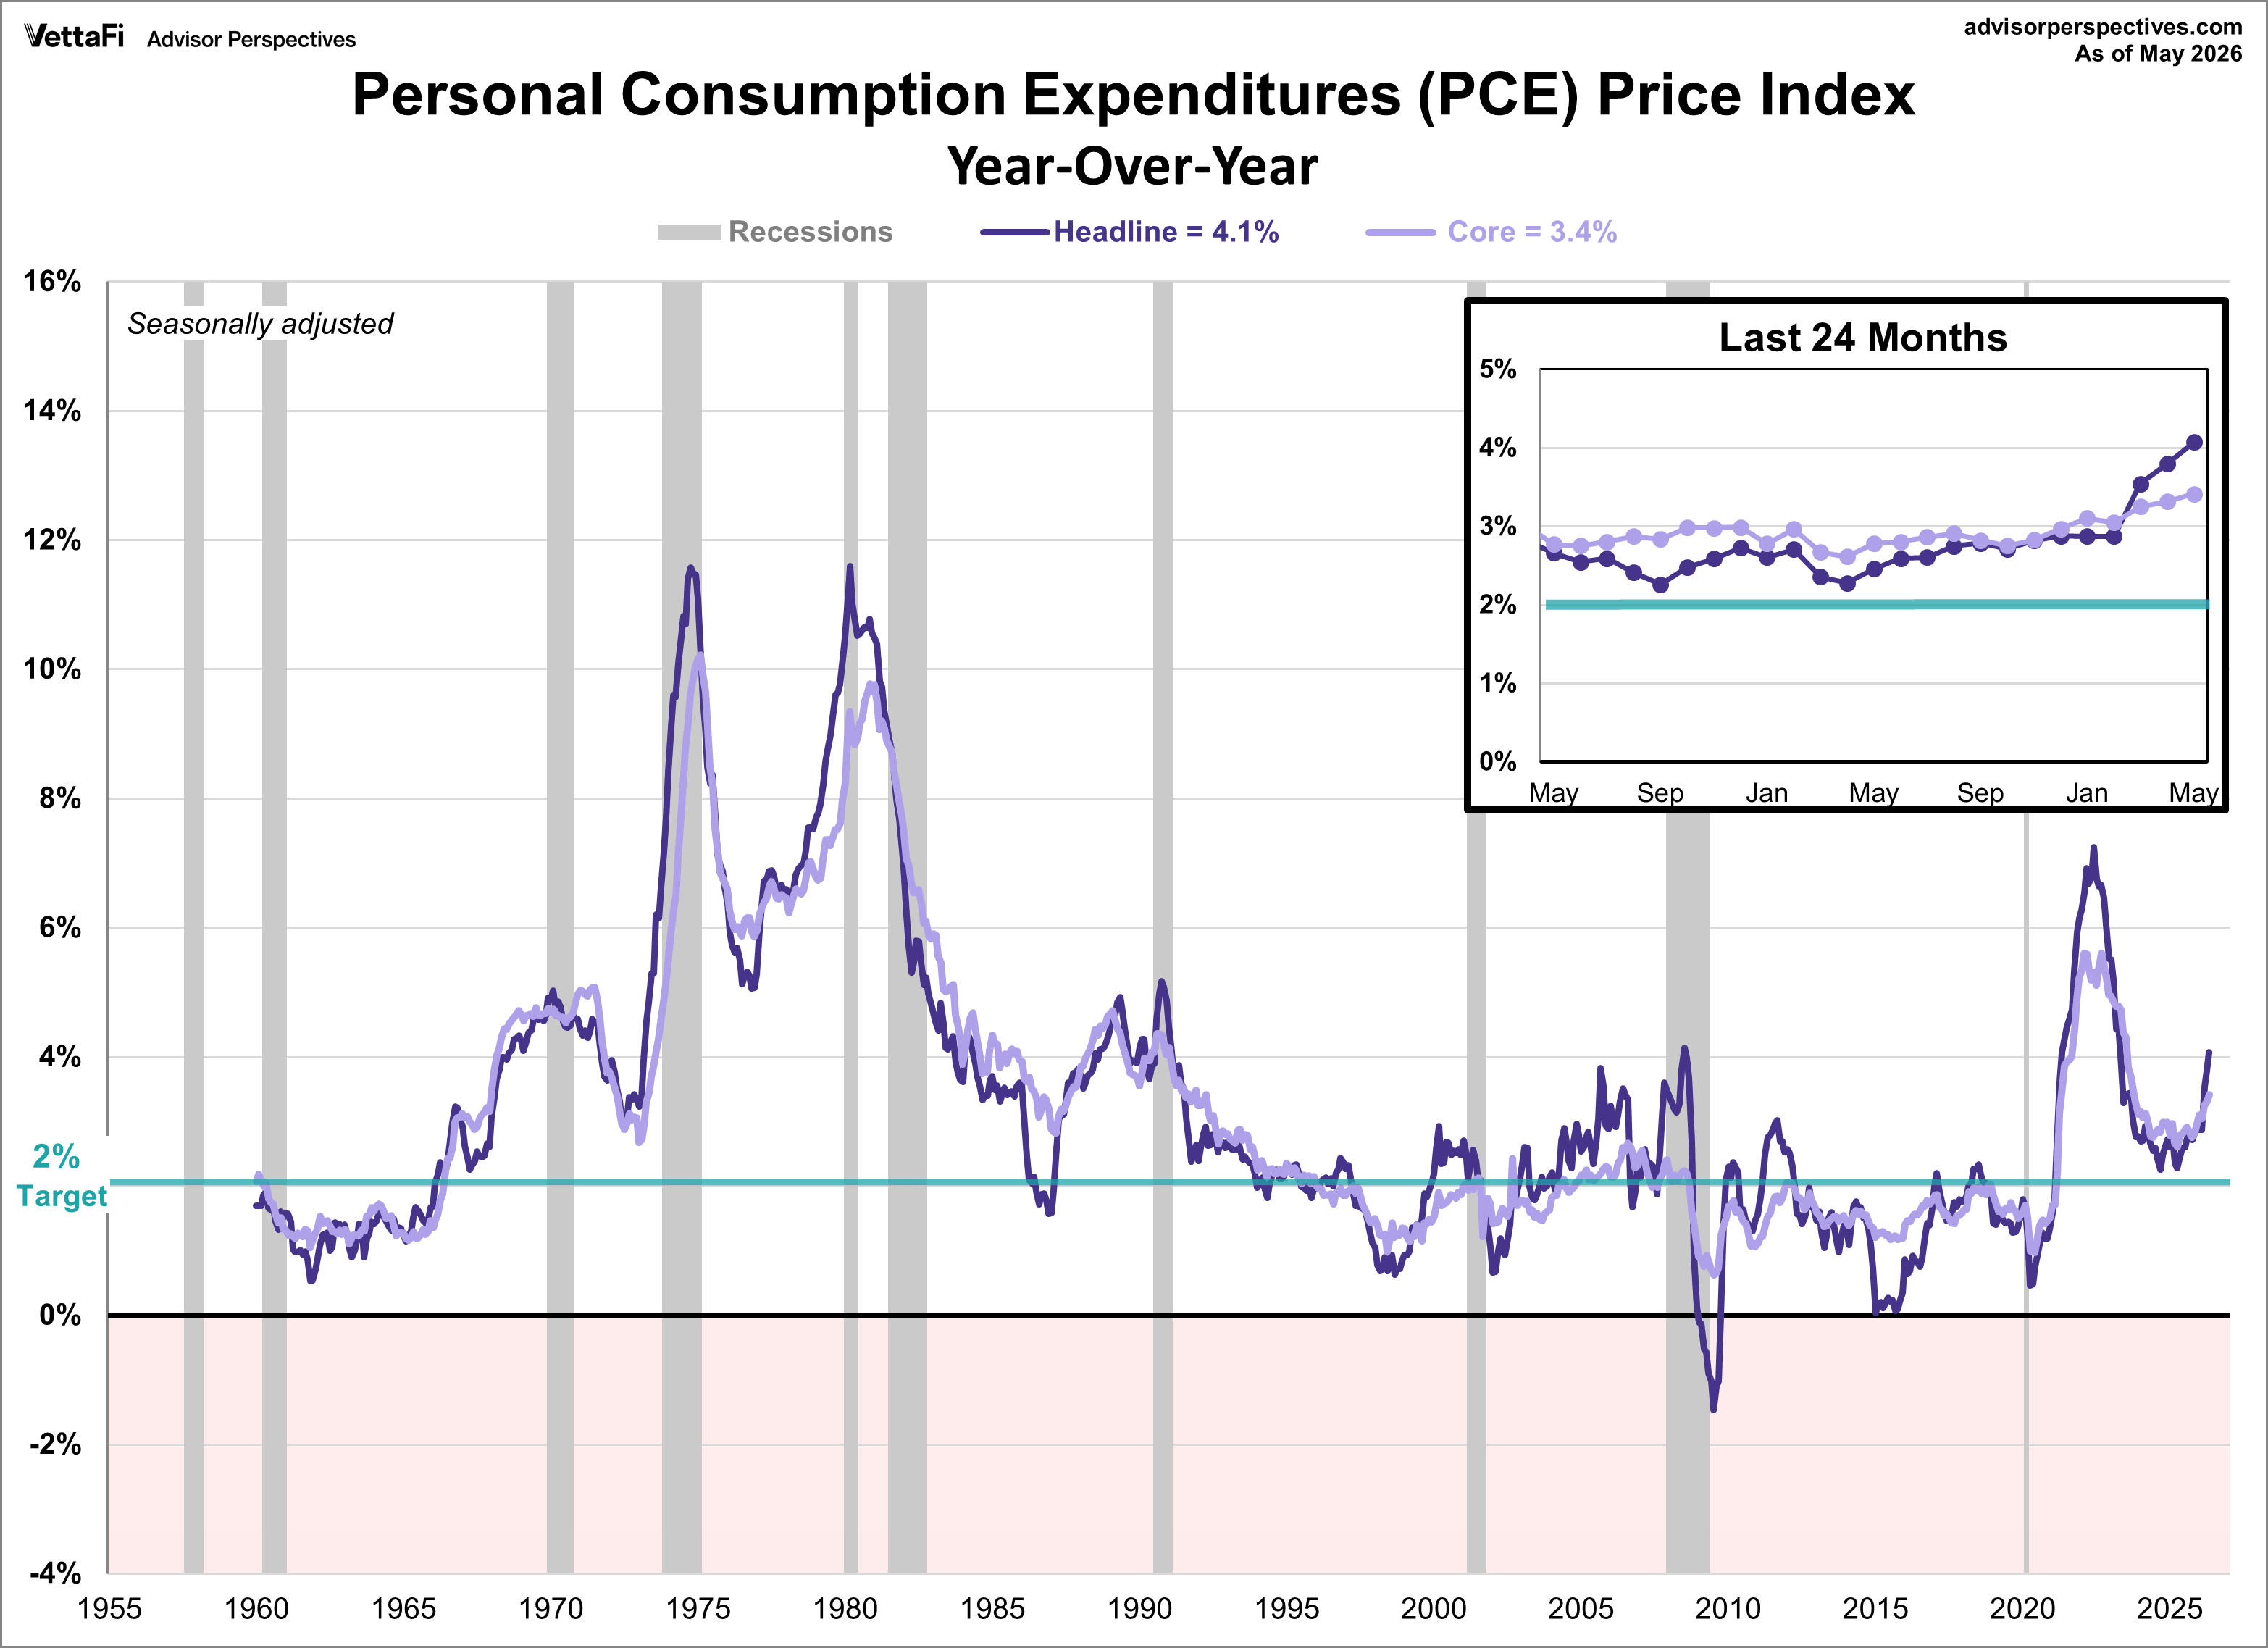
For a long-term perspective, here are the same two metrics spanning five decades.
Inflation: The Fed's 2% Target
The Federal Reserve concluded its fourth meeting of the year by maintaining the federal funds rate at 3.50%–3.75%. The decision, which markets had fully priced in, keeps the benchmark rate at its lowest level since November 2022 for the fourth meeting in a row. However, the recent PCE figures suggest the "last mile" of the inflation fight is proving difficult.
In their noticeably shorter statement from the meeting, the Committee noted, "Inflation remains elevated relative to the Committee's 2 percent goal, in part reflecting supply shocks that have driven price increases in certain sectors, including energy." They stated that they will "deliver price stability."
The Fed will meet again next month where they are expected to hold rates steady. At the time of writing, the CMEFedWatch Tool shows a 68% likelihood the Fed will hold rates where they are versus a 32% likelihood of a 25 basis point hike.
For further comparison on how this data aligns with other metrics, see our analysis on PCE vs. CPI.
Read more updates by Jen Nash
 The adjacent thumbnail gives us a close-up of the trend in YoY core PCE since January 2012. The first string of red data points highlights the 12 consecutive months when core PCE hovered in a narrow range around its interim low. The second string highlights the lower range from late 2014 through 2015. Core PCE shifted higher in 2016 with a decline in 2017, 2019, and 2020, with a major jump in 2022.