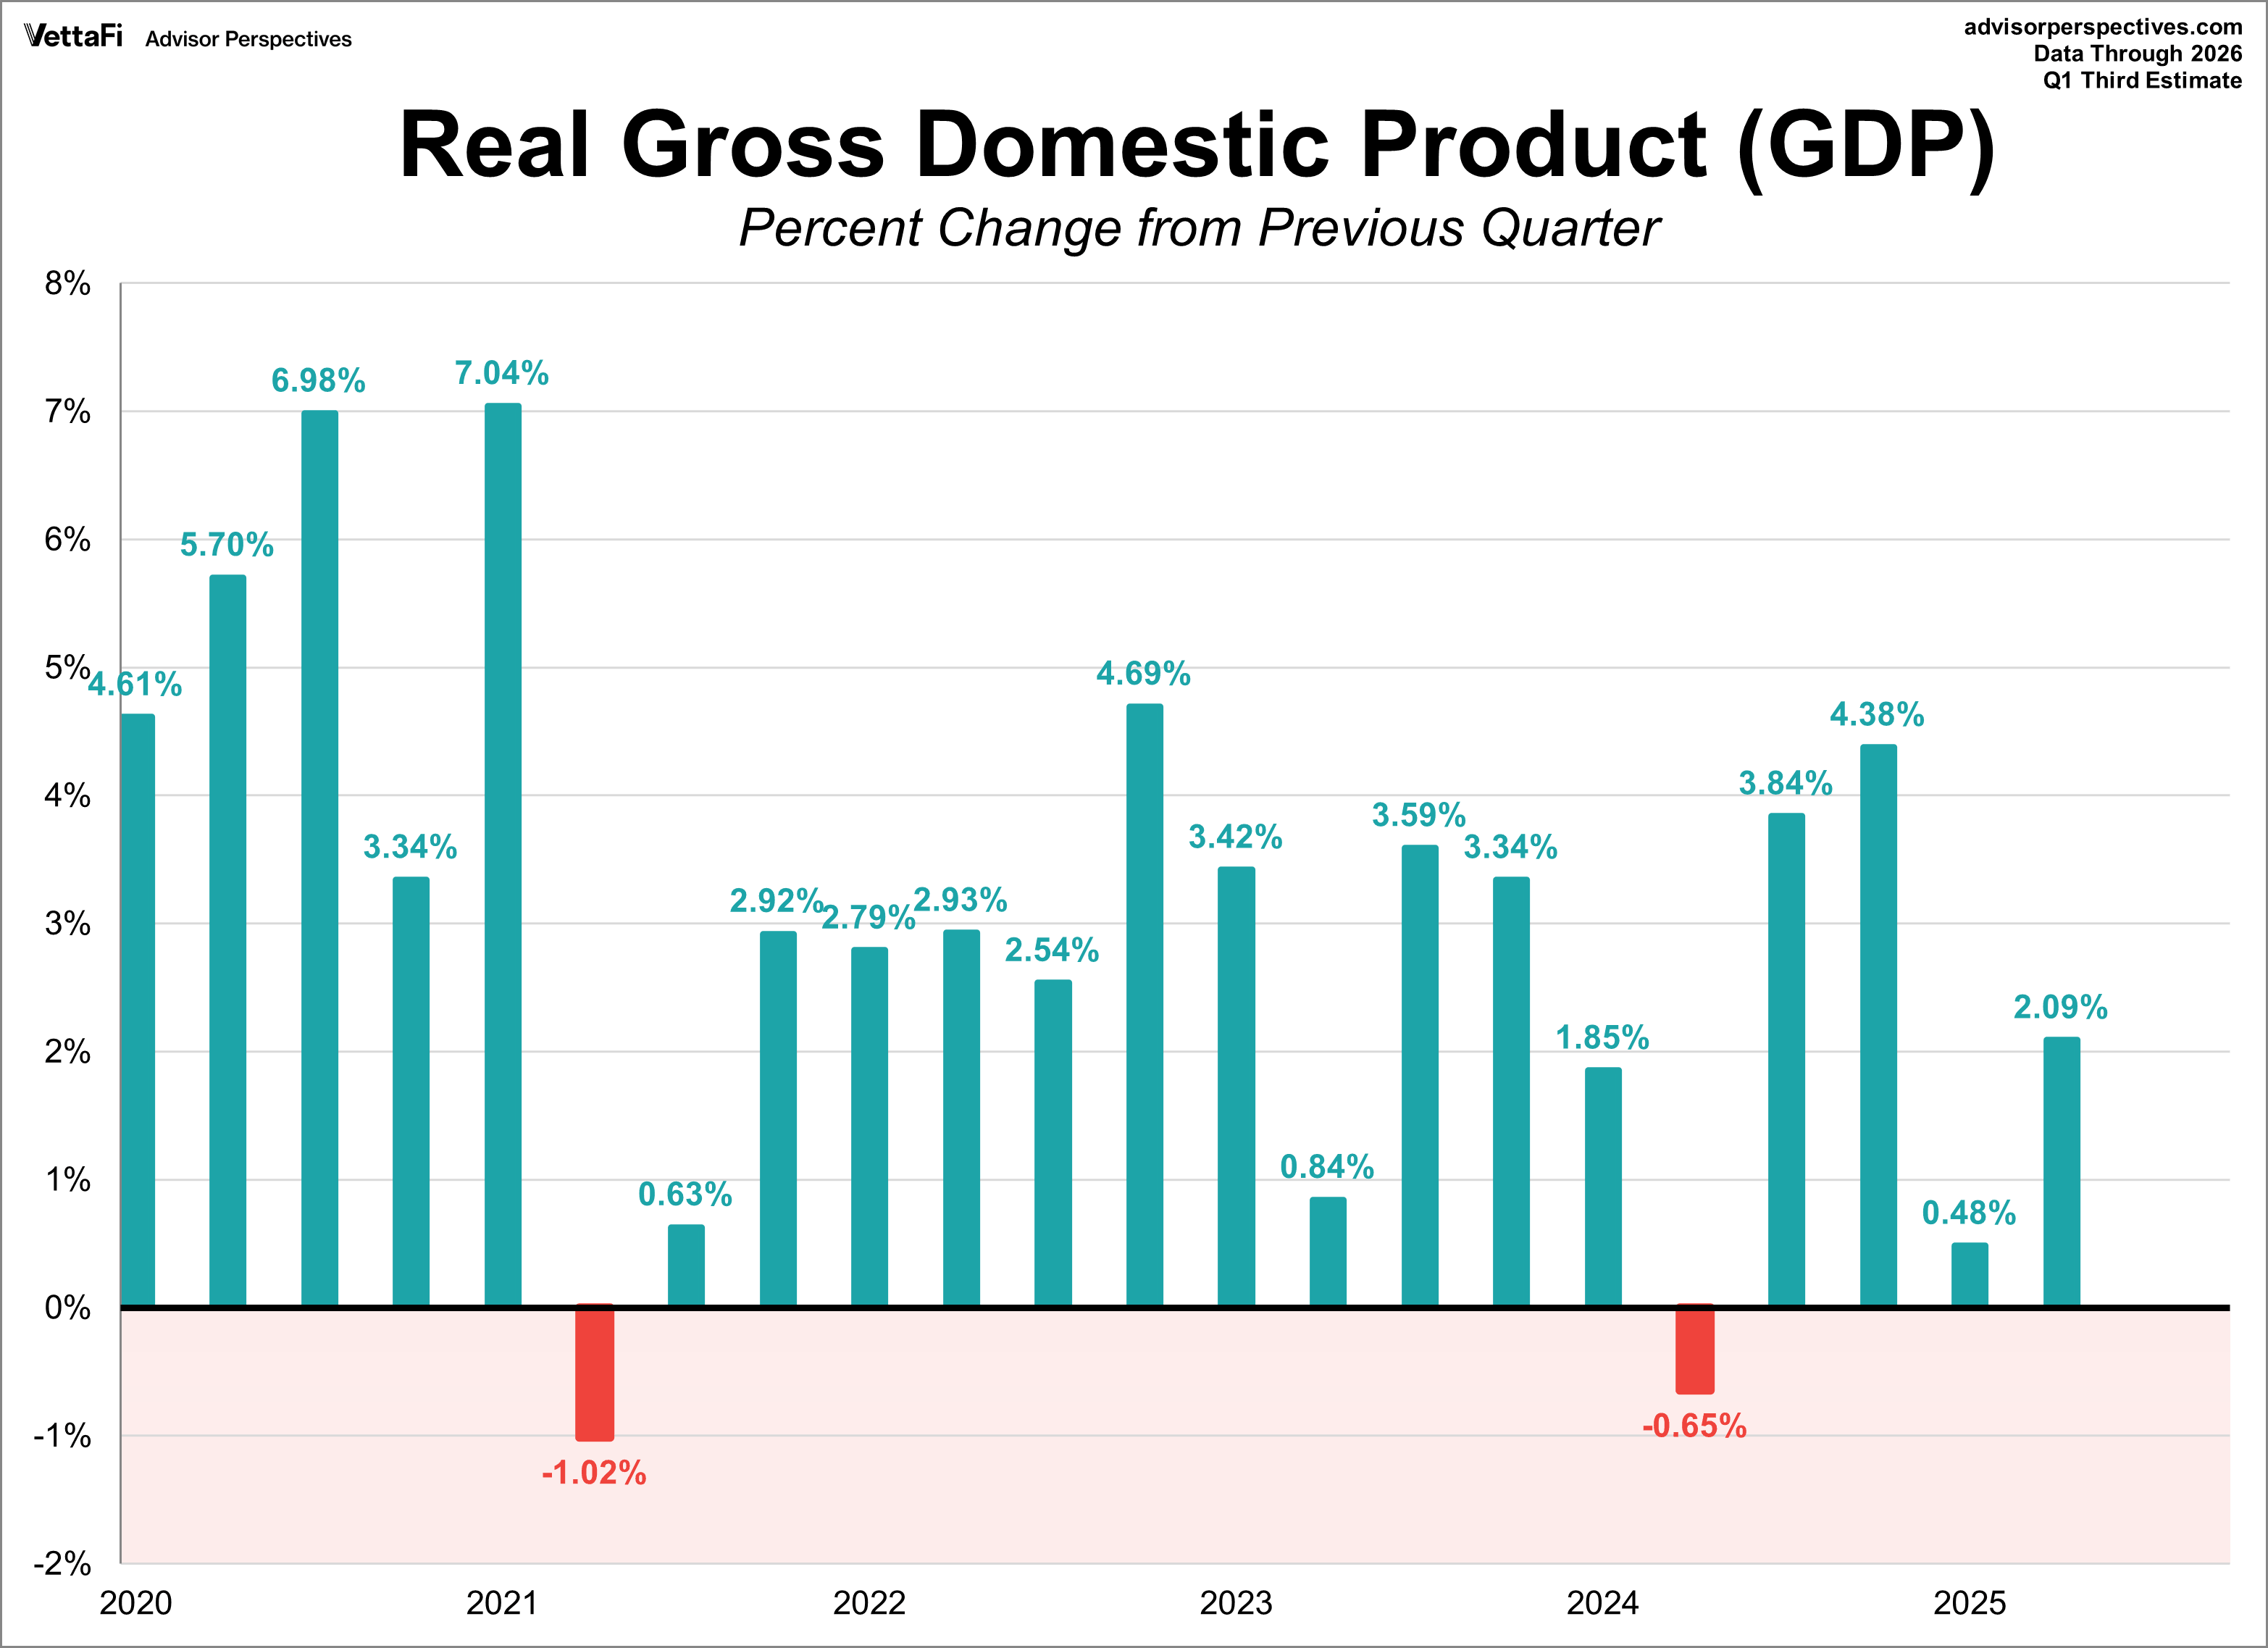
U.S. economic growth rebounded at the beginning of 2026, according to the BEA’s latest estimate. Real GDP rose at a 2.1% annual rate in Q1, exceeding the 1.6% forecast and marking a sharp acceleration from the 0.5% final estimate seen in Q4 of last year.
Key Takeaways
- Real GDP grew at a 2.1% annual rate in the first quarter of 2026, exceeding forecasts.
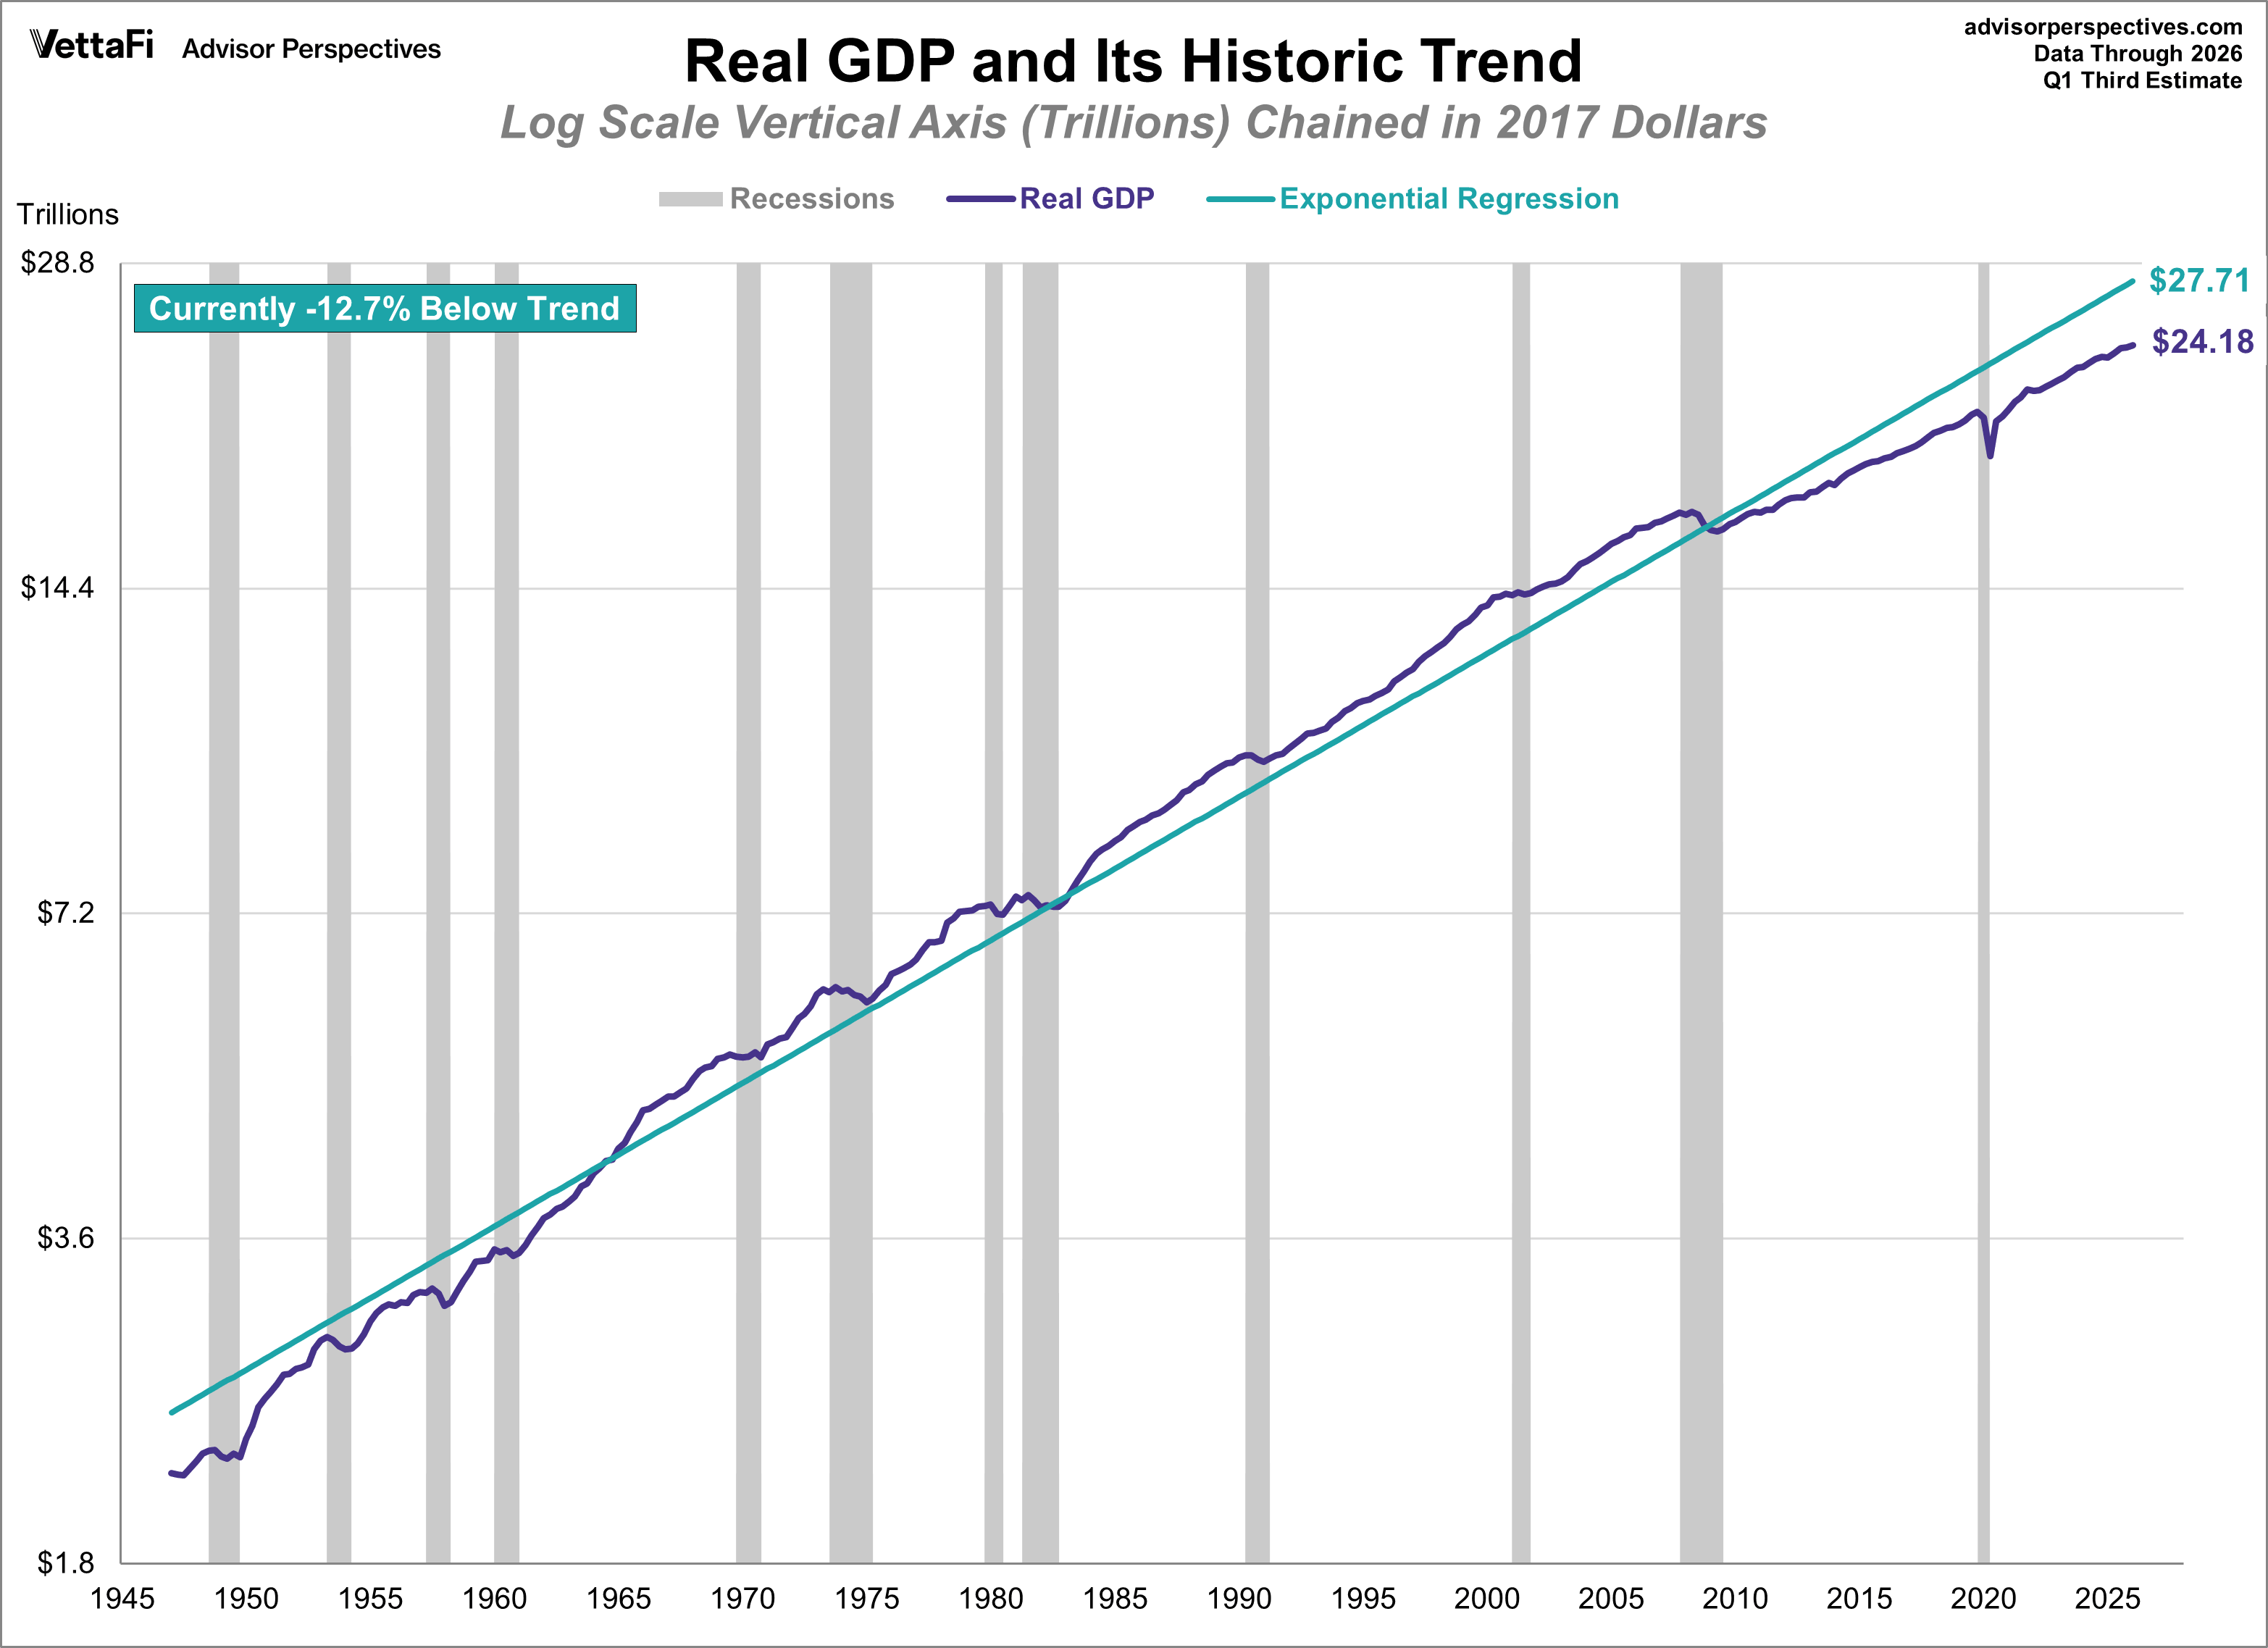
- Real GDP currently sits 12.7% below the pre-2008 Great Recession economic trend.
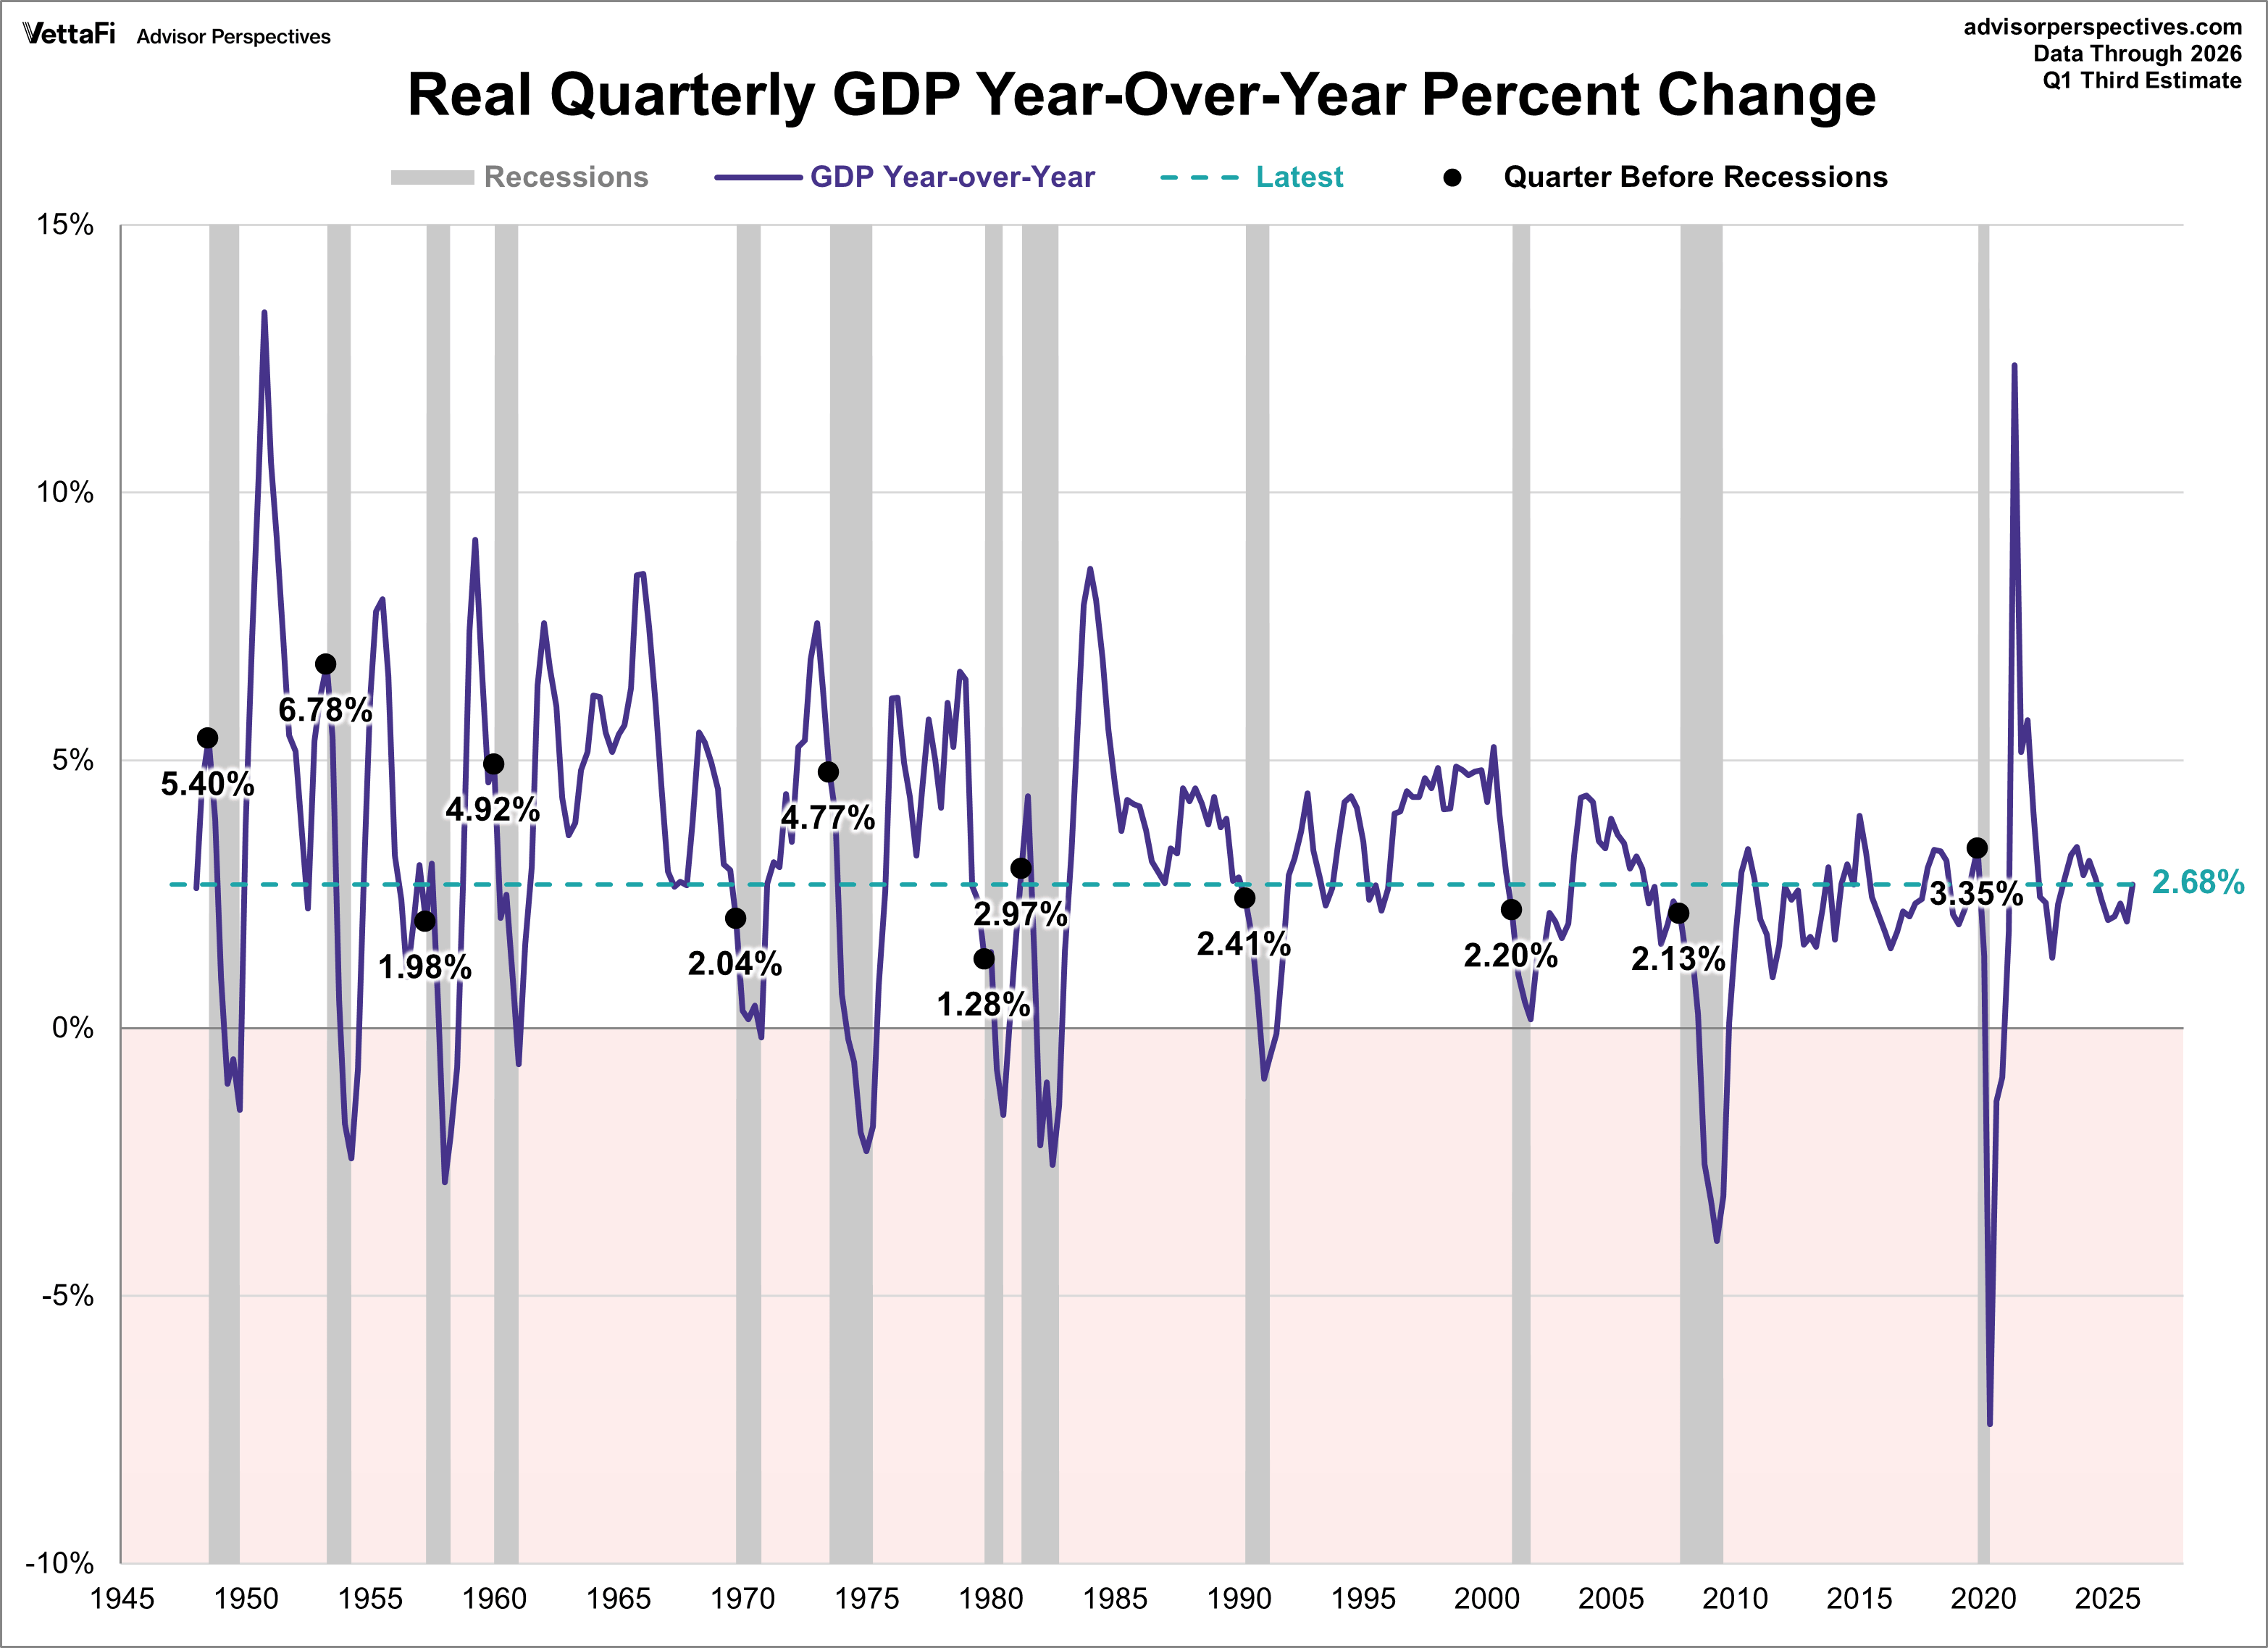
- Real GDP growth averaged 3.2% year-over-year at the start of U.S. recessions since 1947.
Here is the opening text from the Bureau of Economic Analysis news release:
Real gross domestic product (GDP) increased at an annual rate of 2.1 percent in the first quarter of 2026 (January, February, and March), according to the third estimate released today by the U.S. Bureau of Economic Analysis. In the fourth quarter of 2025, real GDP increased 0.5 percent. The contributors to the increase in real GDP in the first quarter were increases in investment, exports, government spending, and consumer spending. Imports, which are a subtraction in the calculation of GDP, increased.
Gross Domestic Product (GDP)
Real gross domestic product (GDP) measures how fast or slowly the economy is growing and measures the inflation-adjusted value of all goods and services produced by the economy. It is considered the broadest measure of economic activity and the primary indicator of an economy's health. The Bureaus of Economic Analysis (BEA) releases real GDP data on a monthly basis. There are three versions released a month apart, advance, second, and final, each incorporating data that was previously unavailable. Economists can use GDP to determine whether an economy is growing or experiencing a recession.
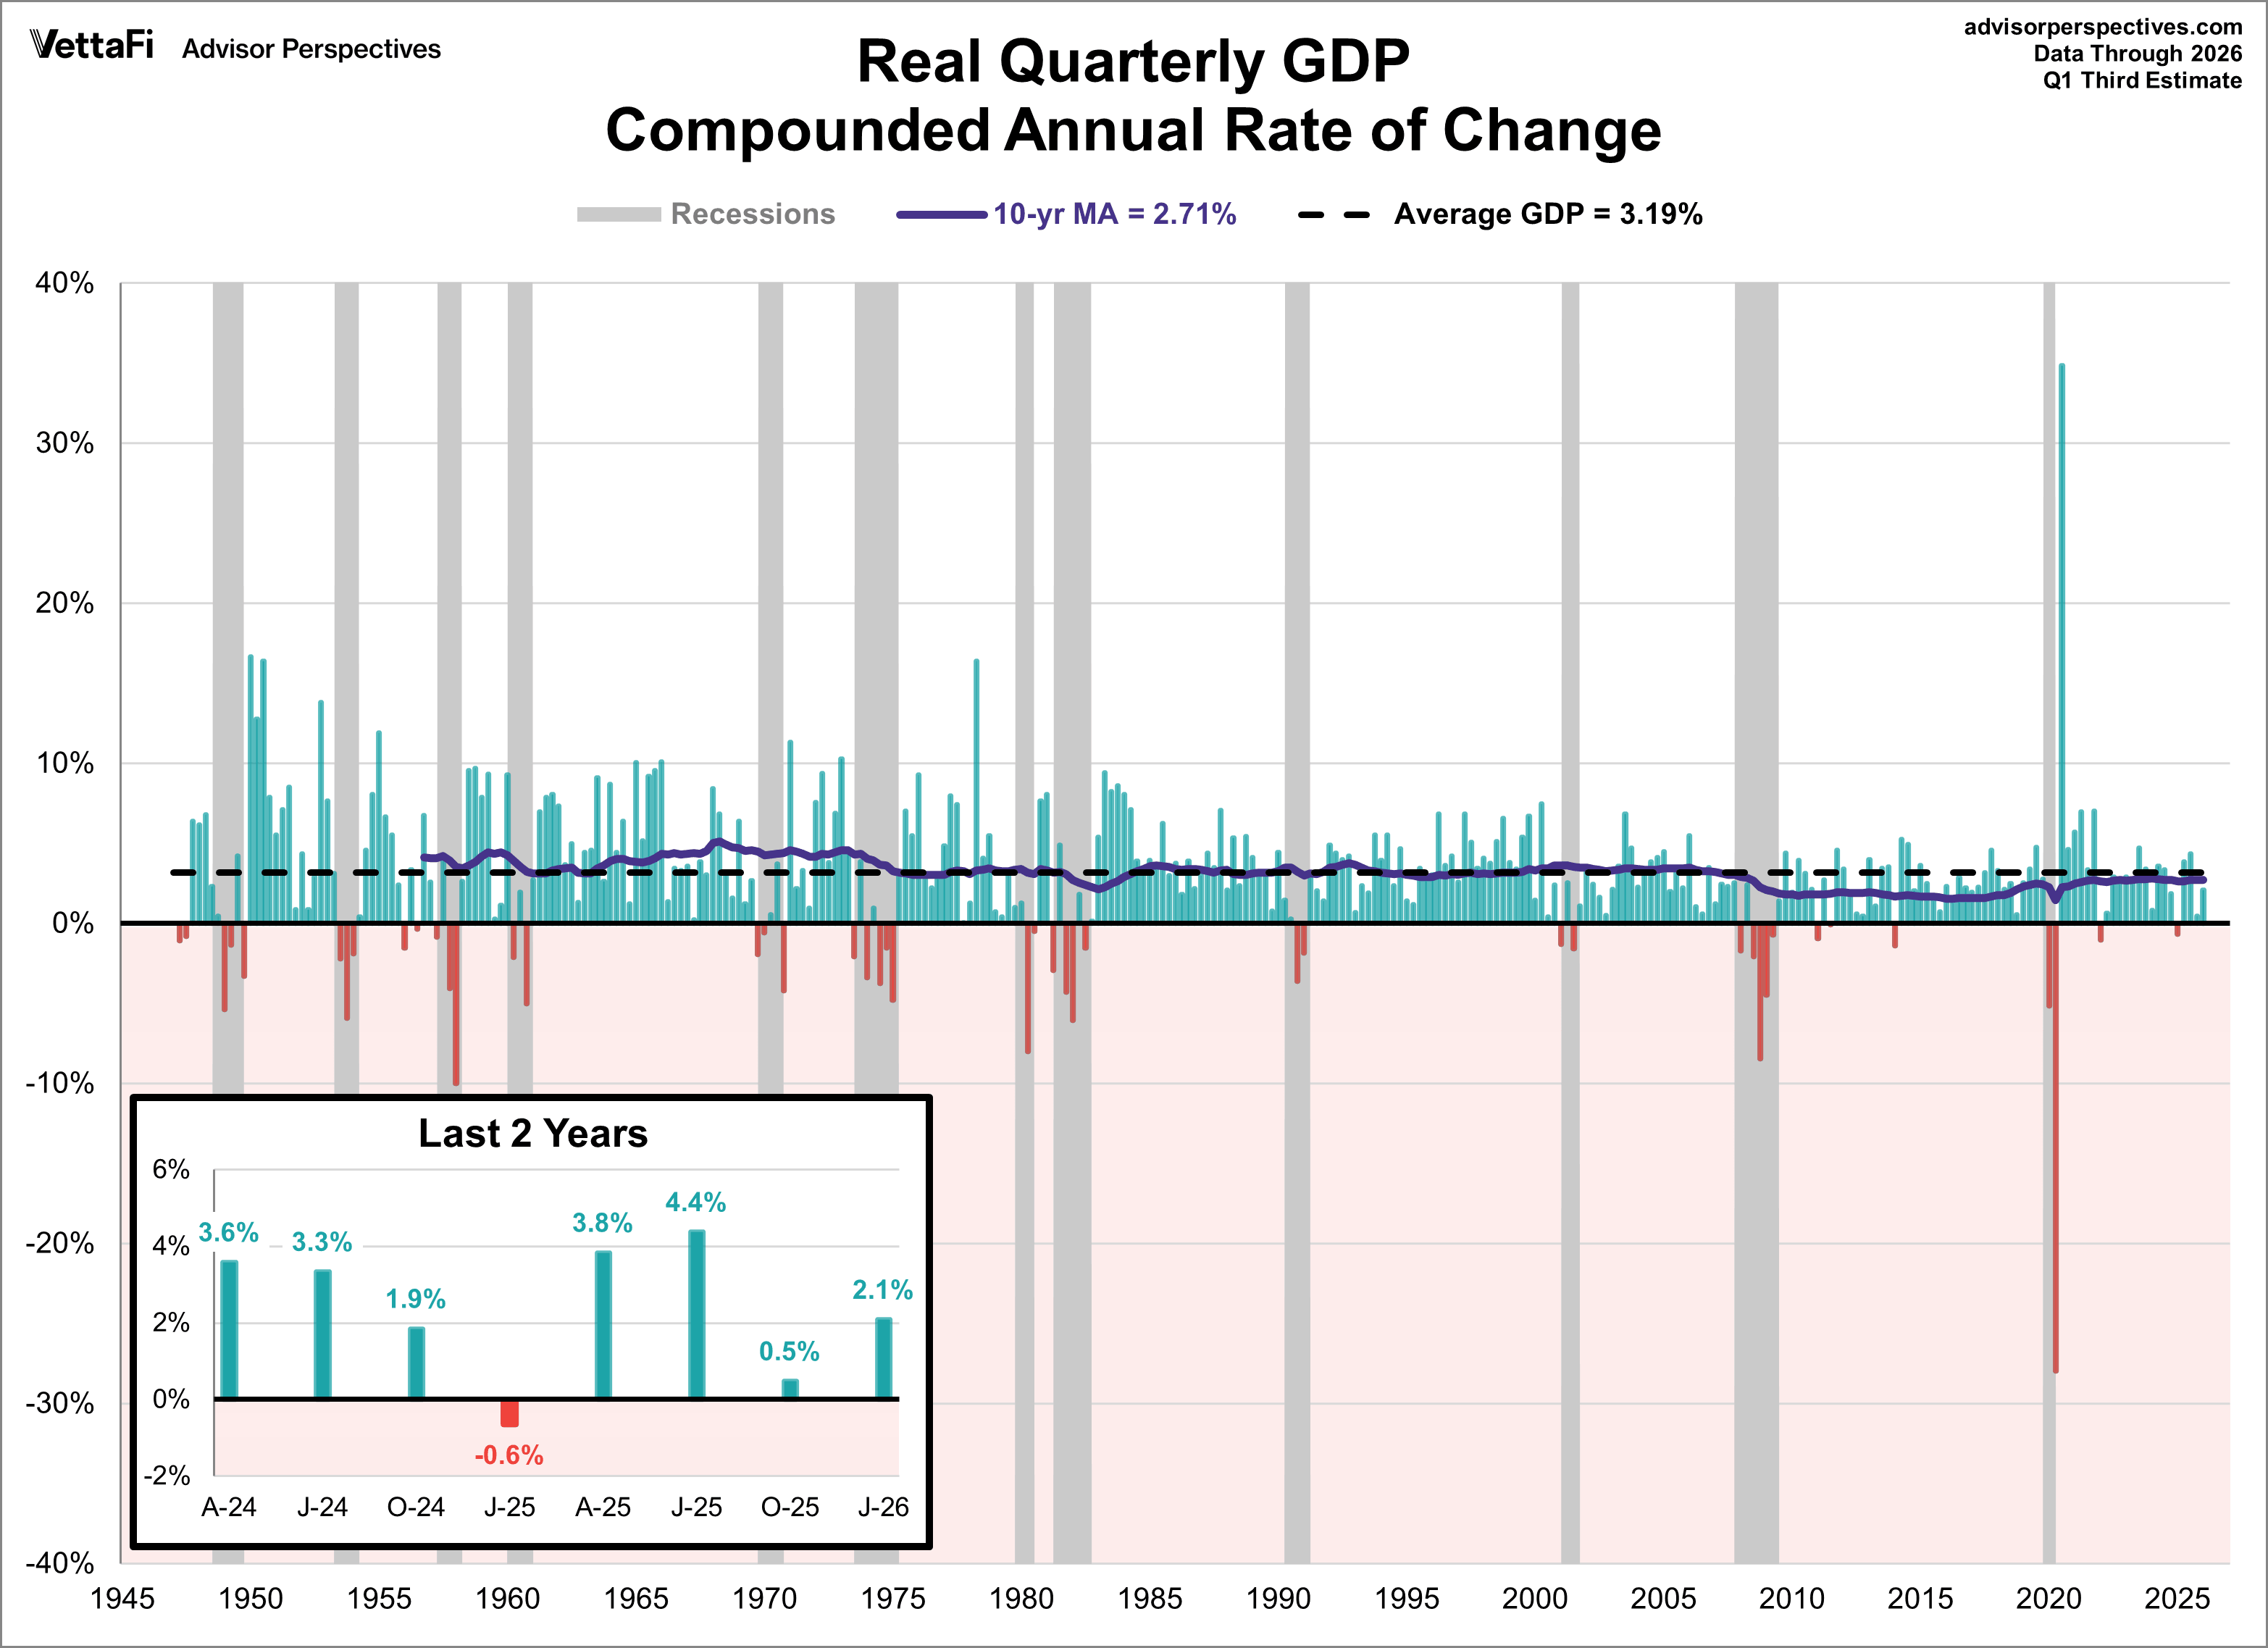
This chart illustrates the annualized, inflation-adjusted change in U.S. gross domestic product (GDP) from the preceding quarter, with data beginning in Q2 1947. (Prior to Q2 1947, GDP was calculated annually.) For context, the chart also highlights recessions (as determined by the National Bureau of Economic Research, NBER), the historical GDP growth average of 3.19%, and the current 10-year moving average of 2.71%.
A key trend is evident: the 10-year moving average of GDP growth fell below the historical average in 2007 and has remained there, signaling a significant deceleration in U.S. economic expansion since the Great Recession. Current growth is below both the long-term series average and the 10-year moving average, indicating a slower pace of growth than experienced historically.

The chart above has many interesting data points but can be quite overwhelming to look at. This next chart provides a simplified look over the past few years.
Here is a log-scale chart of real GDP with an exponential regression, which helps us understand growth cycles since the 1947 inception of quarterly GDP. The regression illustrates the fact that the current trend, since the Great Recession, has a visibly lower slope than the long-term trend. In fact, the current GDP is 12.7% below the pre-recession trend (2008).
A particularly telling representation of slowing growth in the US economy is the year-over-year rate of change. Beginning in 1947, the average year-over-year rate at the start of recessions is 3.2% with a range of 1.28% to 6.78%. The current year-over-year rate for real GDP is at 2.68%, which is at or below 6 of the 12 recession starts during this time frame.
GDP: A Look Ahead
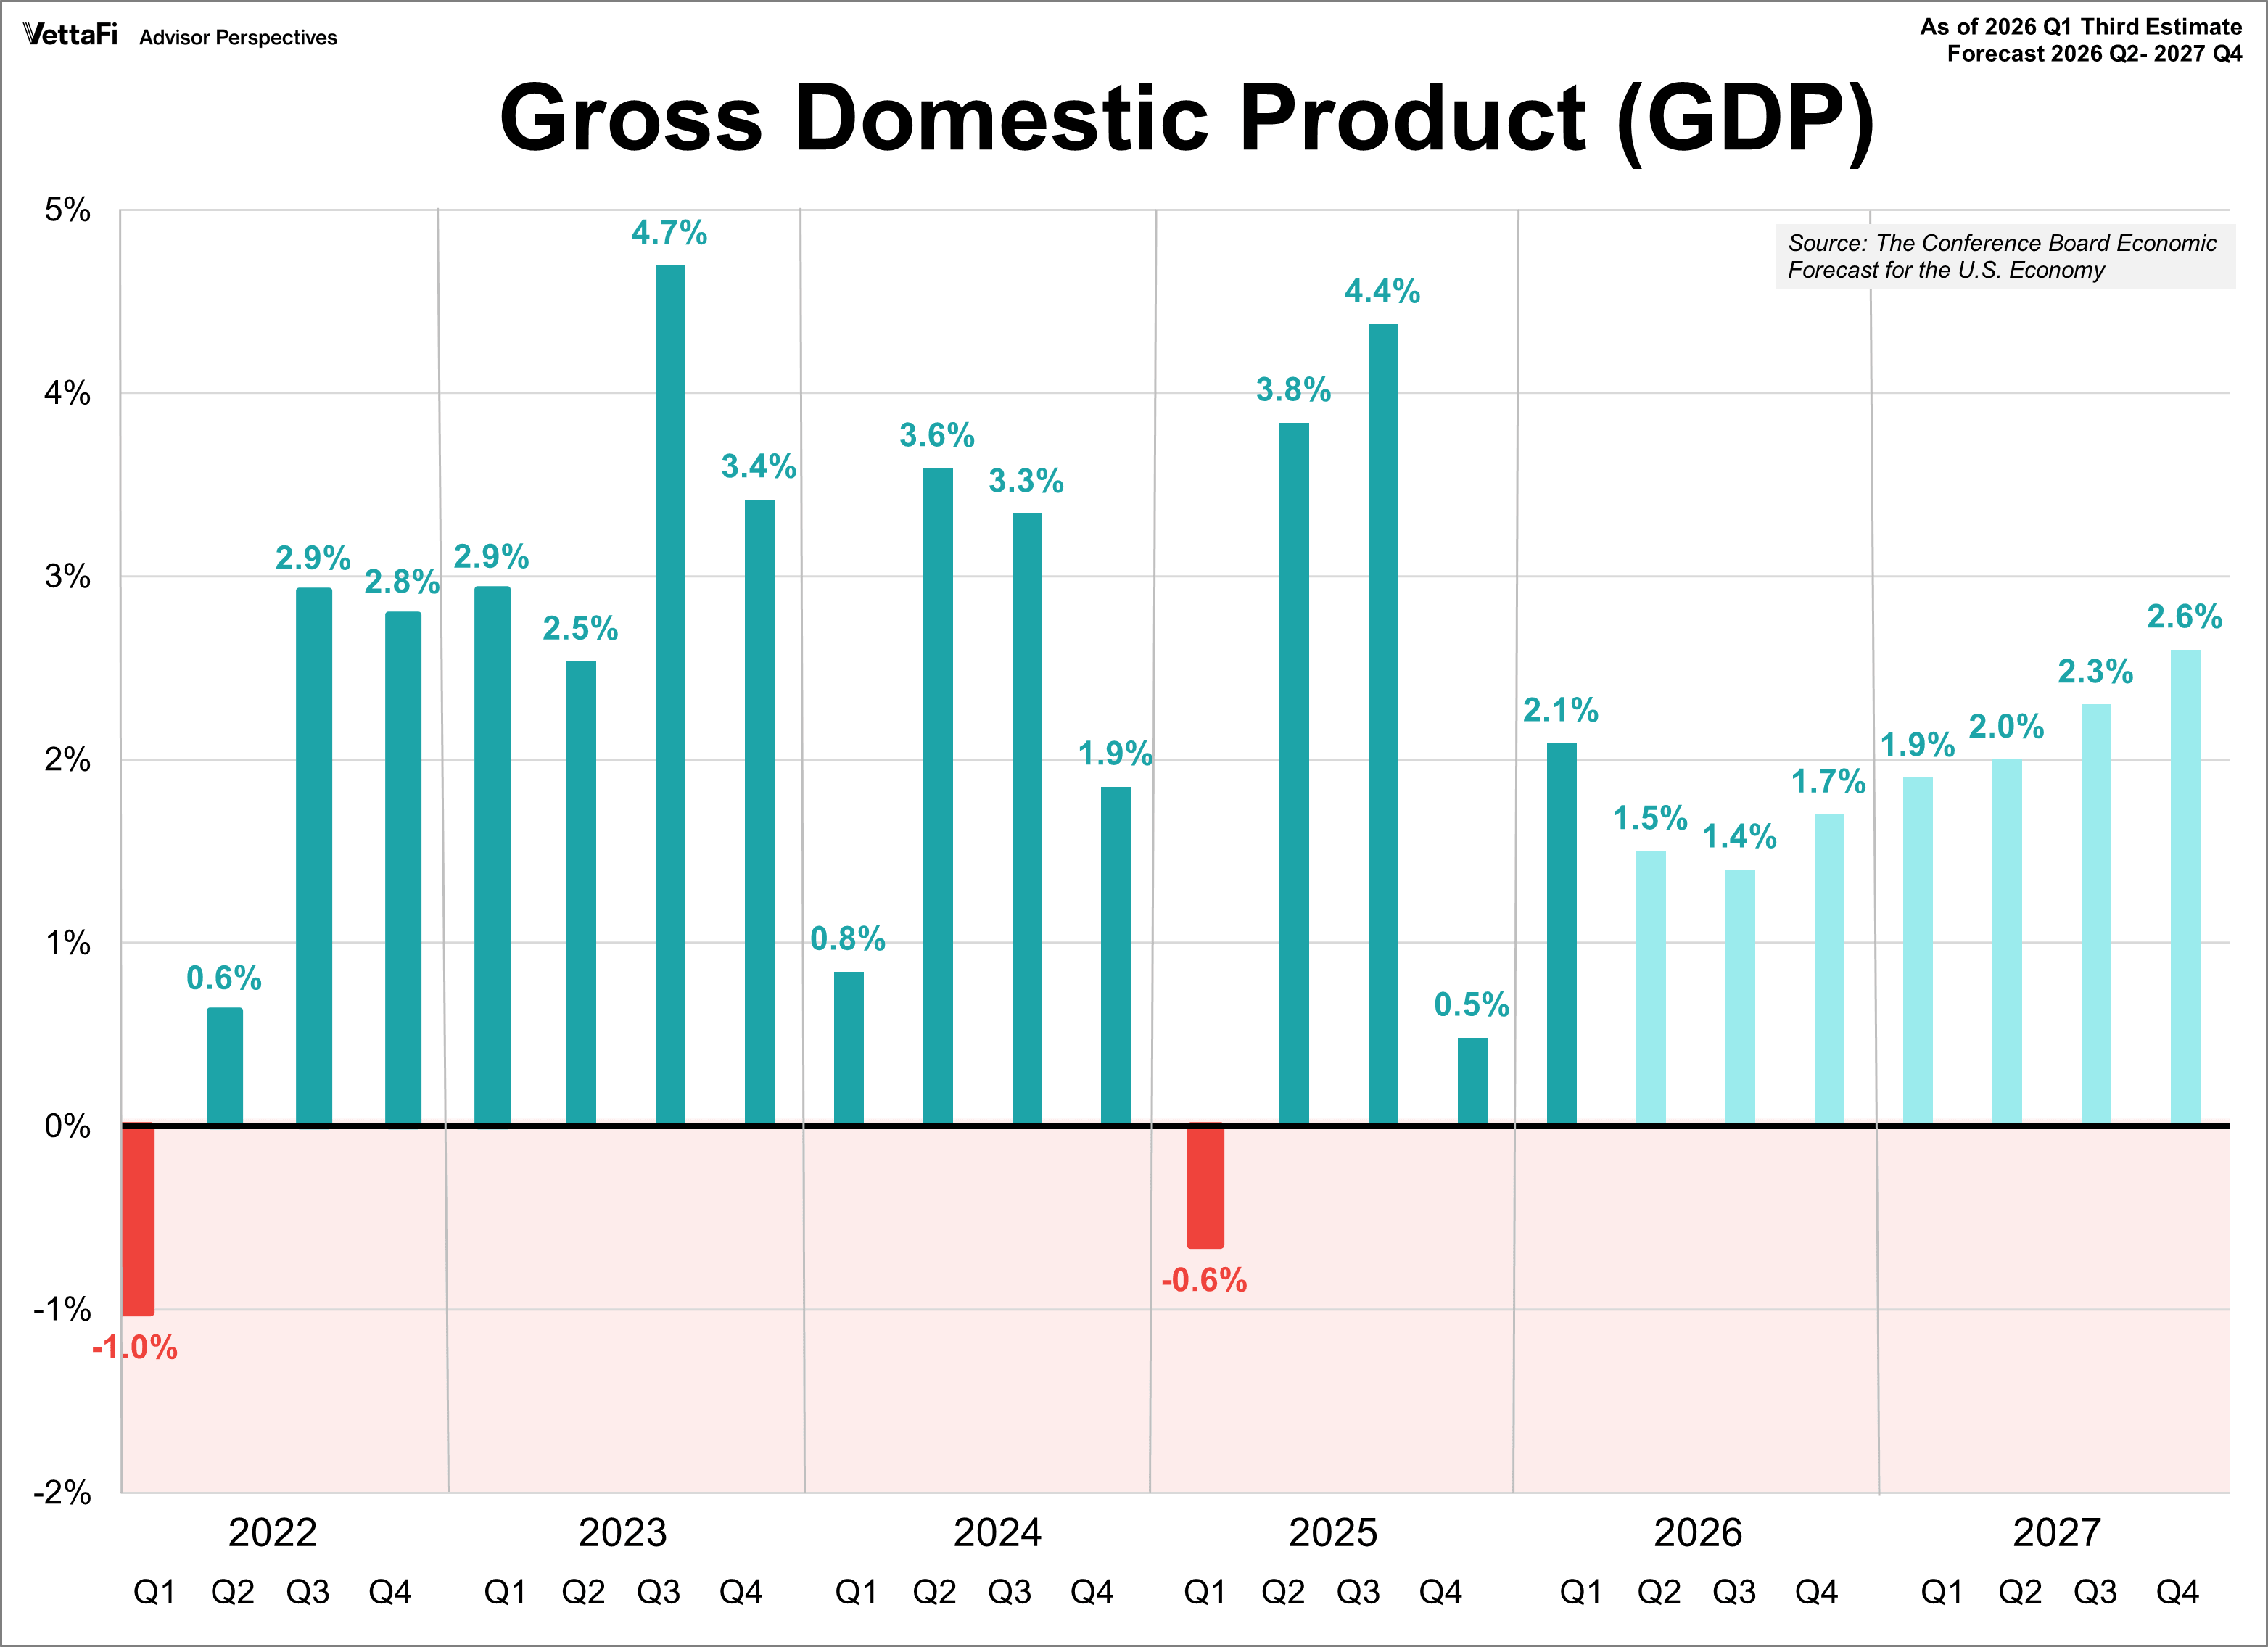
In the chart below, we use the Conference Board's Economic Forecast for the U.S. Economy to visualize GDP forecast over the next few years.
June 11, 2026
U.S. Outlook: Growth Shifts Gears from Consumers to Investment
Consumer spending, the primary engine of U.S. economic growth since the pandemic, is showing increasing signs of fatigue as higher inflation and elevated energy costs erode household purchasing power. Recent declines in real disposable income, weaker inflation-adjusted retail sales, and subdued consumer confidence suggest that growth momentum is slowing even as labor market conditions remain resilient. The war in the Middle East has amplified these pressures through higher oil prices and broader supply-chain effects, reinforcing our expectation that economic growth will moderate in 2026.
Before the start of the war, consumers were already under pressure as 2025 tariffs continued to pass through into retail prices and wage growth normalized from elevated post-pandemic rates. Real consumer spending has slowed materially, as recent data suggest that inflation-adjusted income growth is falling.
An additional tax in the form of higher gasoline prices is likely to intensify these pressures. As fuel expenditures are difficult to reduce in the short run, households typically respond by cutting back on discretionary spending elsewhere.
For a closer look at each of the subcomponents of GDP, check out our commentary An Inside Look at GDP.
For another perspective on GDP, check out our commentary Real GDP Per Capita.
Read more updates by Jen Nash