Inflation surged to its highest level in over three years in May as the headline Consumer Price Index reached 4.2% year-over-year. This marks a sharp acceleration from April's 3.8% reading, and was consistent with the forecast. On a monthly basis, consumer prices rose 0.5%, as expected. The spike was drive by widespread increases across several categories such as energy (+3.9%), shelter (+0.3%), and food (+0.2%).
On a "core basis," which excludes volatile food and energy prices, the data showed more moderation. Core prices rose 2.9% year-over-year as expected, and 0.2% month-over-month, coming in just below the expected 0.3% growth.
Here is the introduction from the BLS summary, which leads with the seasonally adjusted monthly data:
The Consumer Price Index for All Urban Consumers (CPI-U) increased 0.5 percent on a seasonally adjusted basis in May, after rising 0.6 percent in April, the U.S. Bureau of Labor Statistics reported today. Over the last 12 months, the all items index increased 4.2 percent before seasonal adjustment.
The index for energy rose 3.9 percent in May, after rising 3.8 percent in April and 10.9 percent in March. The energy index accounted for over sixty percent of the monthly all items increase. The index for shelter also increased in May, rising 0.3 percent. The food index increased 0.2 percent over the month as the food at home index rose 0.1 percent and the food away from home index increased 0.3 percent.
The index for all items less food and energy rose 0.2 percent in May. Indexes that increased over the month include communication, airline fares, medical care, personal care, and recreation. Conversely, the indexes for motor vehicle insurance, household furnishings and operations, and new vehicles were among the major indexes that decreased in May.
The all items index rose 4.2 percent for the 12 months ending May, after rising 3.8 percent for the 12 months ending April. The all items less food and energy index rose 2.9 percent over the year, following a 2.8-percent increase over the 12 months ending April. The energy index increased 23.5 percent for the 12 months ending May. The food index increased 3.1 percent over the last year.
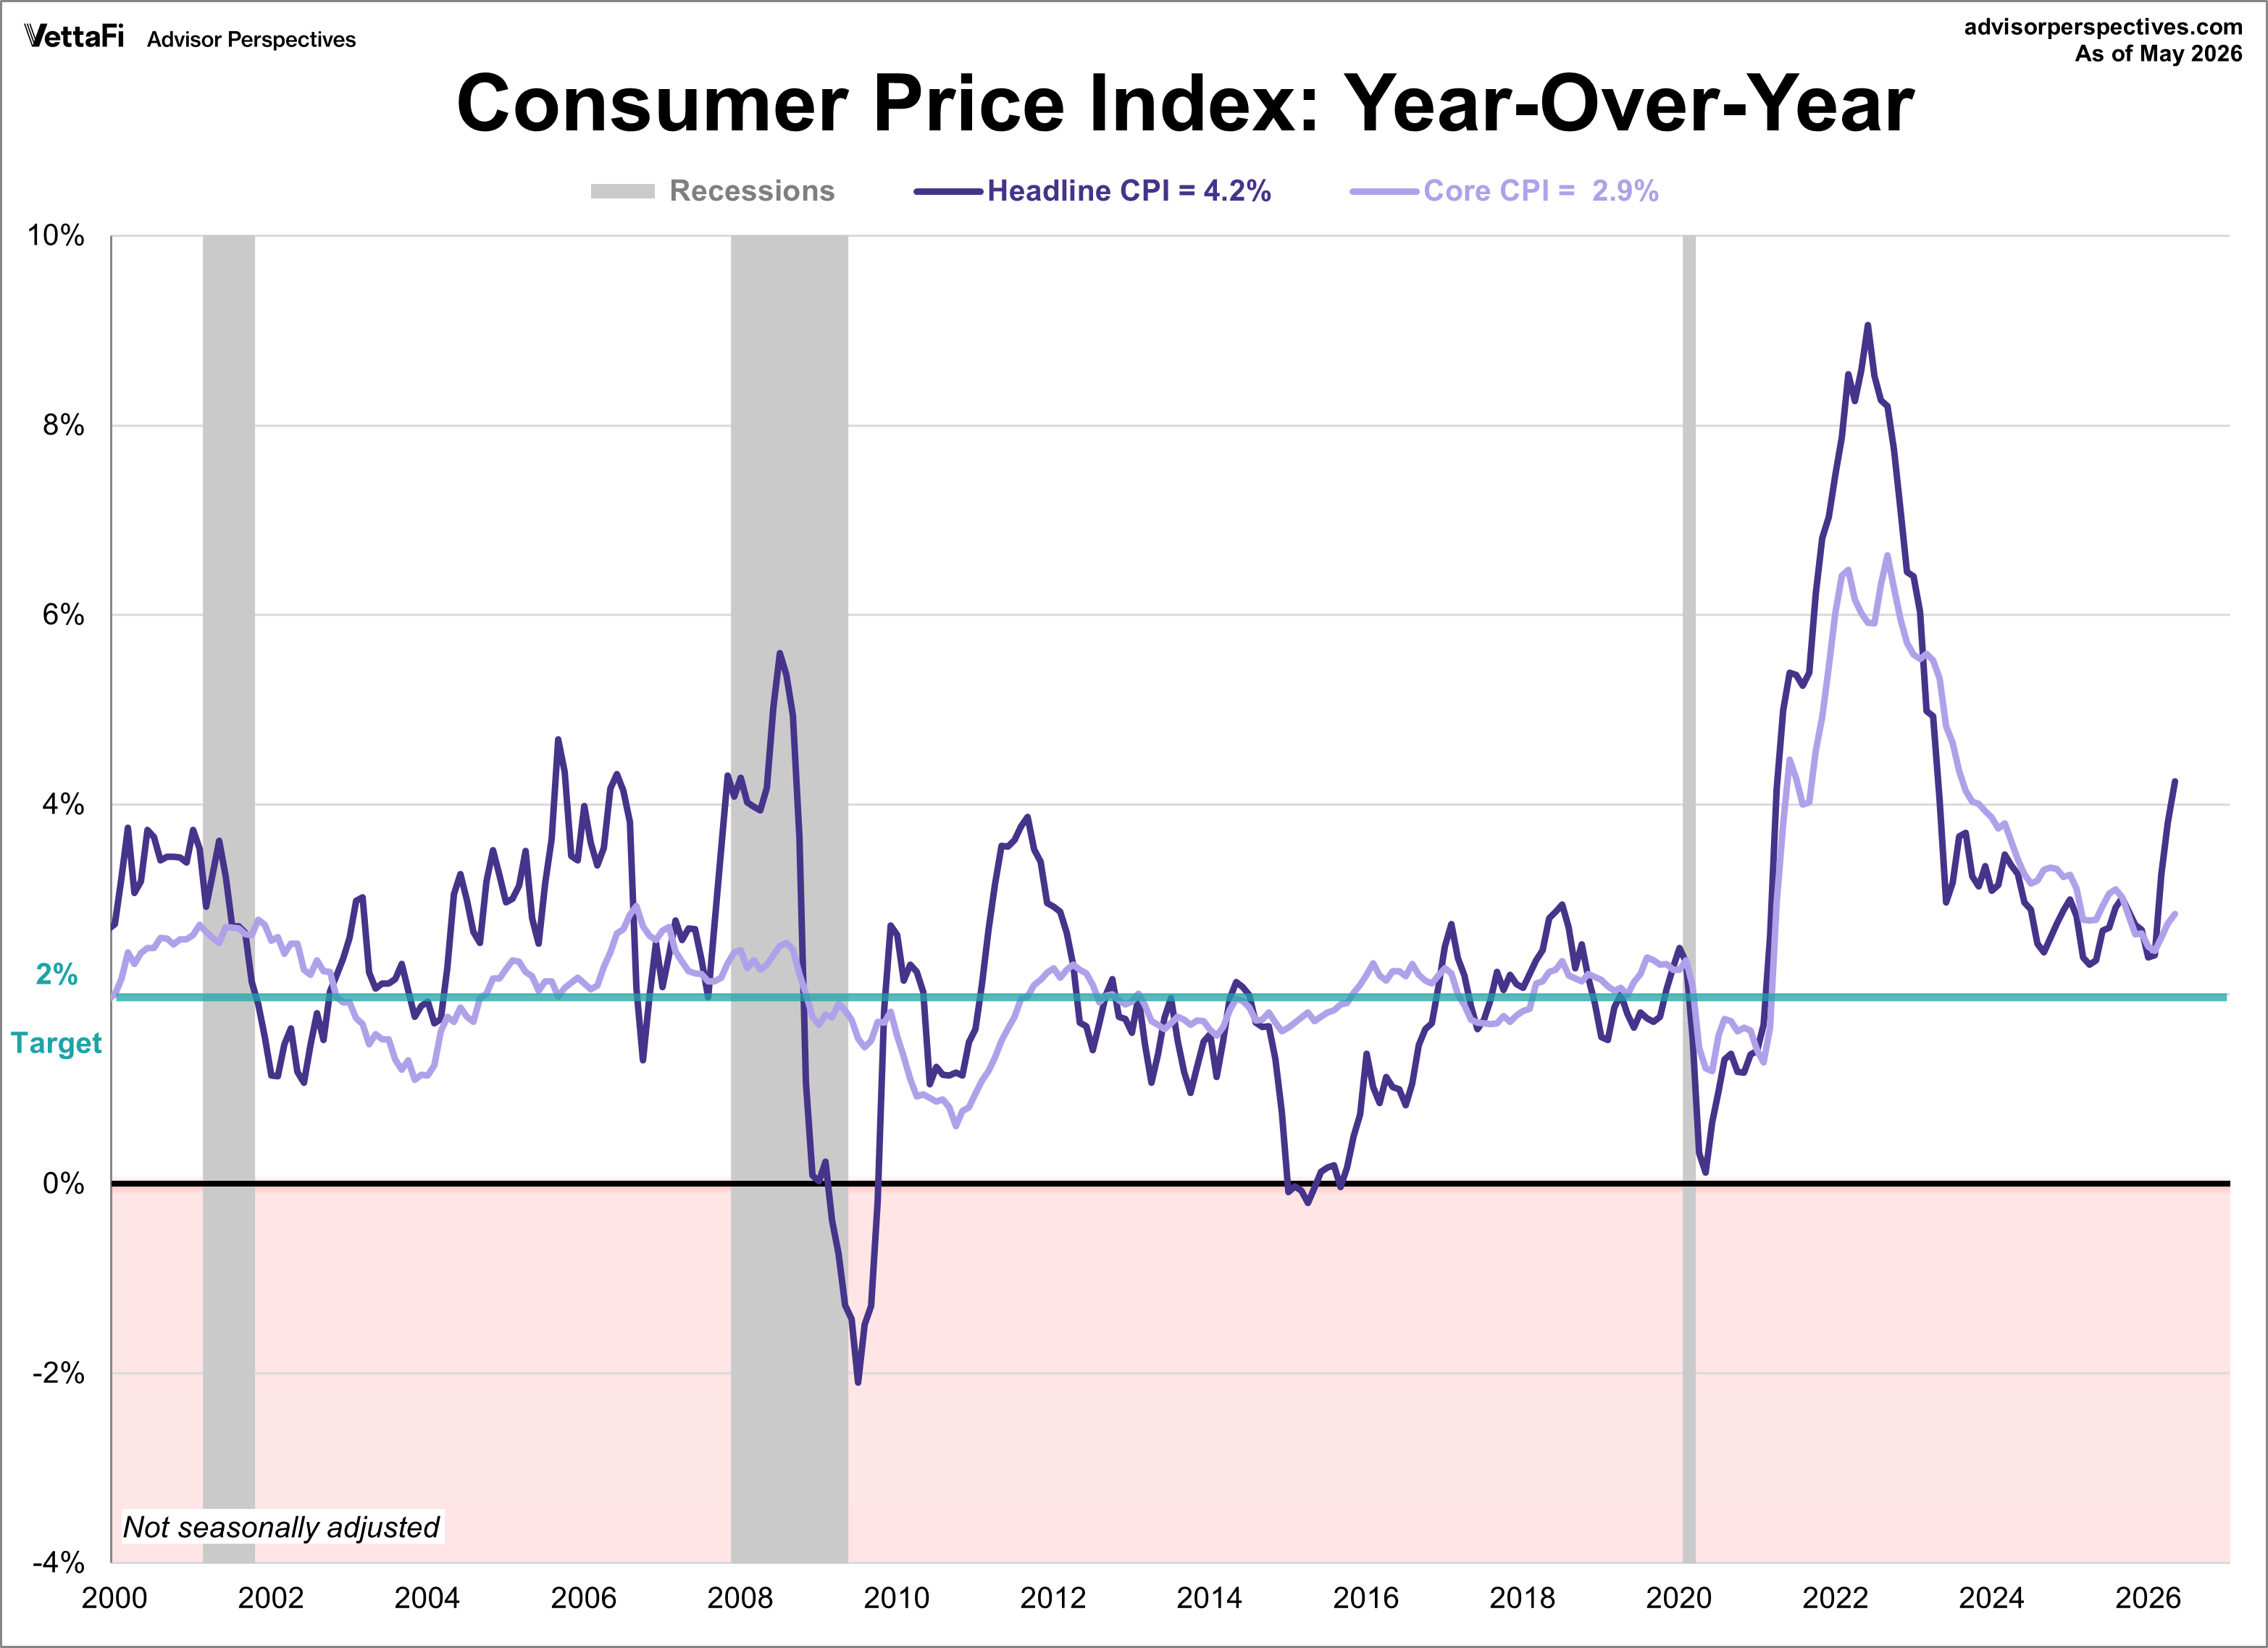
The first chart is an overlay of headline CPI and core CPI since the turn of the century. The highlighted two percent level is the Federal Reserve's target inflation rate. In May, headline prices accelerated from 3.81% in April to 4.25%, the highest level since April 2023. Meanwhile, core price pressures rose more modestly, moving from 2.75% in April to 2.85%, its highest level since September 2025.

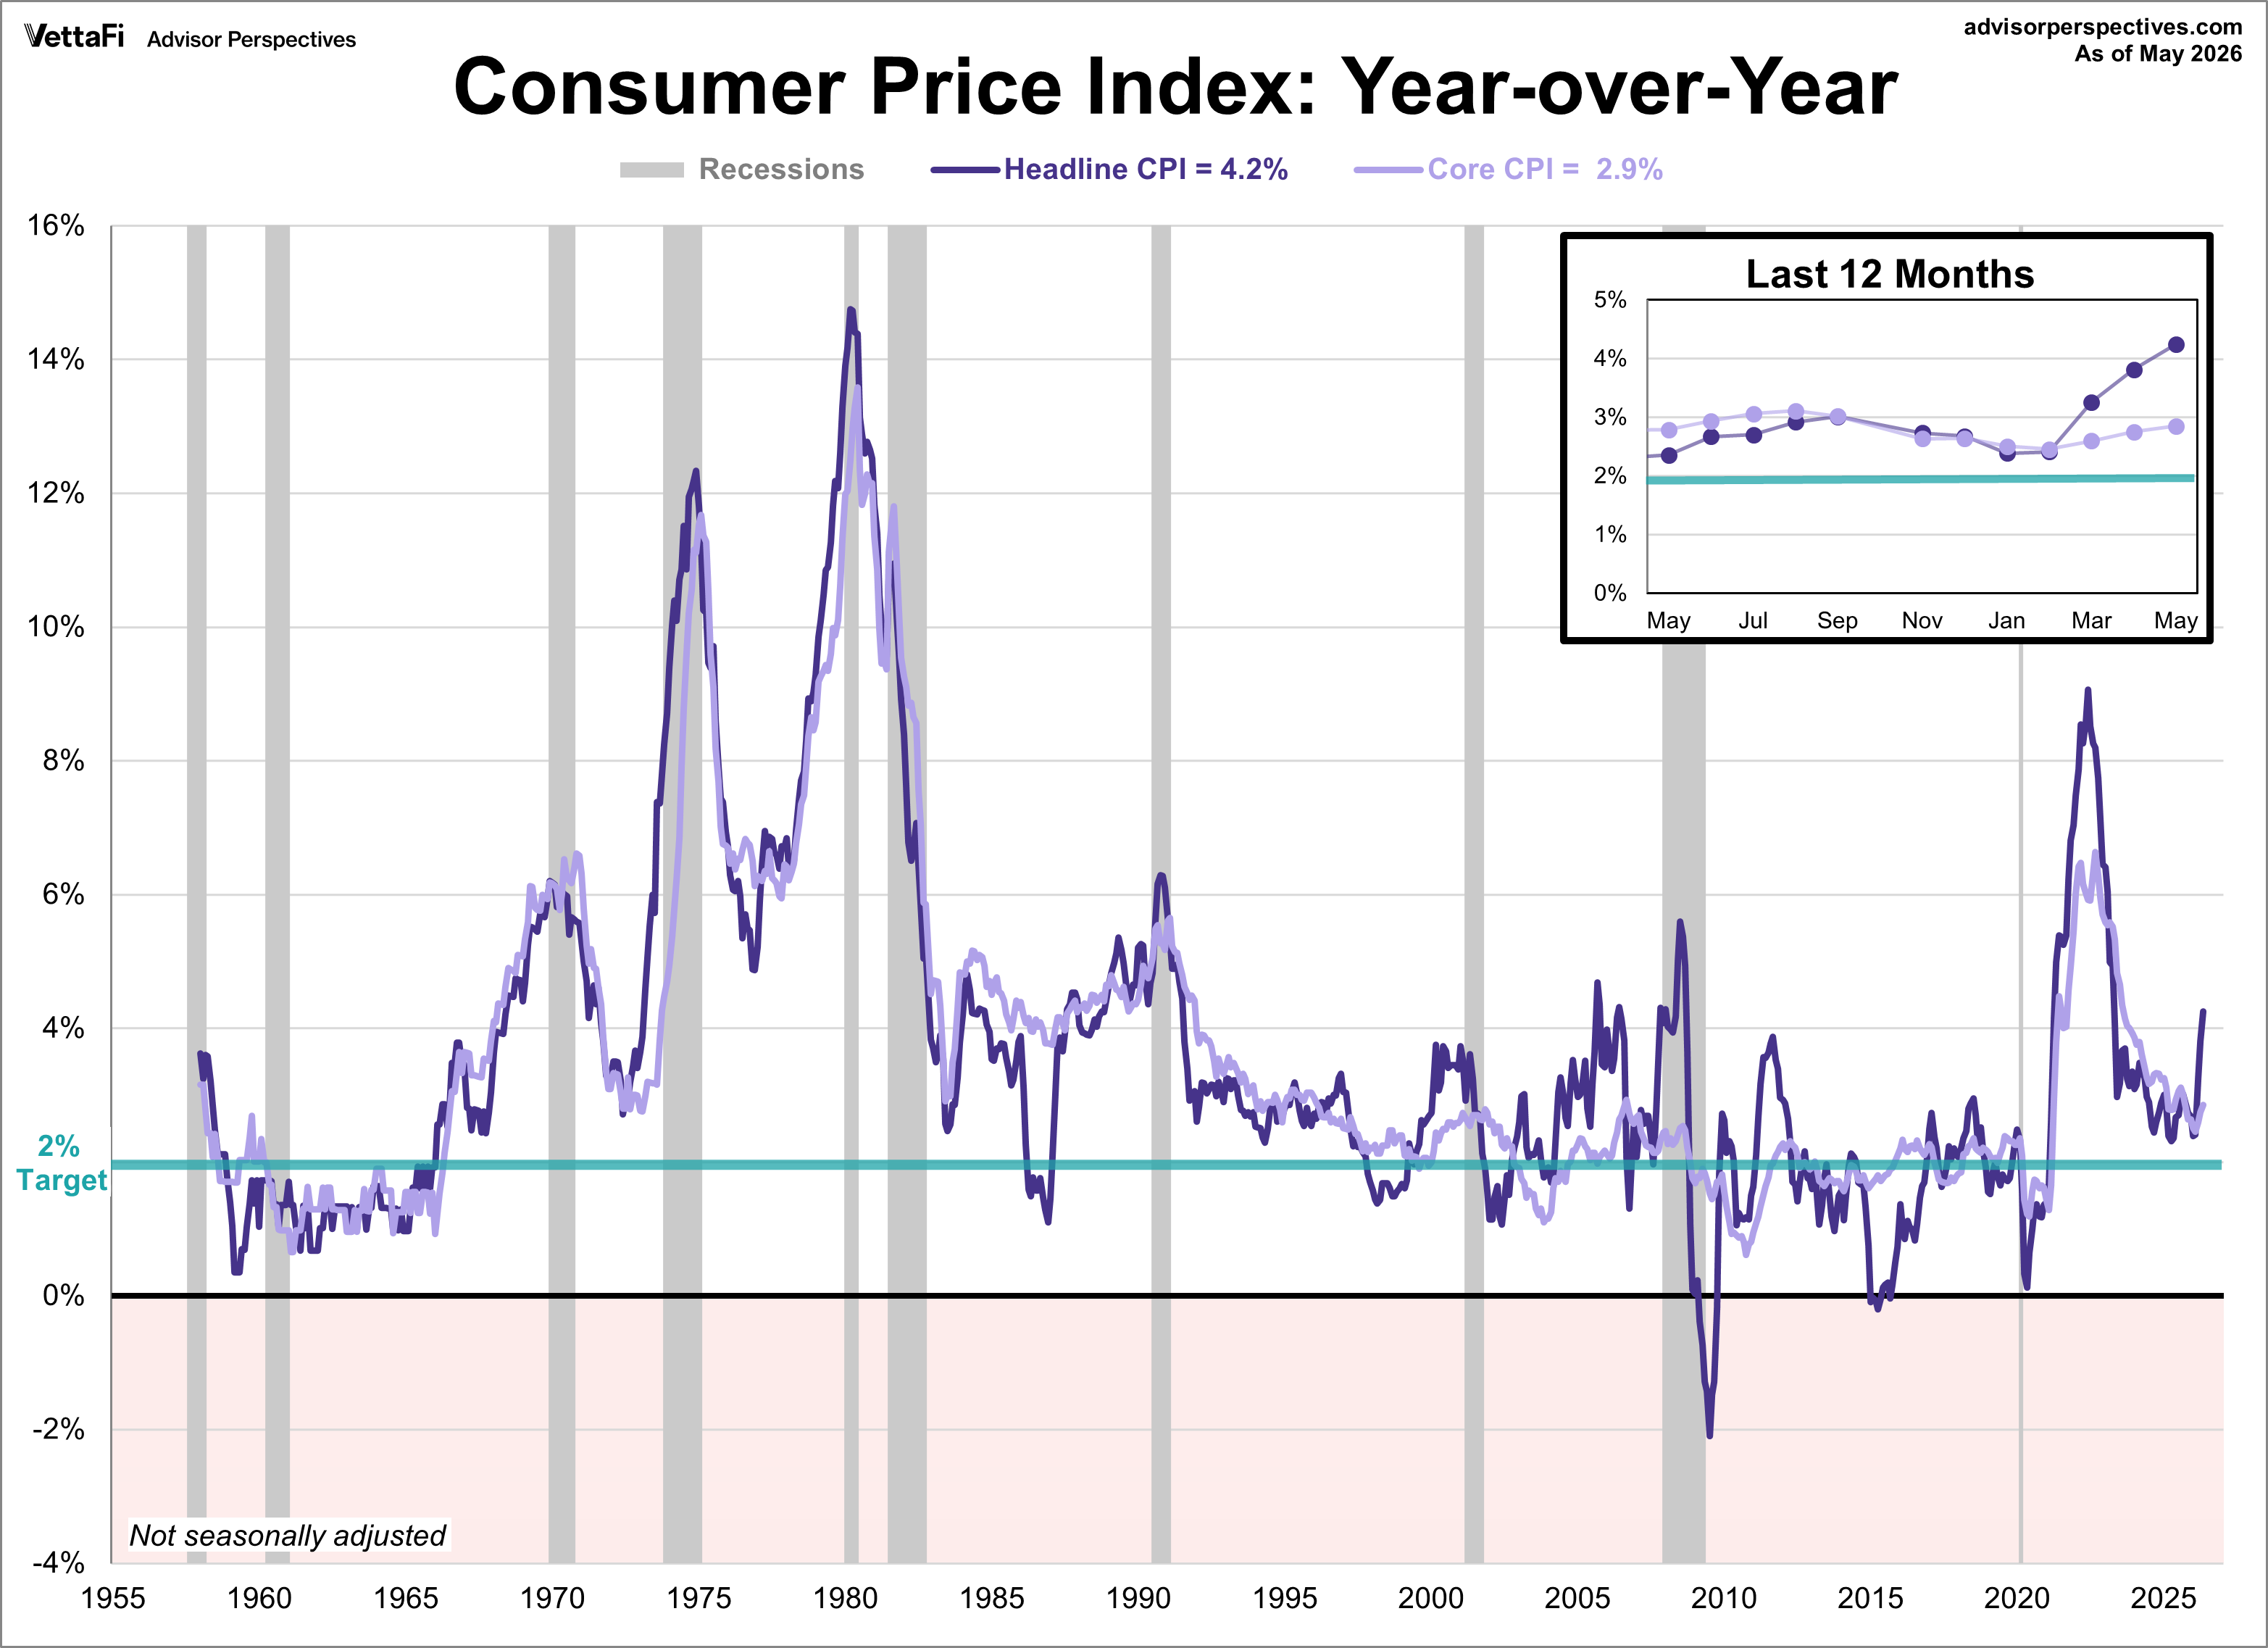
The next chart shows both series since 1957, the year the government first began tracking core inflation.
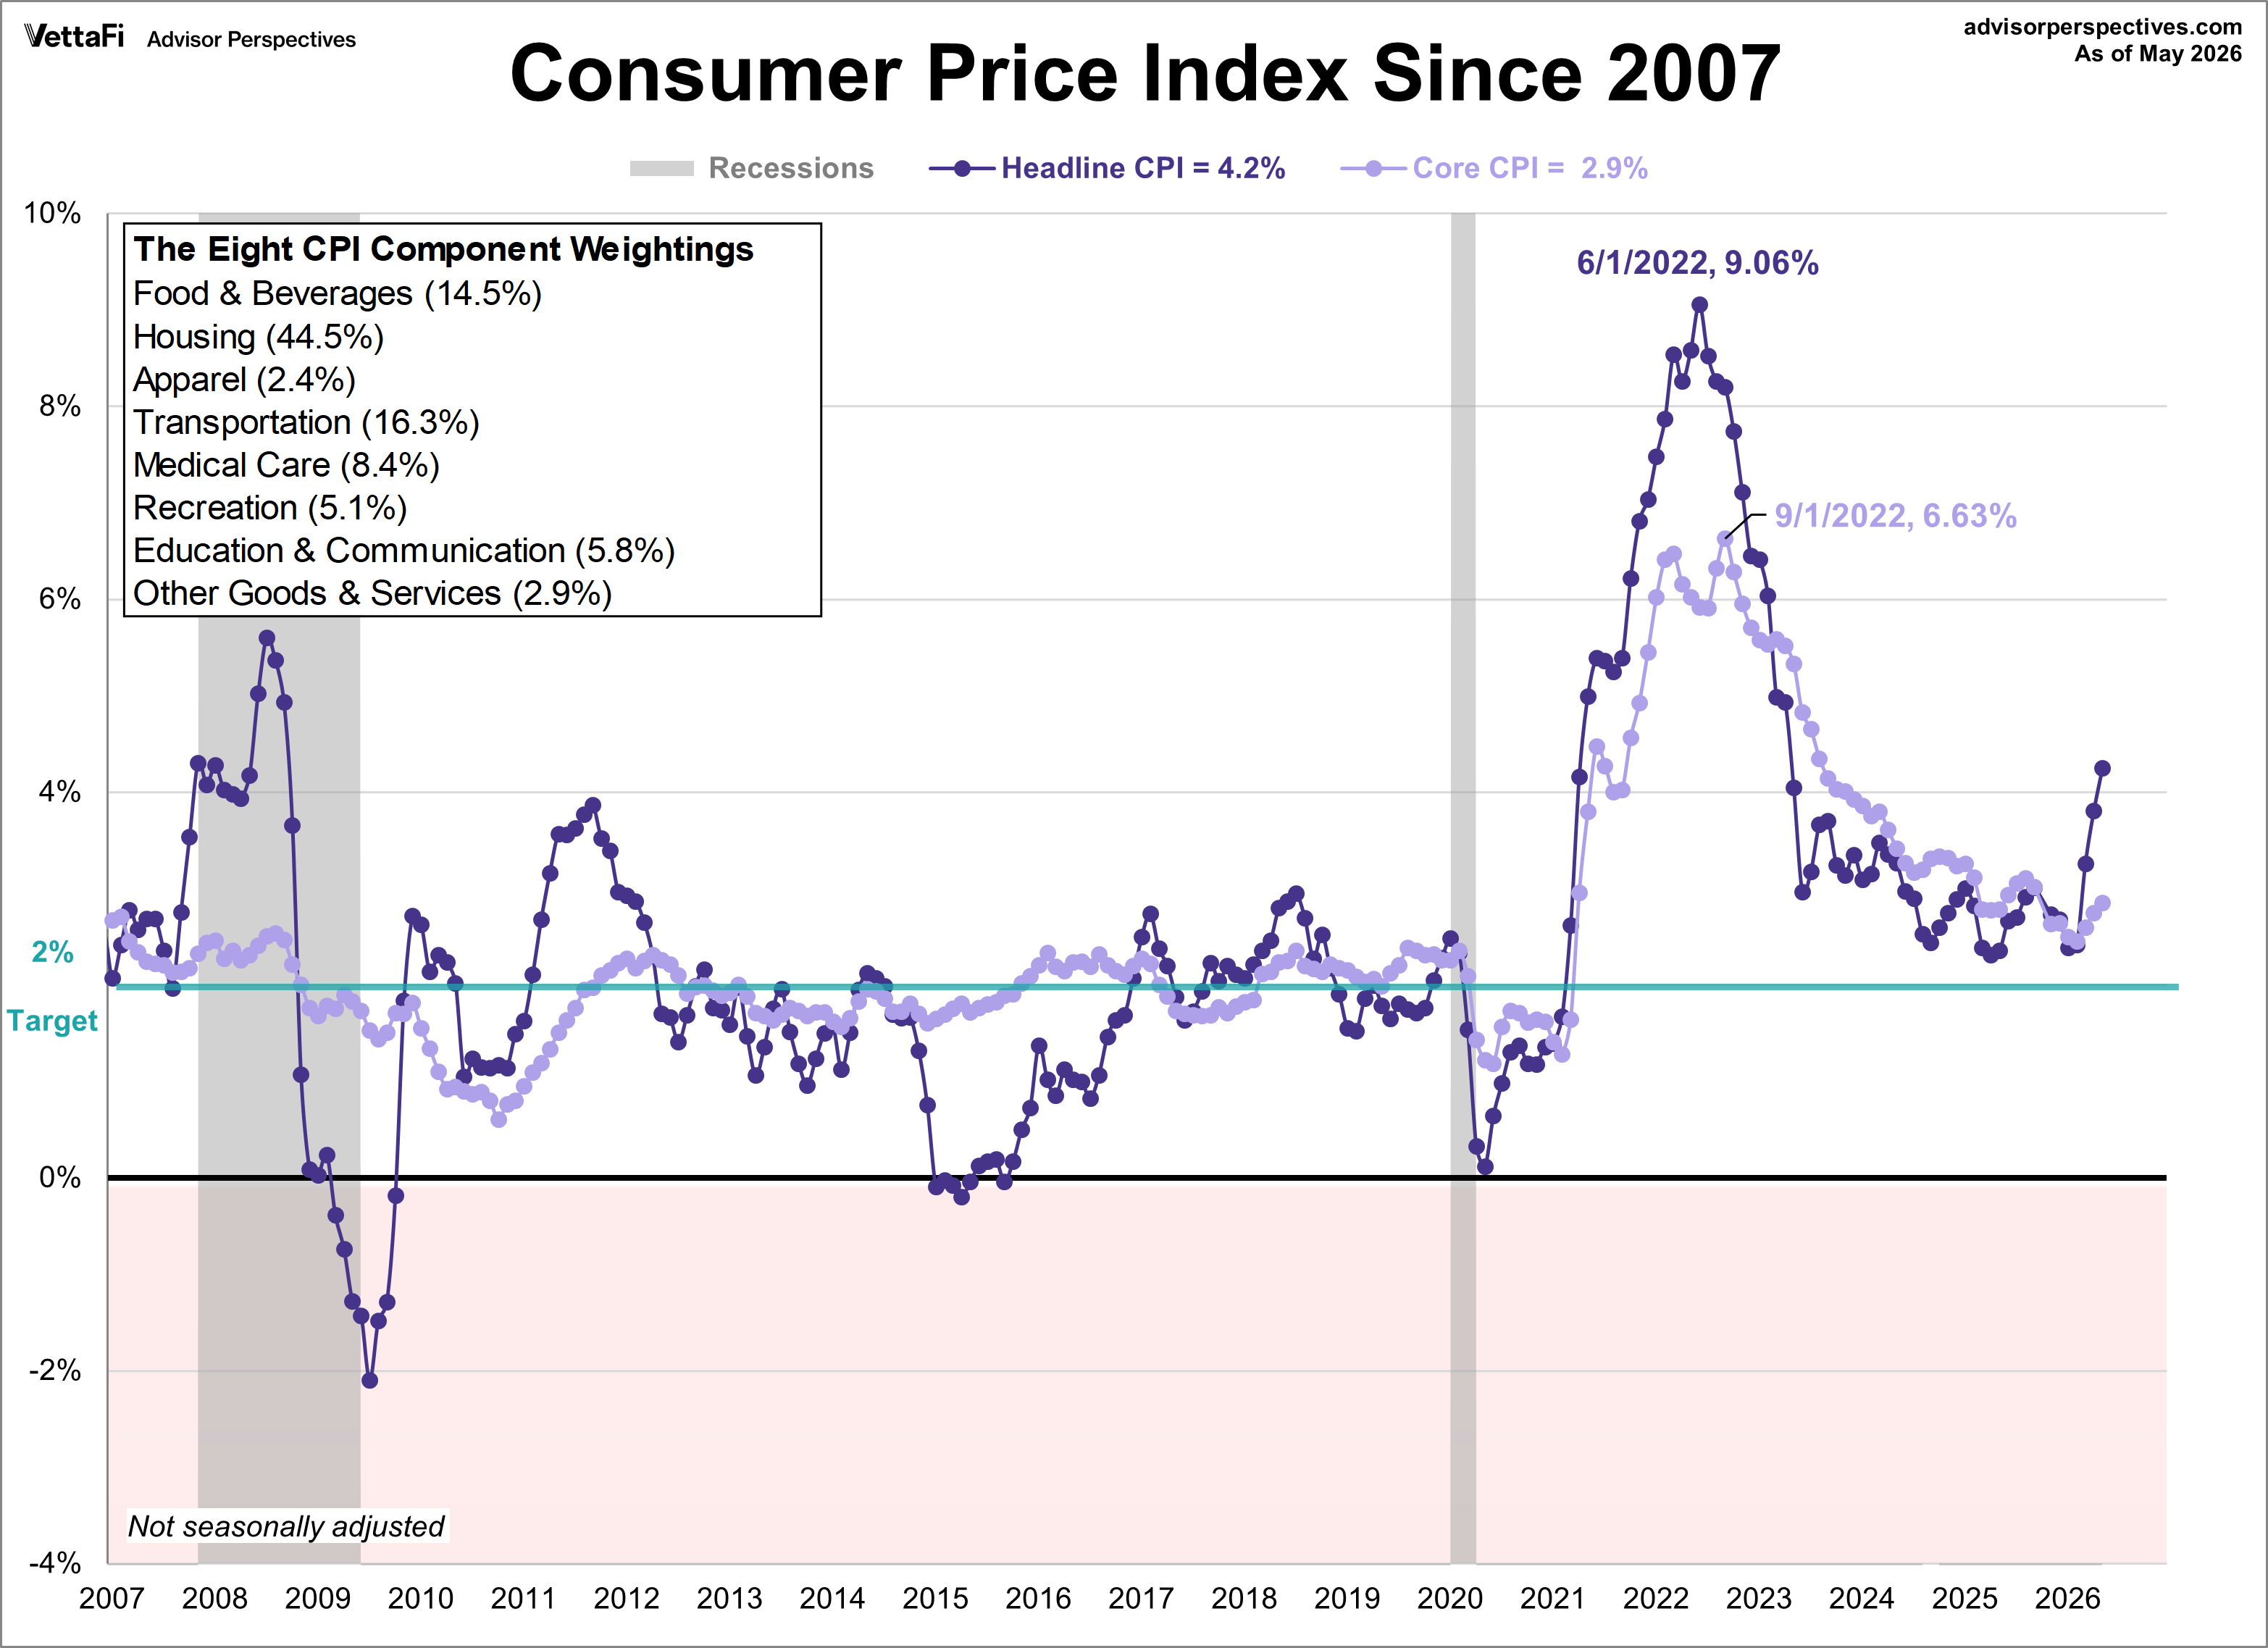
Consumer Price Index Components
The Bureau of Labor Statistics (BLS) divides all expenditures into eight categories and assigns a relative size to each, which is shown in the chart below. The BLS weighs these annually with the latest weighting taking place in December 2025.
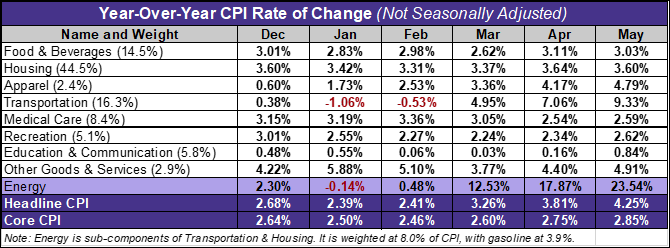
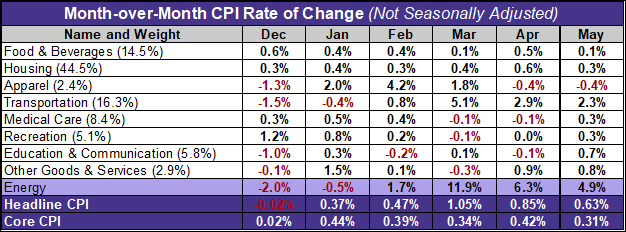
The following table shows the annualized change in Headline and Core CPI (not seasonally adjusted) for each of the past six months. It includes the eight primary components and a separate entry for Energy, a collection of sub-indexes within Housing and Transportation. These breakdowns help illustrate how inflation impacts personal expenses based on individual exposure. For instance, the current volatility in energy and gasoline is clearly reflected in the Transportation component.
Here is the same table as above with month-over-month numbers (not seasonally adjusted).
Note: For additional information on the component composition of the Consumer Price Index, see our Inside the Consumer Price Index.
Inflation: Fed's 2% Target
The Fed is on record as having a target rate of 2% for core inflation. While the Fed traditionally uses the PCE Price Index as their preferred inflation gauge, the Consumer Price Index remains the most widely recognized measure. You can read our full analysis on how these two inflationary measures compare.
The Federal Reserve concluded its third meeting of the year by maintaining the federal funds rate at 3.50%-3.75%. The decision, which markets had fully priced in, keeps the benchmark rate at its lowest level since November 2022 for the third meeting in a row.
In their statement from the meeting, the Committee noted that inflation remains "elevated", specifically pointing to the recent increase in global energy prices but that they remain strongly committed to returning inflation to its 2% objective. However, the recent CPI figures suggest the "last mile" of the inflation fight is proving difficult.
The Fed will meet again next week where they are expected to hold rates steady. At the time of writing, the CMEFedWatch Tool shows a 96% likelihood the Fed will hold rates where they are versus a 4% likelihood of a 25 basis point reduction.