Margin debt increased in August to $1.45 trillion after decreasing last month. This marked a 2.6% increase from July and a 37.2% rise compared to the previous year. When adjusted for inflation, the debt level was up 2.6% month-over-month and was up 33.1% year-over-year.
Key Takeaways
- Margin debt increased 2.6% in August after decreasing last month.
- Margin debt grew 37.2% year-over-year, or 33.1% when adjusted for inflation.
- US investor credit balances reached $1,028.7 billion in August.
What Is Margin Debt? Background and Market Risks
Margin debt is the amount of money an investor borrows from their broker via a margin account. Trading with a margin debt can magnify gains because an investor can benefit from the upside of any stock without having to invest 100%, resulting in greater profit. Conversely, trading with margin debt can also exacerbate losses. If a stock's value depreciates, the investor may face a margin call requiring additional cash to reach the minimum equity requirements.
Margin debt is often seen as a measure of investor sentiment and risk appetite. High levels of margin debt can signal confidence, but extreme spikes may also indicate excessive speculation, increasing the risk of market instability.
Note: Video data is through May 2025
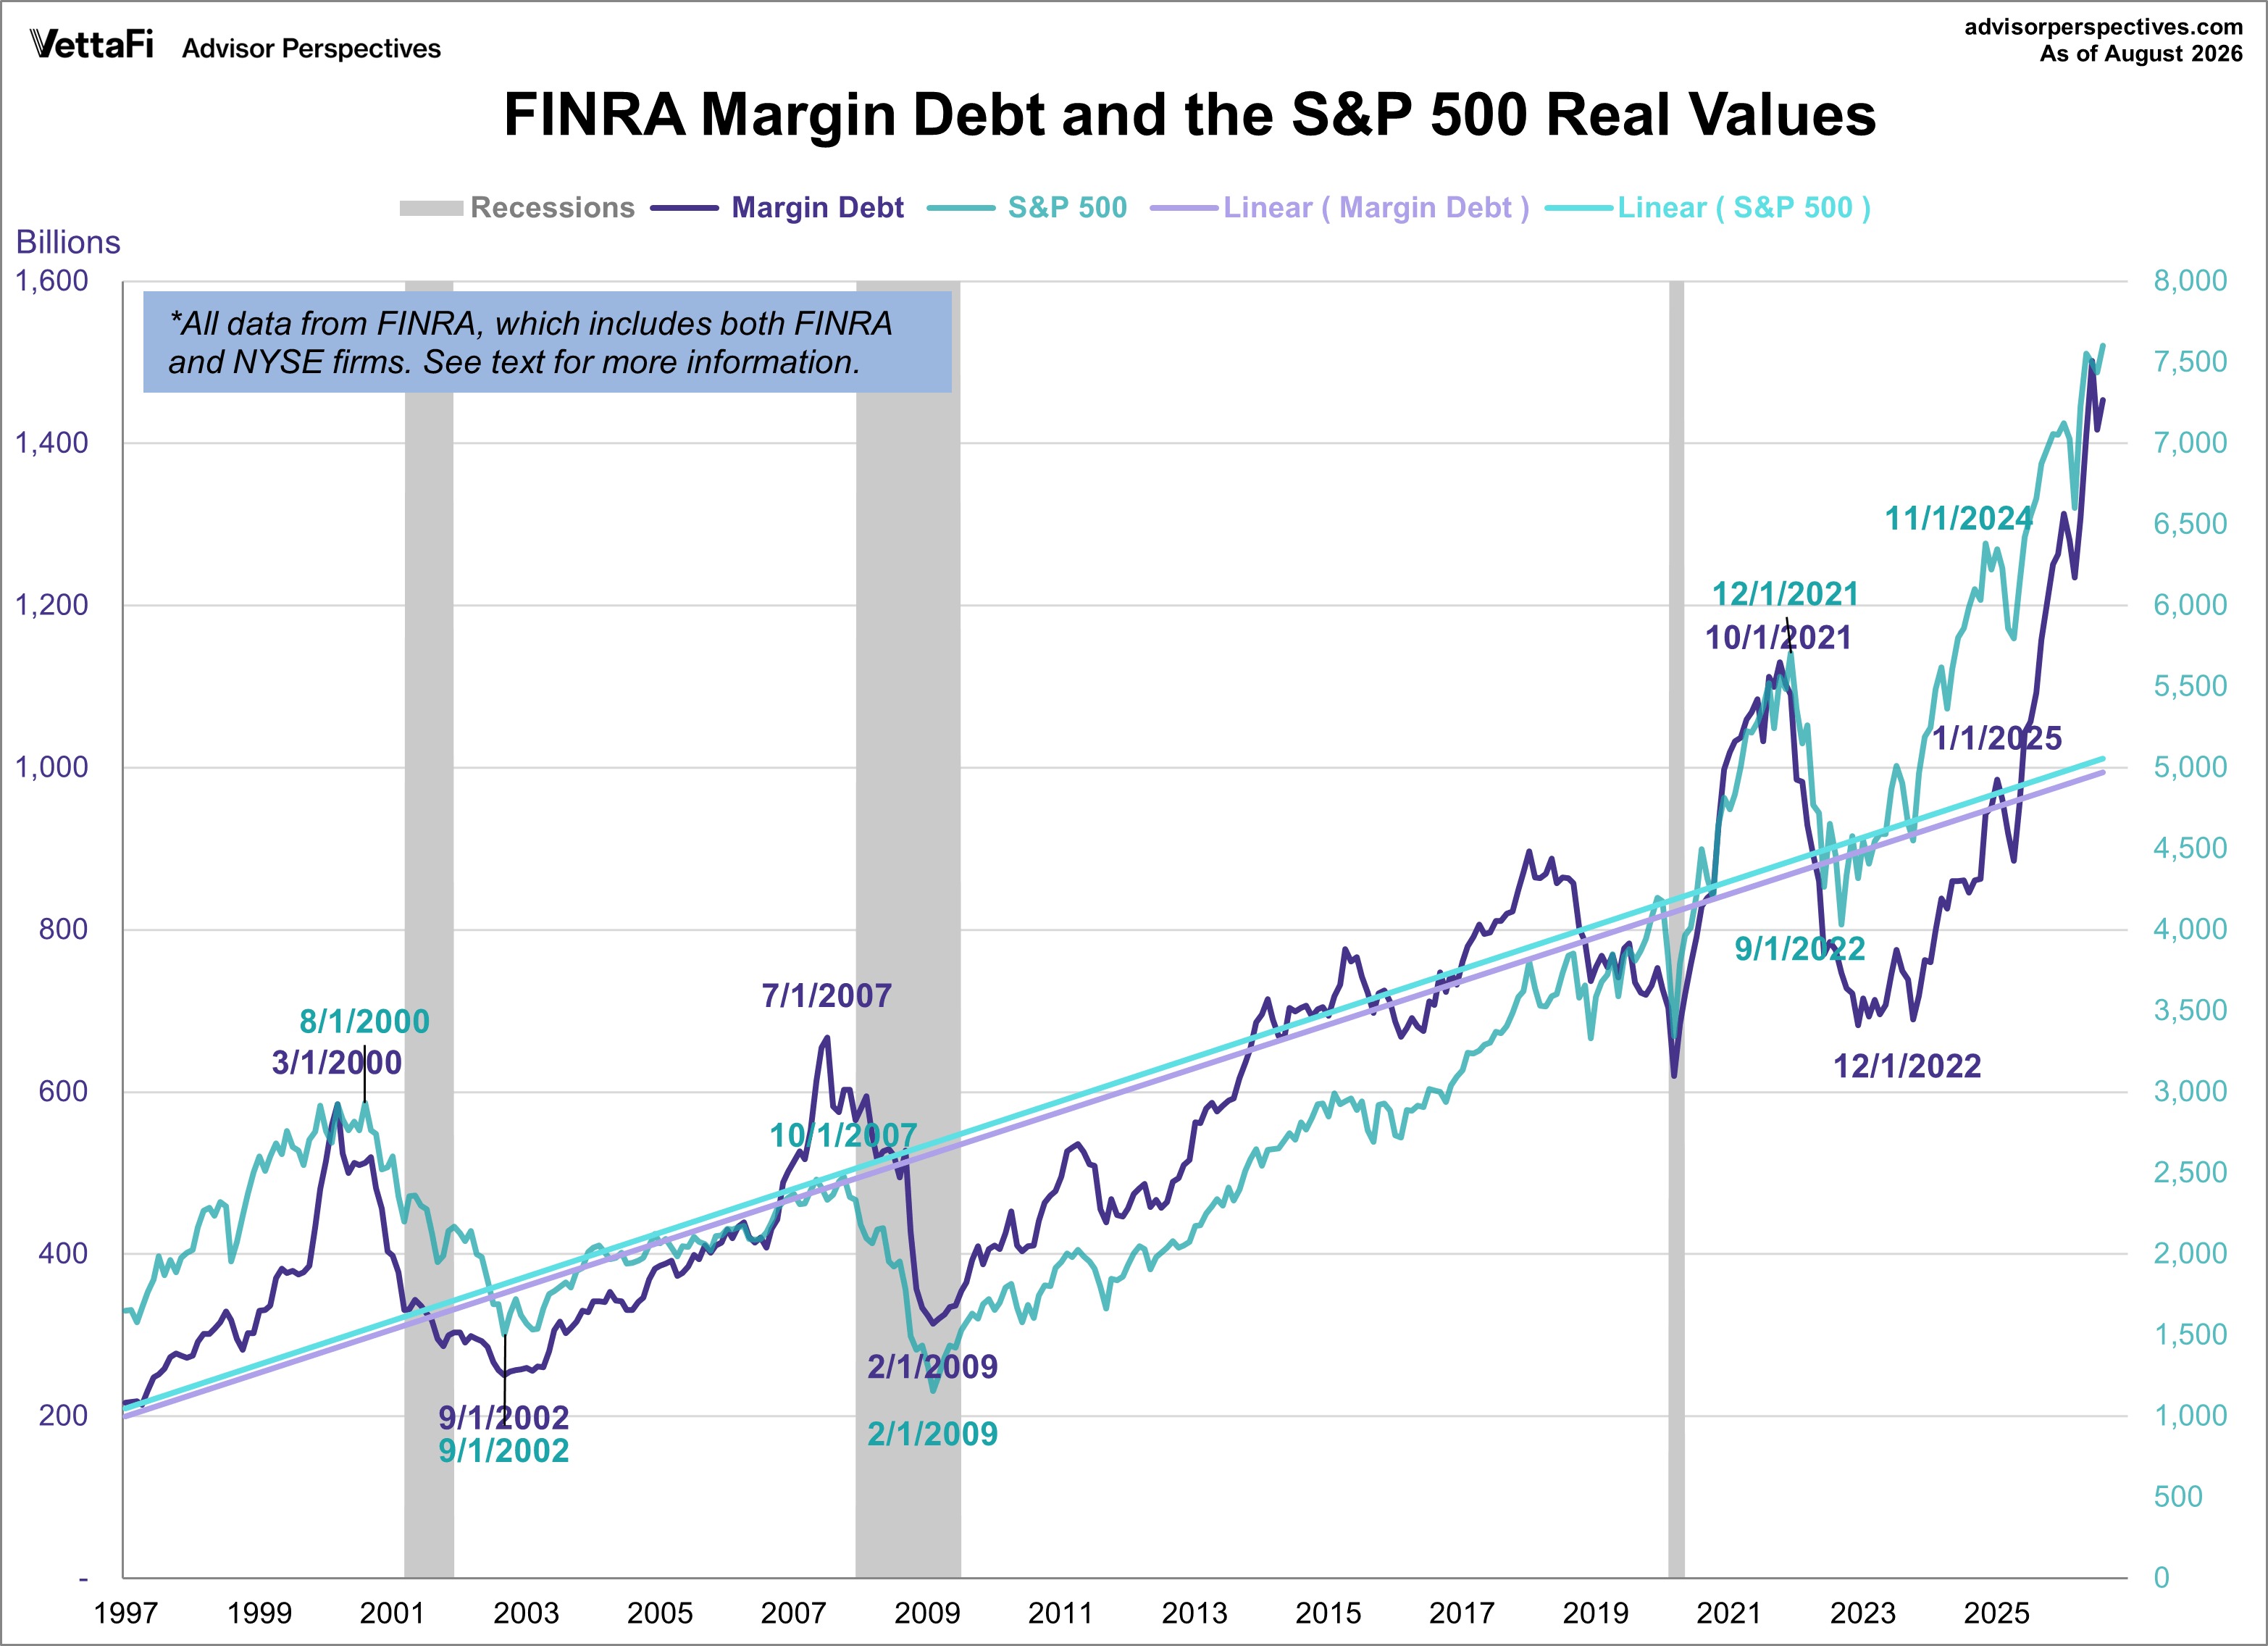
Let's take a closer look at the relationship between margin debt and the stock market, using the S&P 500 as our benchmark. The first chart shows the two series in real terms — adjusted for inflation to today's dollar using the Consumer Price Index (CPI) as the deflator.

Starting in 1997, a period well into the long-running bull market that began in 1982 and nearing the tech bubble, we can observe some interesting patterns:
-
Late 1999 - March 2000: Margin debt experienced a dramatic increase, peaking in March 2000. This coincided with an interim daily high for the S&P 500, although the market's highest monthly close for that year occurred later in August.
-
2006 - July 2007: Another significant surge in margin debt began in 2006, reaching its peak in July 2007, just three months before the S&P 500 reached its peak.
-
February 2009: Following the financial crisis, margin debt hit a low point in February 2009, the same month the stock market bottomed out. Subsequently, margin debt began another substantial period of growth.
-
Post-COVID Pandemic (October 2021 - December 2022): We saw a similar pattern after the initial COVID-19 pandemic. Margin debt soared to a high in October 2021, just two months before the S&P 500 reached its peak in December 2021. The market then bottomed in September 2022, and margin debt followed suit, reaching its most recent low in December 2022.
-
Now: Margin debt increased in August after falling last month. Meanwhile, the S&P 500 was up 2.2% in August and is currently below its nominal and real peaks from May 2025.
By examining these periods, we can observe a potential relationship between significant increases in margin debt and subsequent market peaks, as well as a correlation between market bottoms and troughs in margin debt.
Note on the data: FINRA only posts the free credit cash accounts data back to 1997. The free credit cash accounts data back to 1980 is available on a fee basis from Haver Analytics.
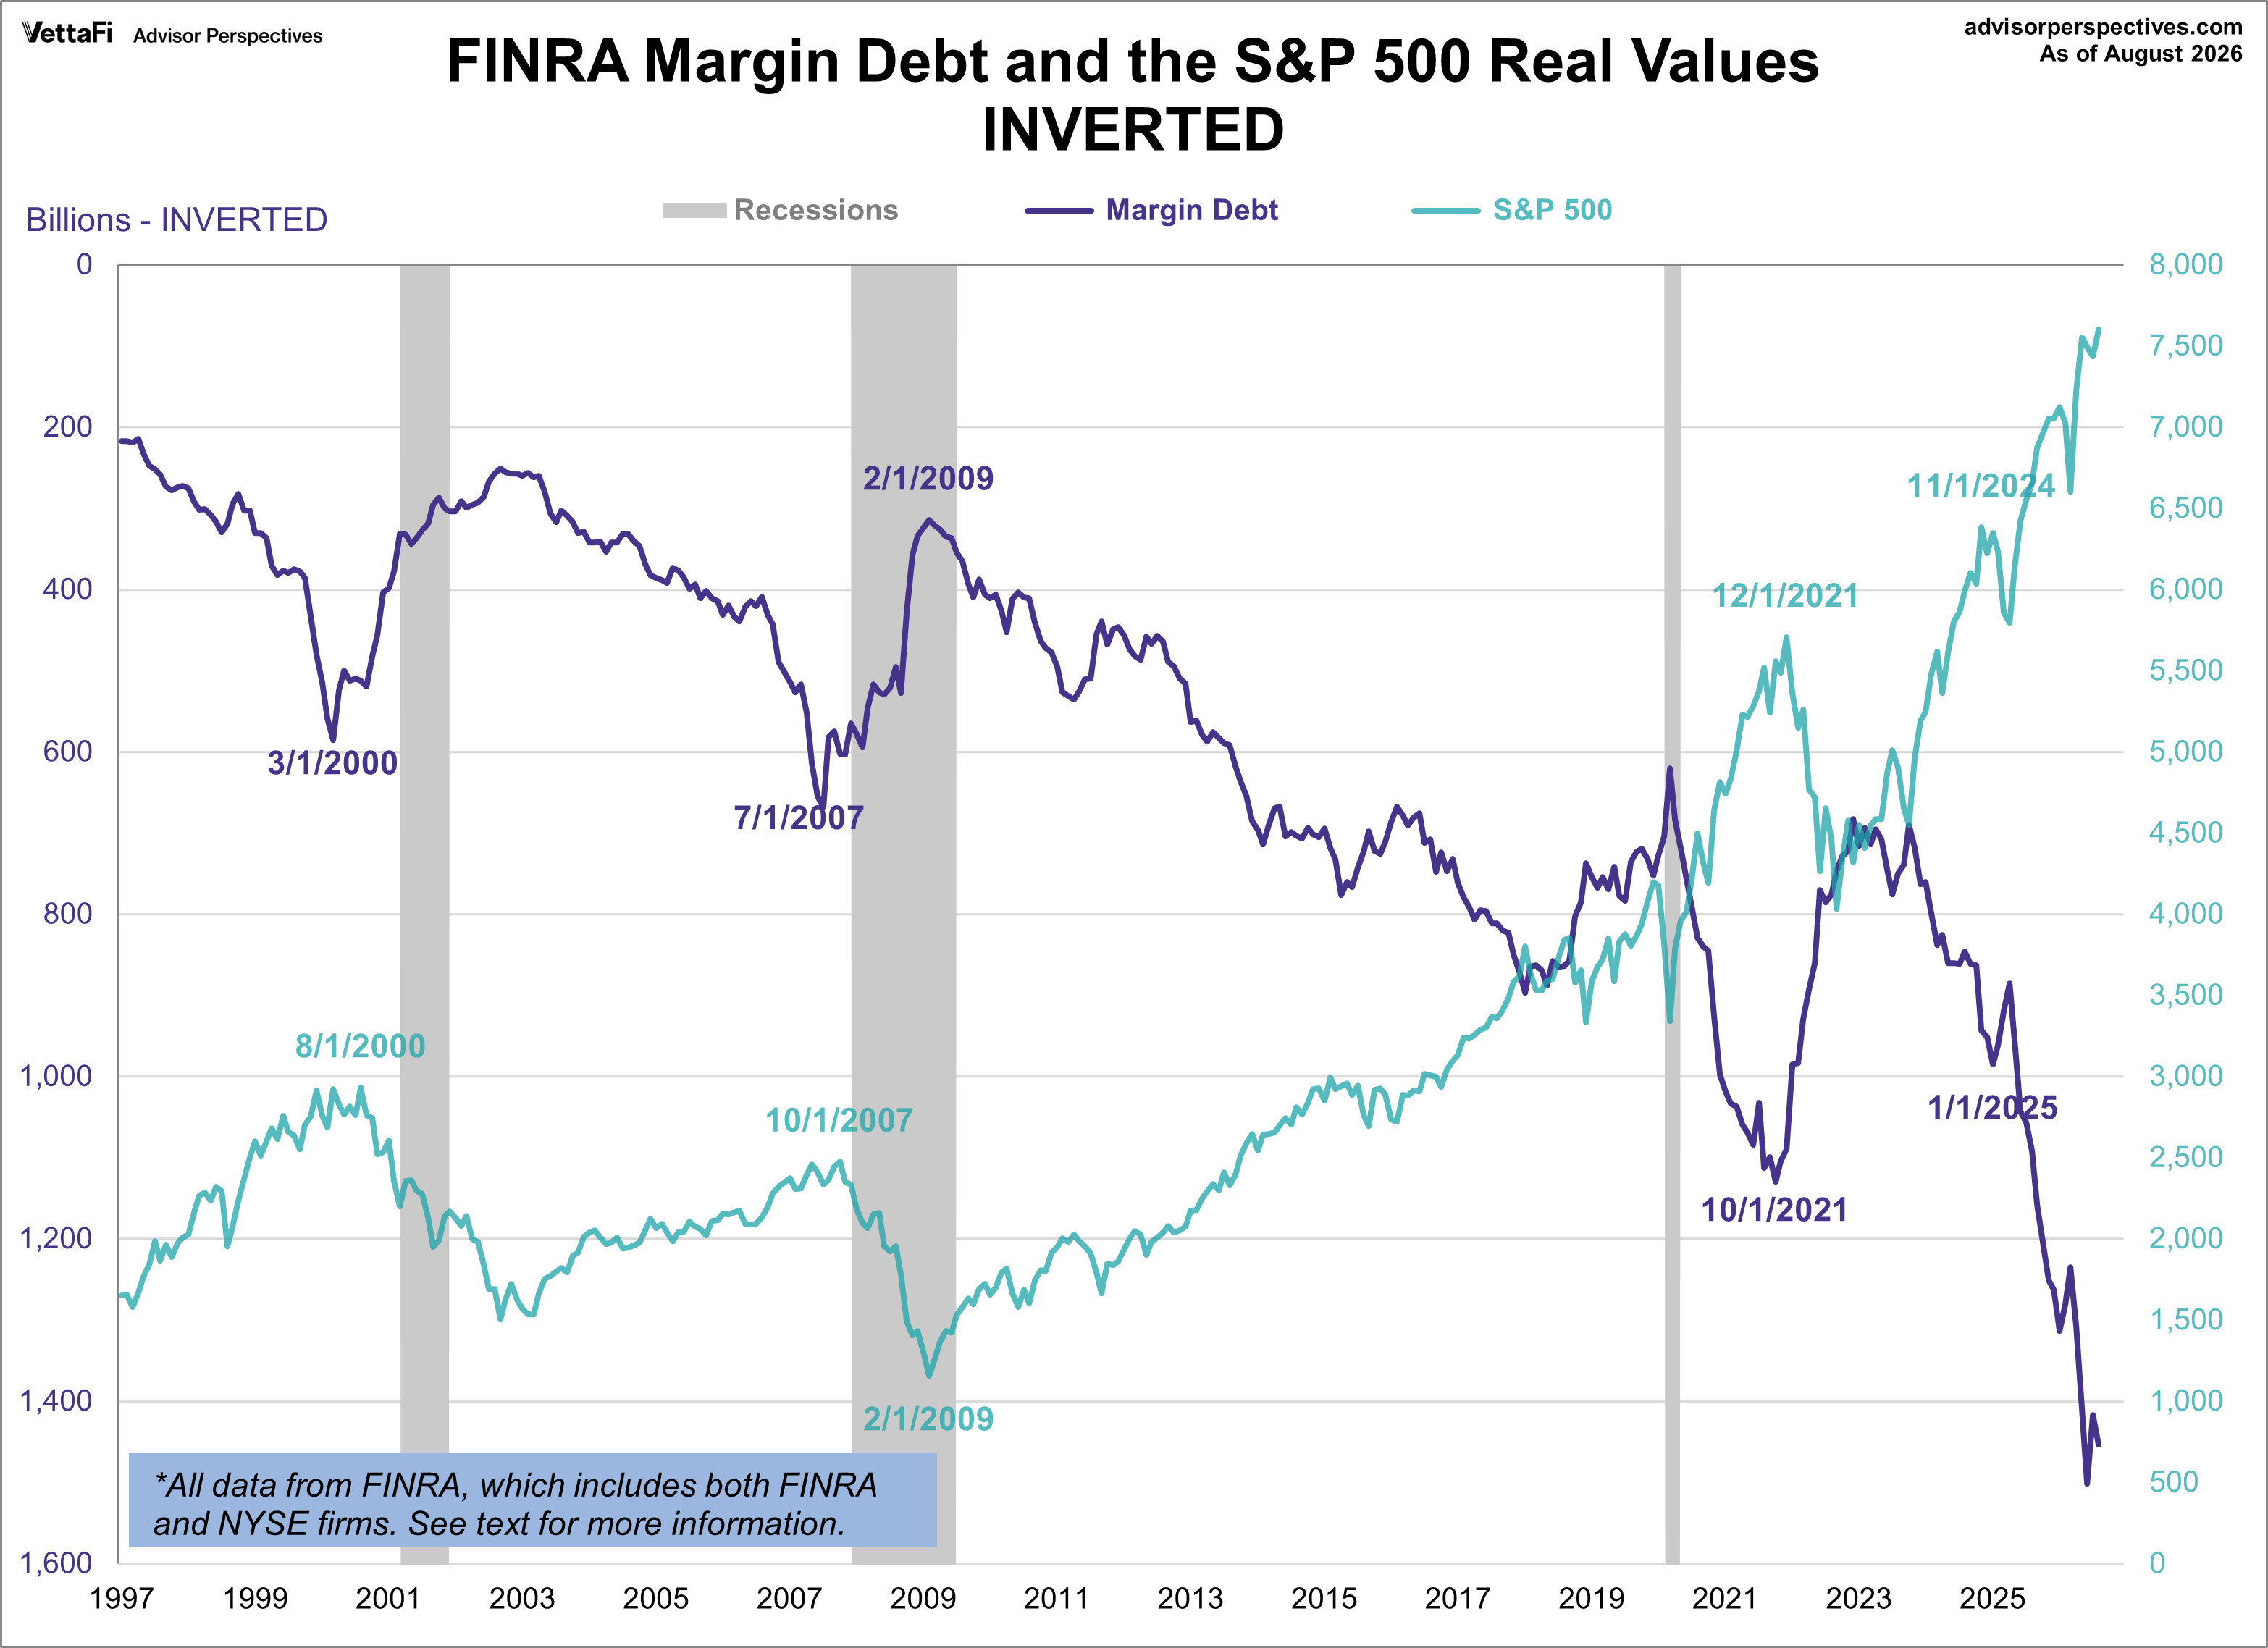
At the suggestion of Mark Schofield, managing director at Strategic Value Capital Management, LLC, I've created the same chart with margin debt inverted so that we see the relationship between the two as a divergence.
Because this chart is flipped, a sharp drop in the purple line (margin debt) signals a massive increase in leverage. This divergence occurs when investors are borrowing aggressively. Conversely, when the line shoots upward, that is the period of deleverage or forced selling and the two lines converge.
We are currently sitting at an historic extreme, meaning the gap between what people own and what they owe has never been this wide.
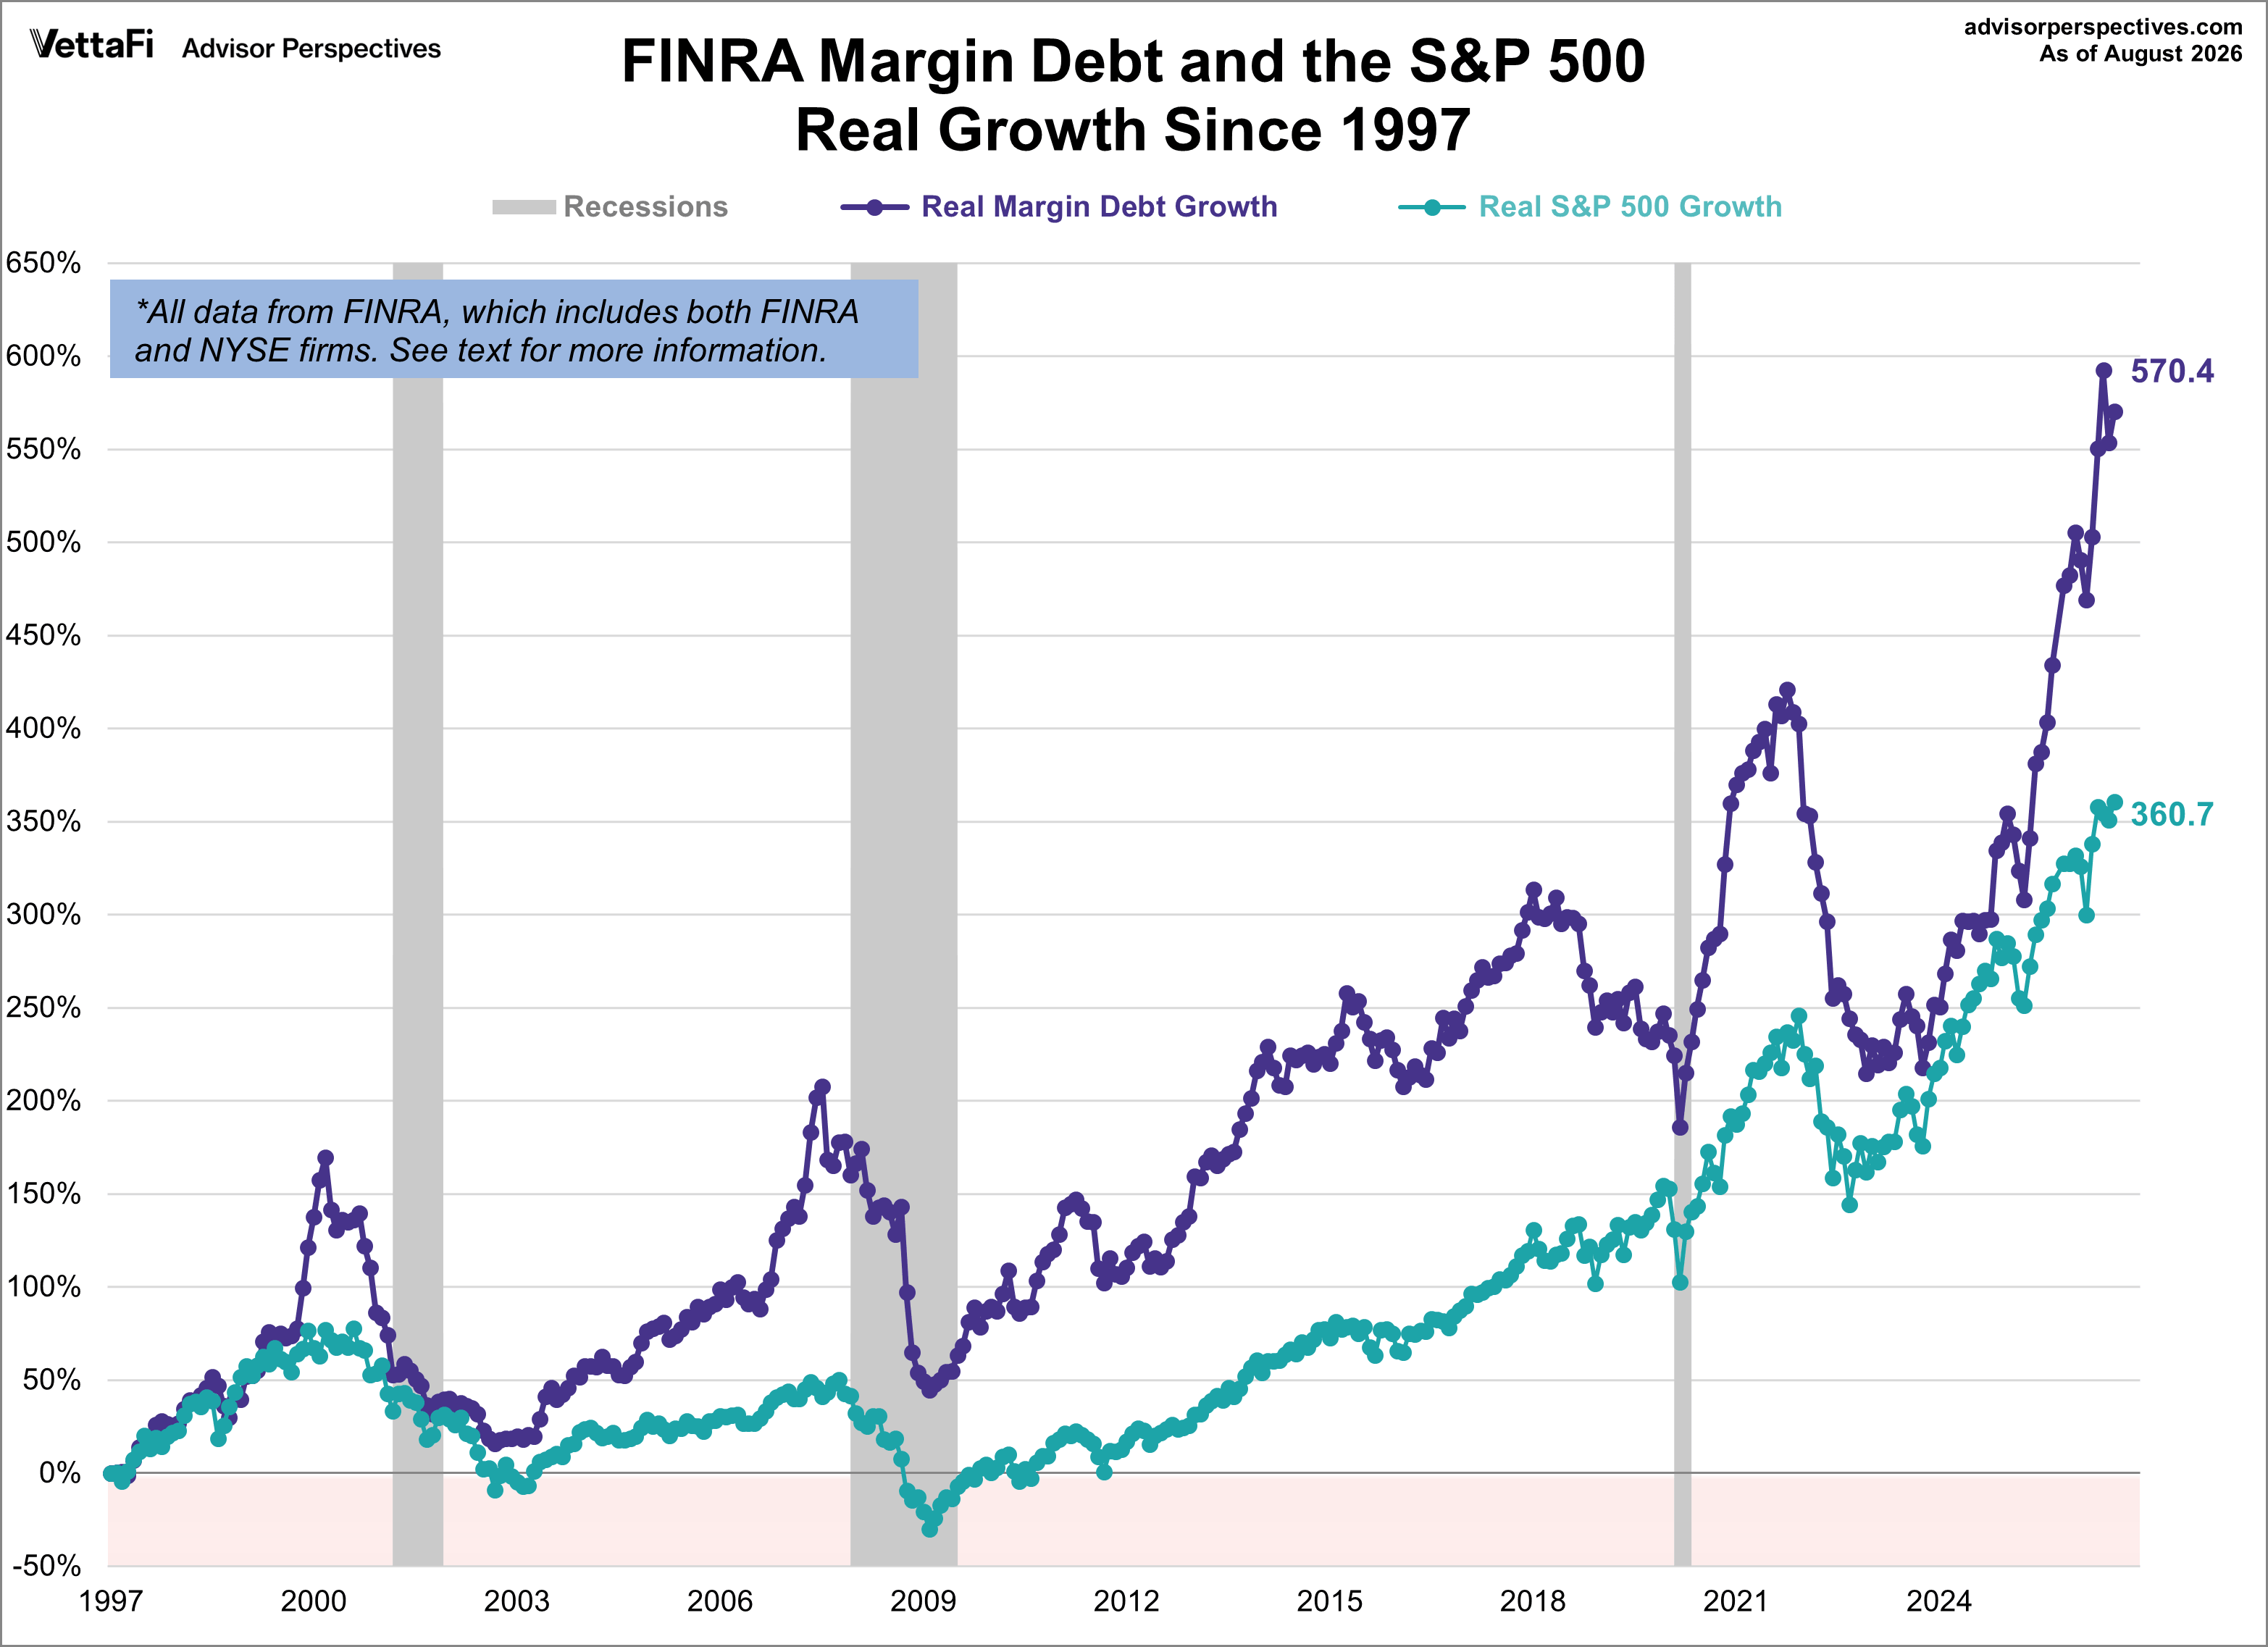
The next chart shows the percentage growth of the two data series from the same 1997 starting date, again based on real (inflation-adjusted) data. It's clear to see that the growth among the two has always moved in a similar fashion, albeit not at similar rates.
Early on, from 1997 to the late summer of 2000, margin debt grew at a rate comparable to the market. However, a divergence in growth rates emerged during the recovery from the tech crash.
Notably, the recent trend shows a sharp widening of the gap, with margin debt growing much faster than the market. As of August 2026, real margin debt has grown 570.4% while the market has grown 360.7%.
NYSE Investor Credit Balances and S&P 500 Correlation
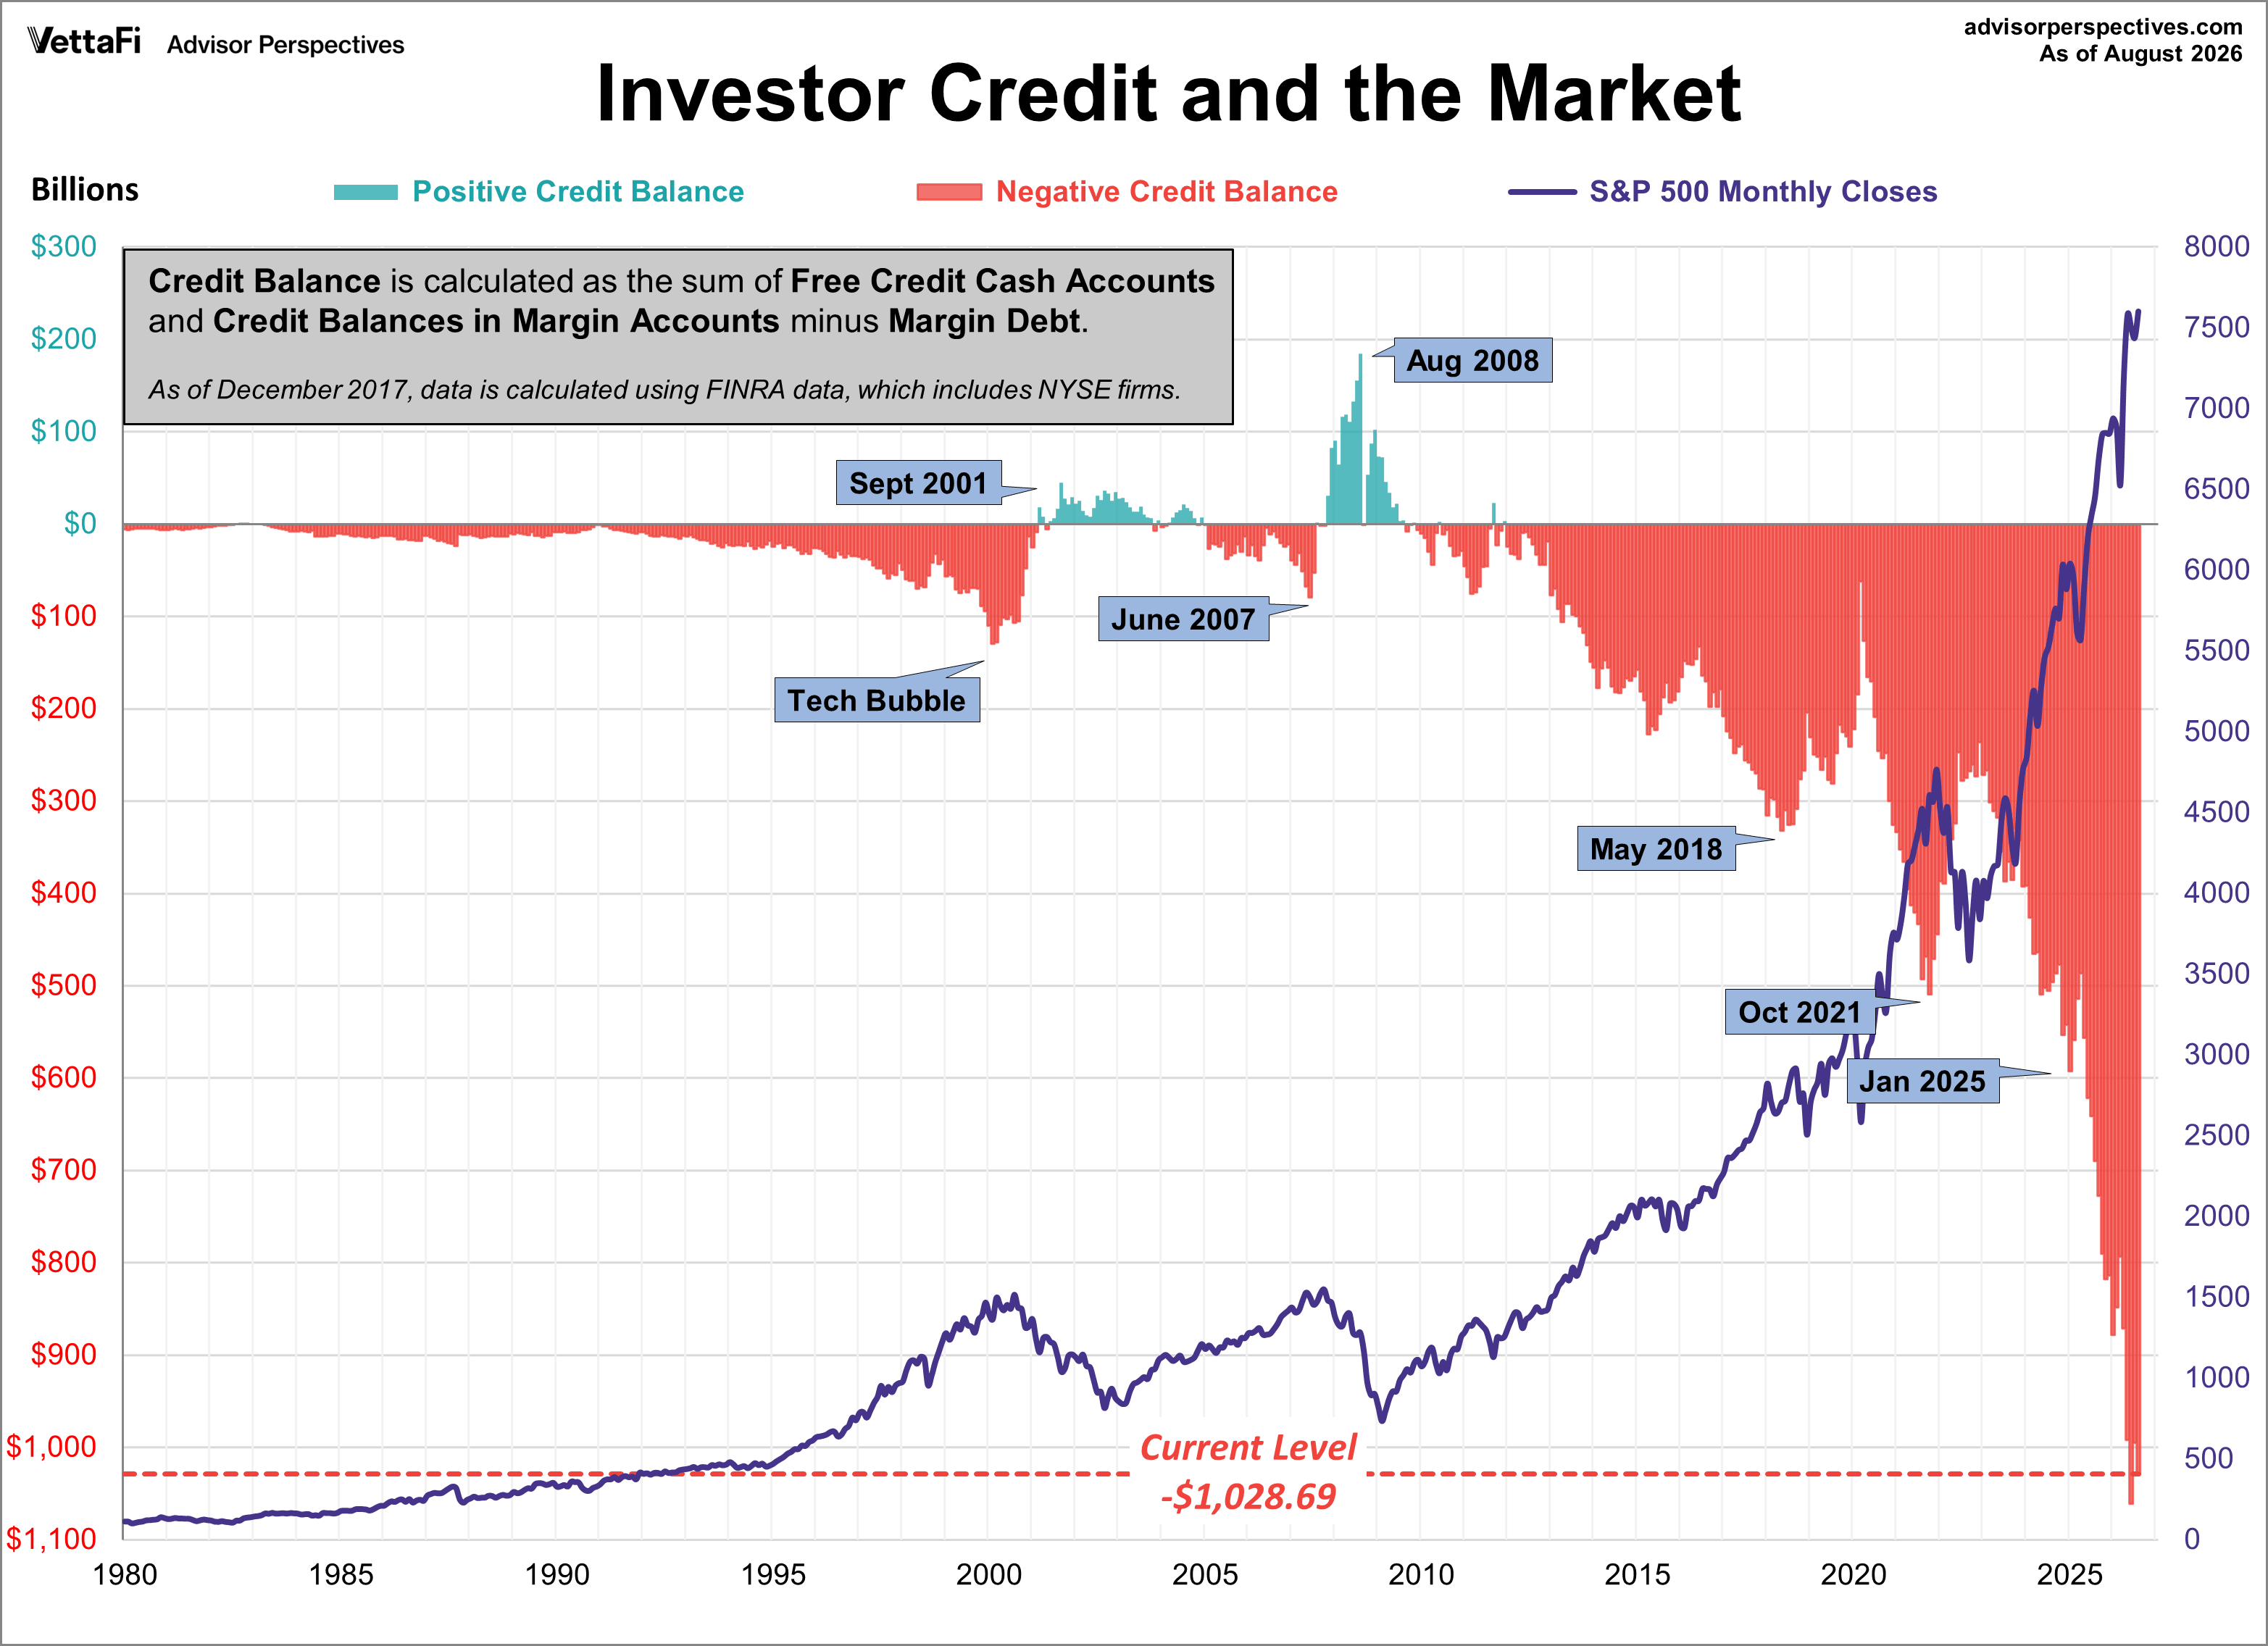
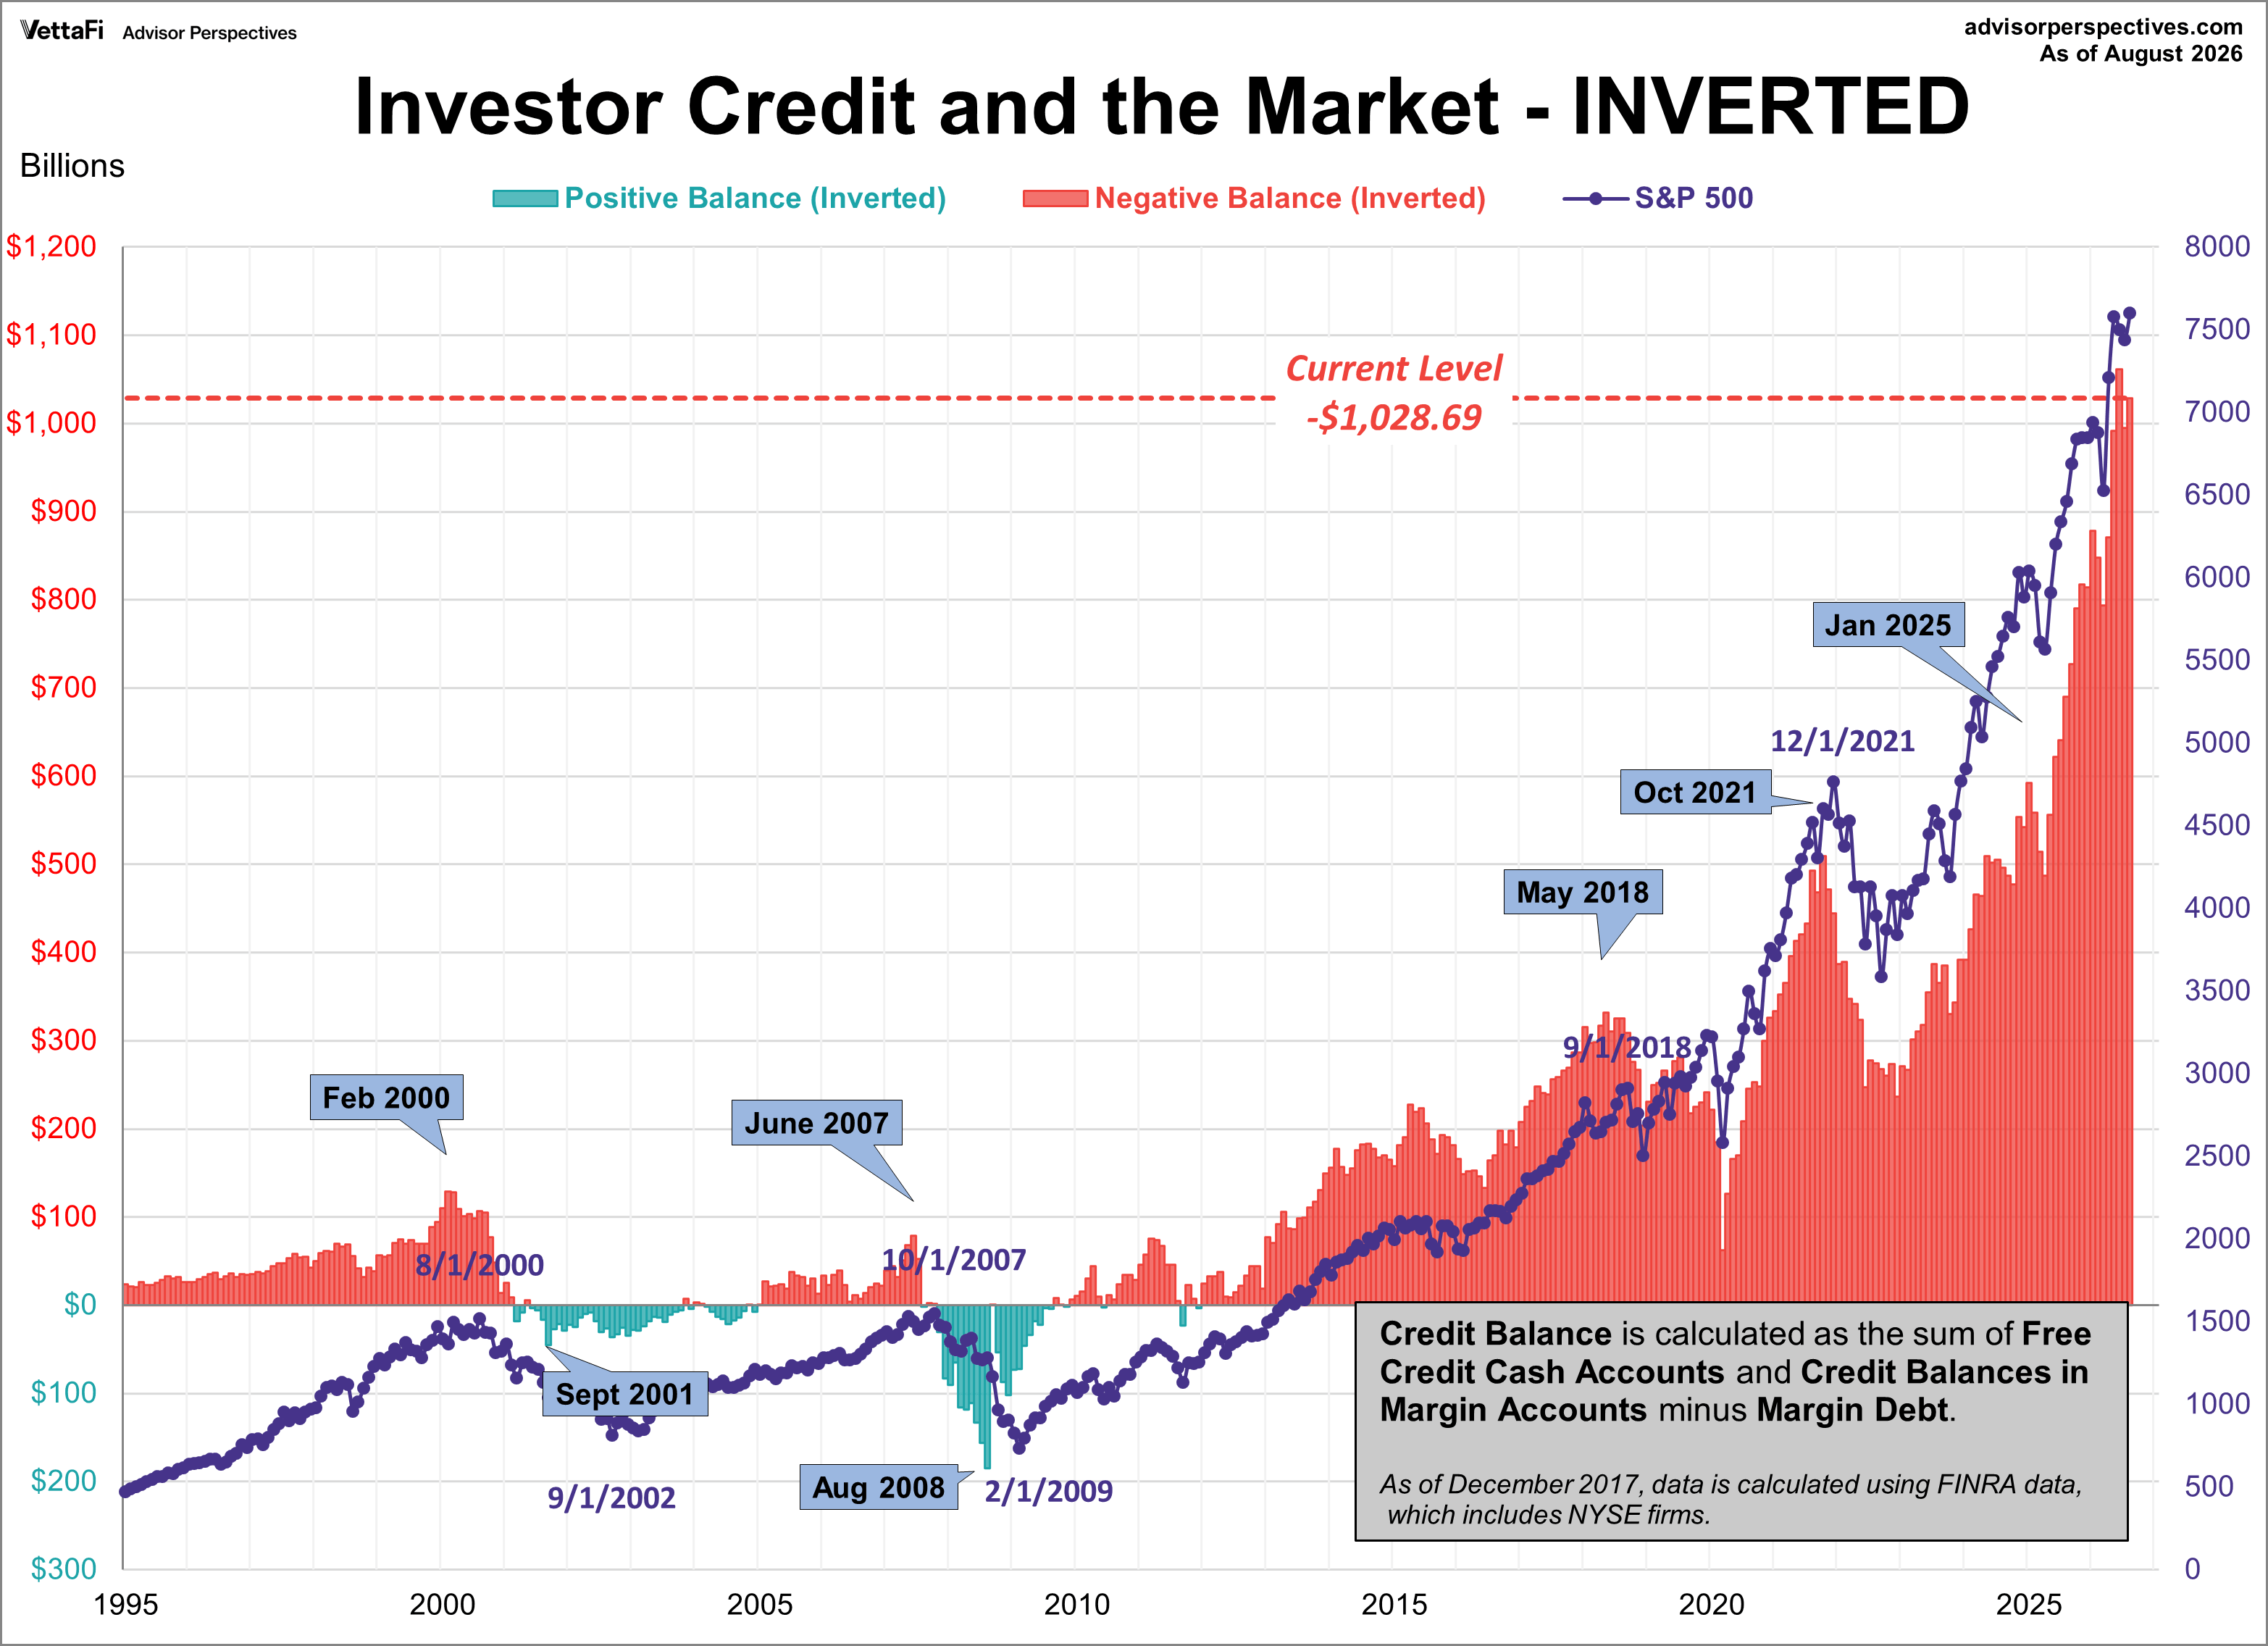
Lance Roberts of Real Investment Advice analyzes margin debt in the larger context that includes free cash accounts and credit balances in margin accounts. Essentially, he calculates the credit balance as the sum of free credit cash accounts and credit balances in margin accounts minus margin debt.
The chart below illustrates the mathematics of Credit Balance with an overlay of the S&P 500. Higher levels of investor credit typically coincide with higher levels of investor conservativeness. The red area represents "Negative Credit Balance", meaning investors owe more than they have in cash.
As of August 2026, the current level sits at -$1,028.7 billion. Note that the chart below is based on nominal data, not adjusted for inflation.
Note: The NYSE suspended its NYSE member firm margin data as of December 2017. I have replaced our margin debt data with FINRA data, which includes data for all firms, not just NYSE member firms.
Here's a slightly closer look at the data, starting with 1995. Also, I've inverted the investor credit monthly data and used markers to pinpoint key turning points.
As I pointed out above, margin debt data is several weeks old when it is published. Thus, even though it may, in theory, be a leading indicator, a major shift in margin debt isn't immediately evident. Nevertheless, we see that the troughs in the monthly net credit balance preceded peaks in the monthly S&P 500 closes by six months in 2000, four months in 2007, four months in 2018, two months in 2021, and zero months in 2025.
Margin Debt: Conclusions
There are too few peak-trough episodes in this overlay series to take the latest credit balance data as a leading indicator of a major selloff in U.S. equities. This has been an interesting indicator to watch and will certainly continue to bear close watching in the future.
ETFs associated with the S&P 500 include: iShares Core S&P 500 ETF (IVV), SPDR S&P 500 ETF Trust (SPY), Vanguard S&P 500 ETF (VOO), and SPDR Portfolio S&P 500 ETF (SPYM).
The New York Stock Exchange previously published end-of-month data for margin debt on the NYX data website, including historical data going back to 1959. Because of NYSE's suspension of publication, we have turned to FINRA to continue our analysis. The figures differ in their inclusion of firms. For data through January 2010, debit balances were derived by adding NYSE debit balances in margin accounts to FINRA debit balances in customers' cash and margin accounts and credit balances were derived by adding NYSE free credit balances in cash and margin accounts to FINRA free and other credit balances in customers' securities accounts. For data after January 2010, "As of February 2010, data are collected pursuant to FINRA Rule 4521 and are aggregated across all member firms, regardless of whether the firm was designated to NASD or the New York Stock Exchange (NYSE) before the consolidation of NASD and the member firm regulation operations of NYSE Regulation in July 2007 that created FINRA," (FINRA statistics definition, FINRA website). As a result of this change, the debt data is higher than the NYSE data.