Official recession calls are the responsibility of the NBER Business Cycle Dating Committee, which is understandably vague about the specific indicators on which it bases its decisions. This committee statement is about as close as it gets to identifying its method.
There is, however, a general belief that there are four big recession indicators that the committee weighs heavily in their cycle identification process. They are:
- Nonfarm Employment
- Industrial Production
- Real Retail Sales
- Real Personal Income (excluding Transfer Receipts)
Key Takeaways
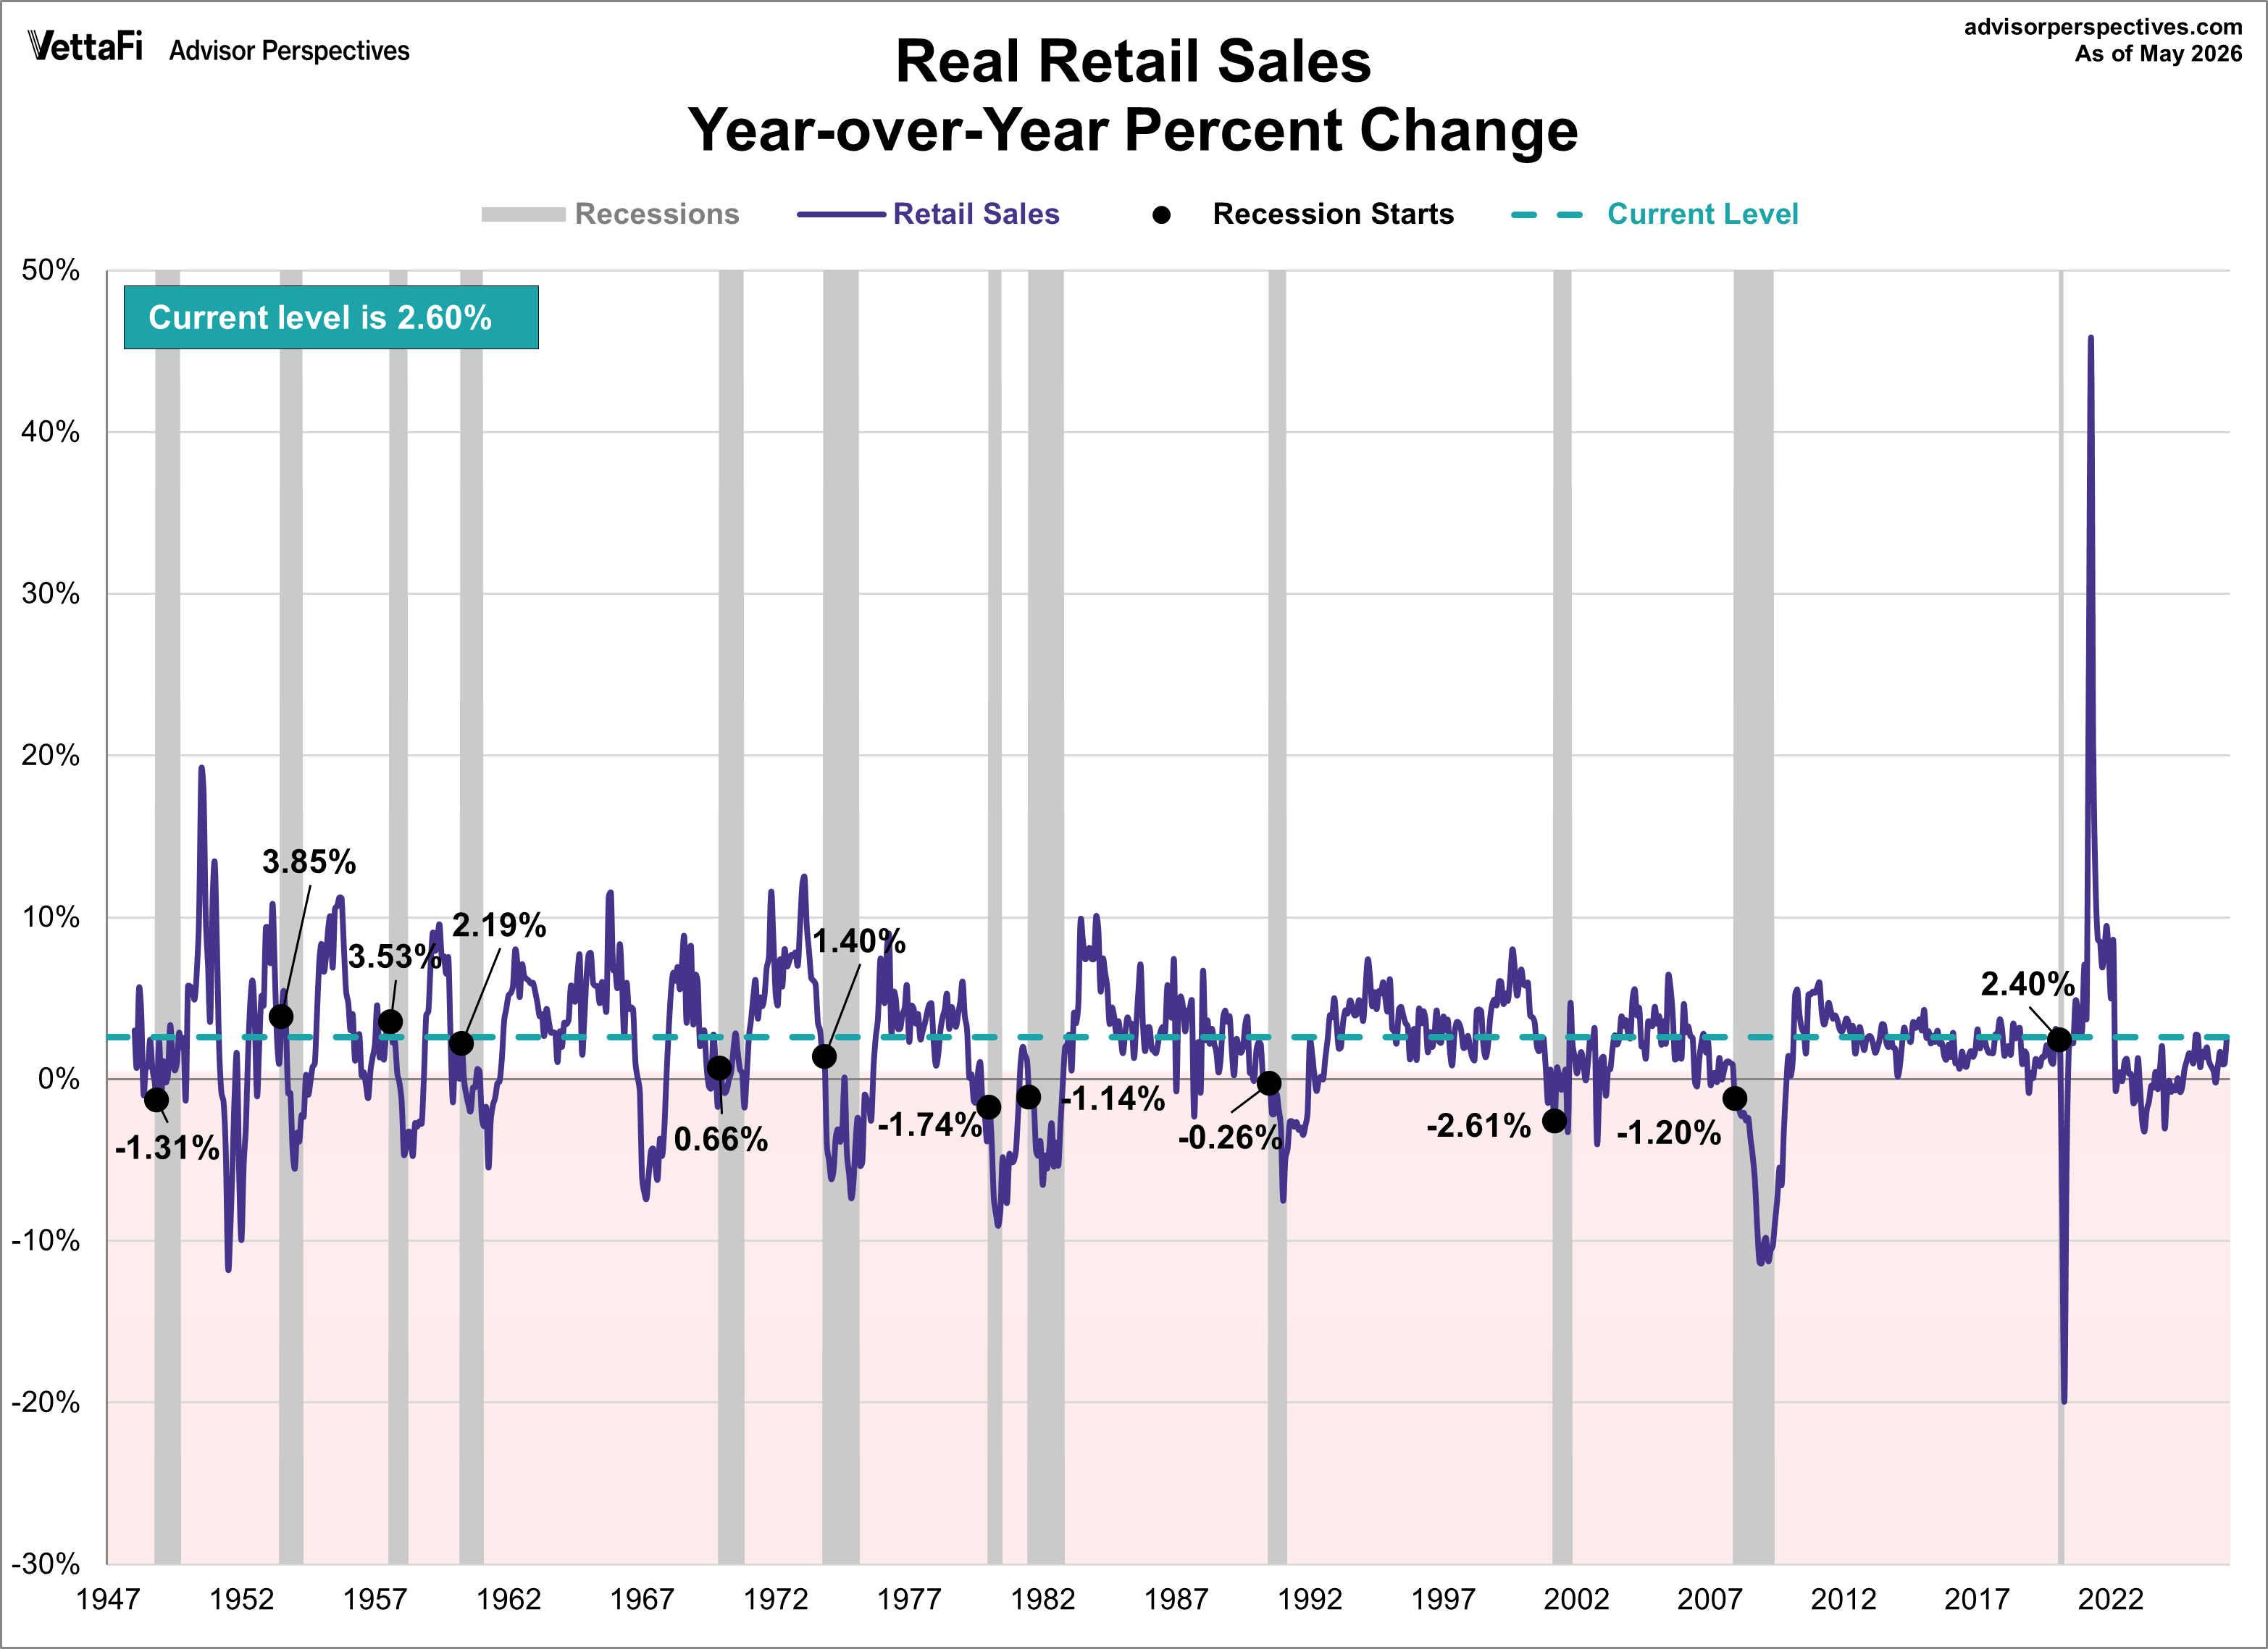
- Inflation-adjusted (real) retail sales rose 0.41% month-over-month and 2.60% year-over-year in May.
- Real retail sales fell below the long-term regression trendline in July 2022 and remain below it today.
- Current year-over-year real sales are at or below levels matching 3 of the last 12 U.S. recessions.
The Latest Indicator Data: Real Retail Sales
With the release of May's retail sales and CPI data, we've updated this commentary to include the latest real (inflation-adjusted) retail sales. Nominal retail sales were up 0.88% month-over-month and up 6.88% year-over-year in May. However, after adjusting for inflation, real retail sales were up 0.41% month-over-month and up 2.60% year-over-year.
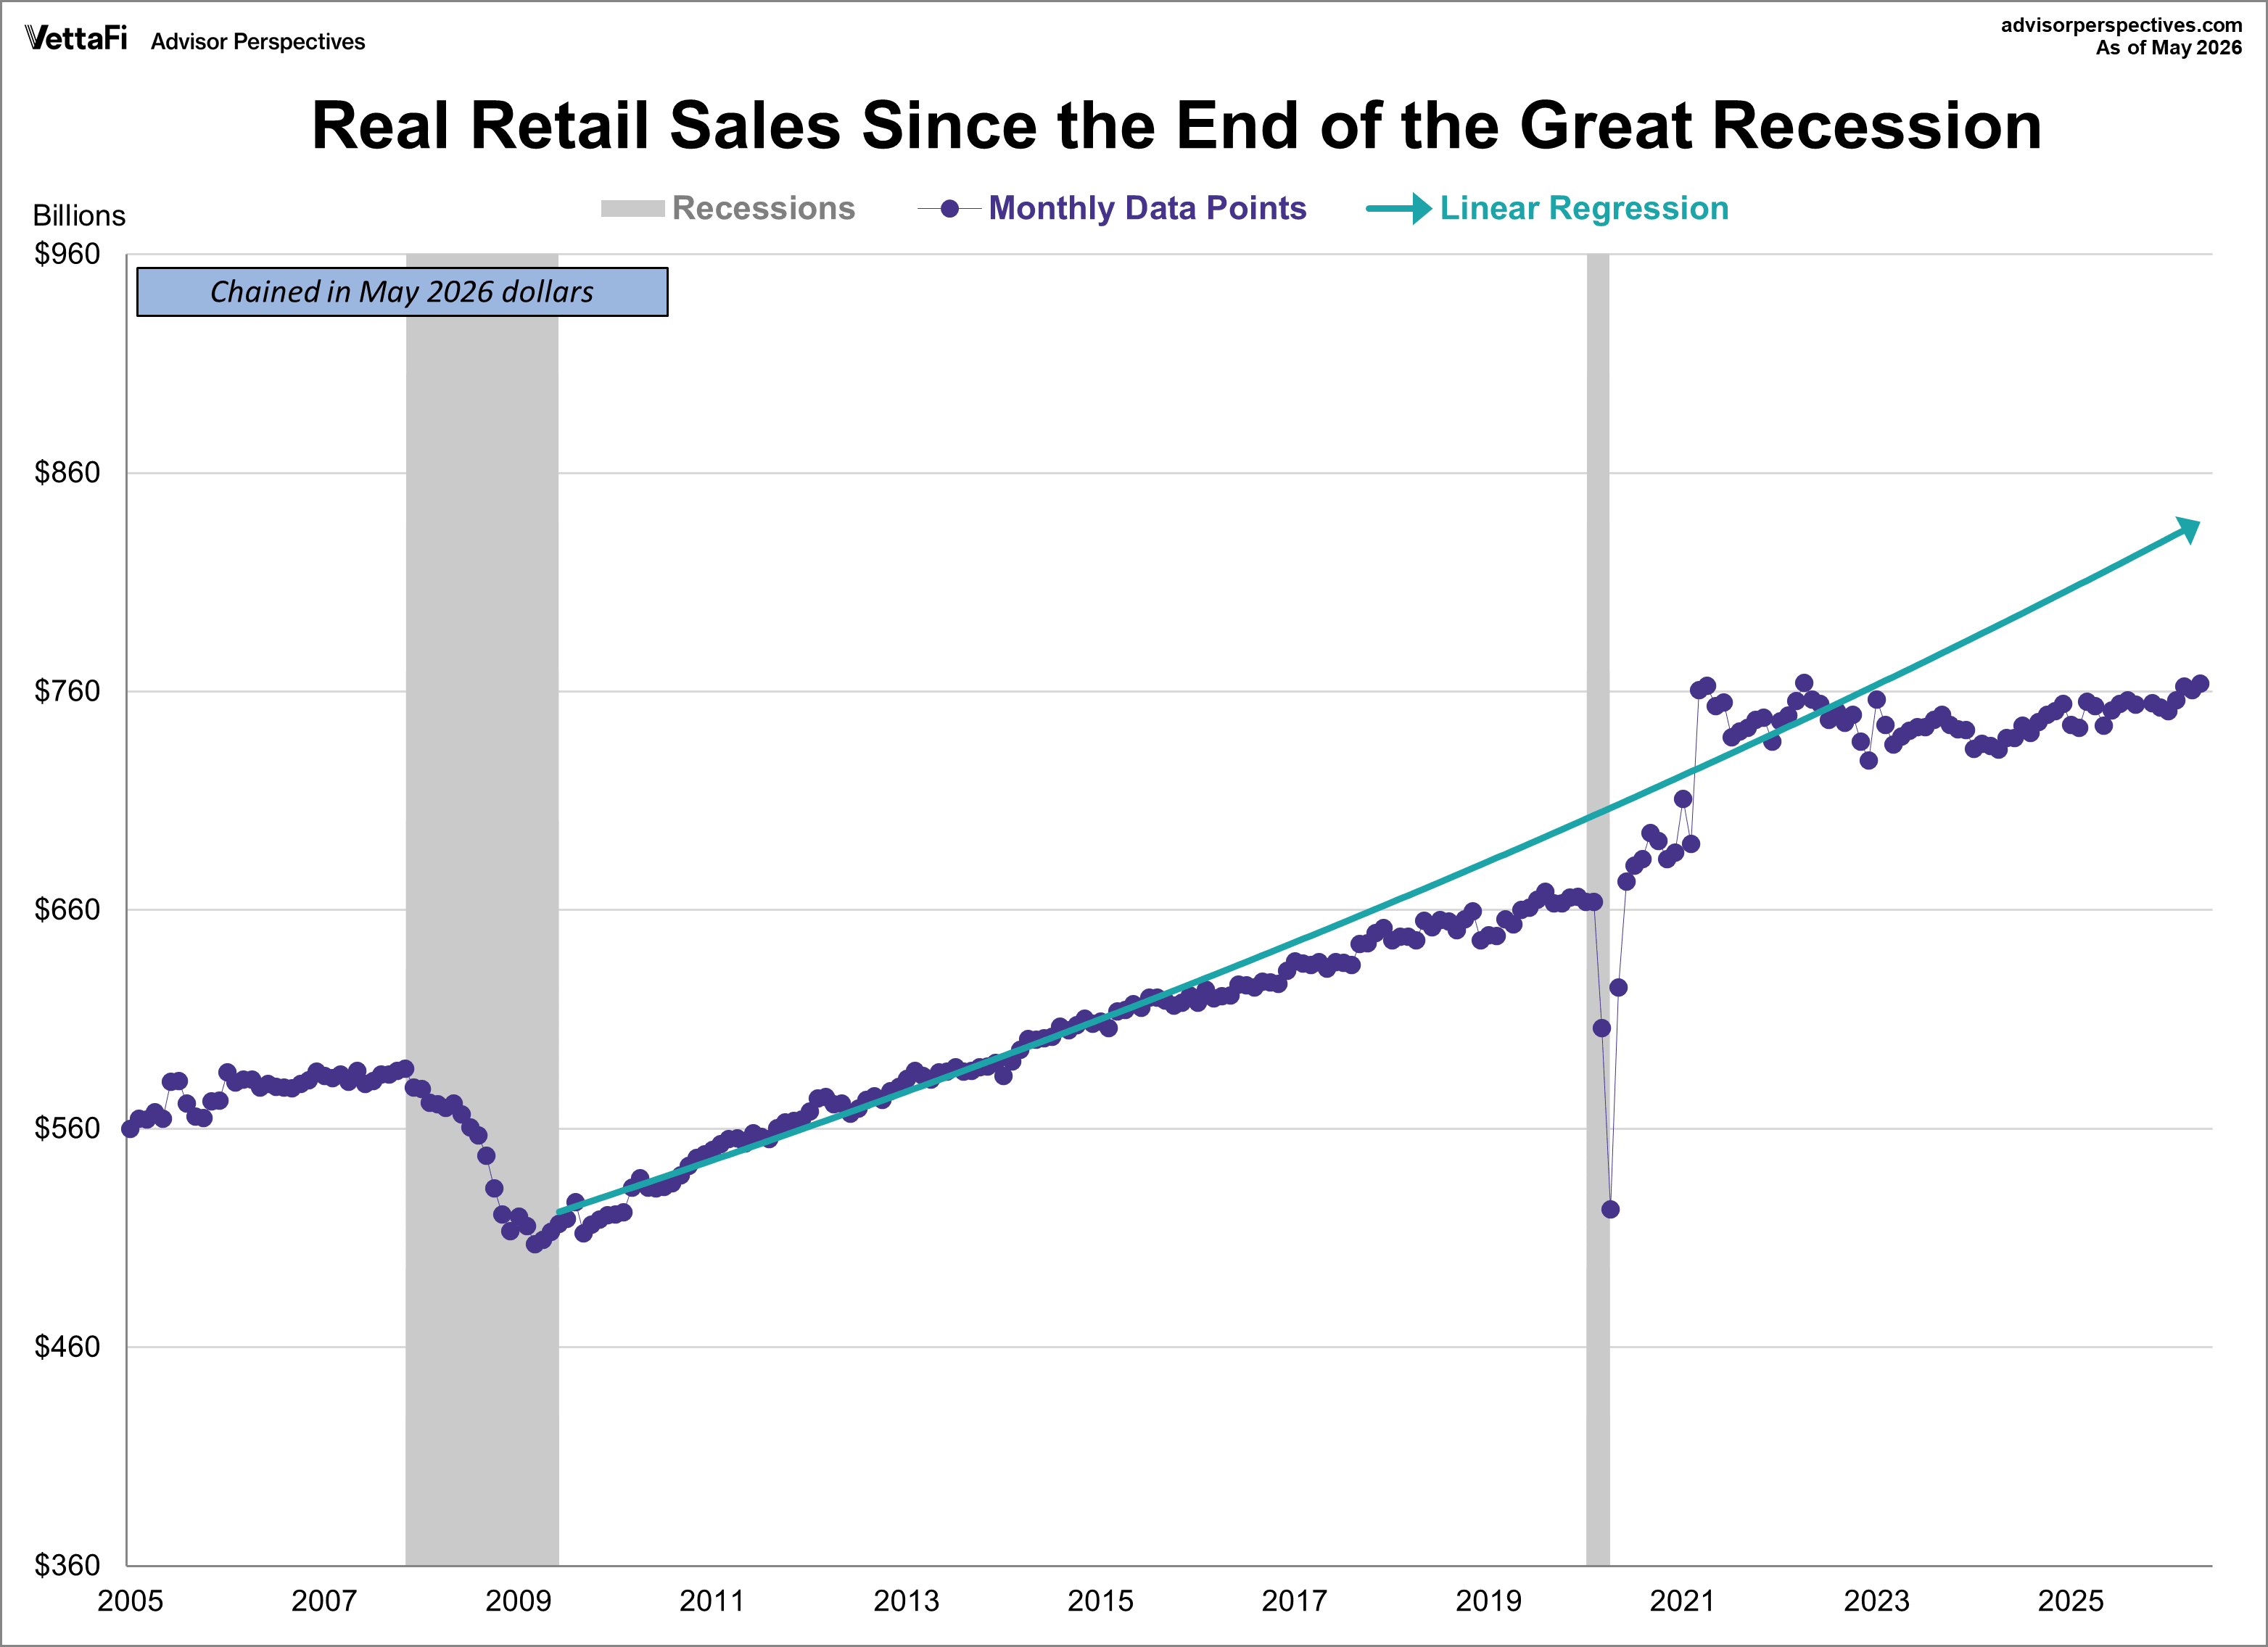
The chart below gives us a close look at the monthly data points in this series since the end of the Great Recession in mid-2009. The linear regression helps us identify variance from the trend.
Real retail sales were mostly consistent with the trend starting from the end of the Great Recession until mid-2015. At that point, real retail sales fell below the trendline and consistently inched further away from it. The COVID pandemic resulted in extreme divergence from the trend but sales quickly made their way back up, surpassing the trendline in March 2021 as a result of the COVID-recession recovery. Real retail sales remained above the trend for 18 months until August 2022. After a few months of bouncing above and below the trendline, real retail sales dropped below the trendline in July 2022 and have been there ever since.
Real Retail Sales: Visualizing the Data
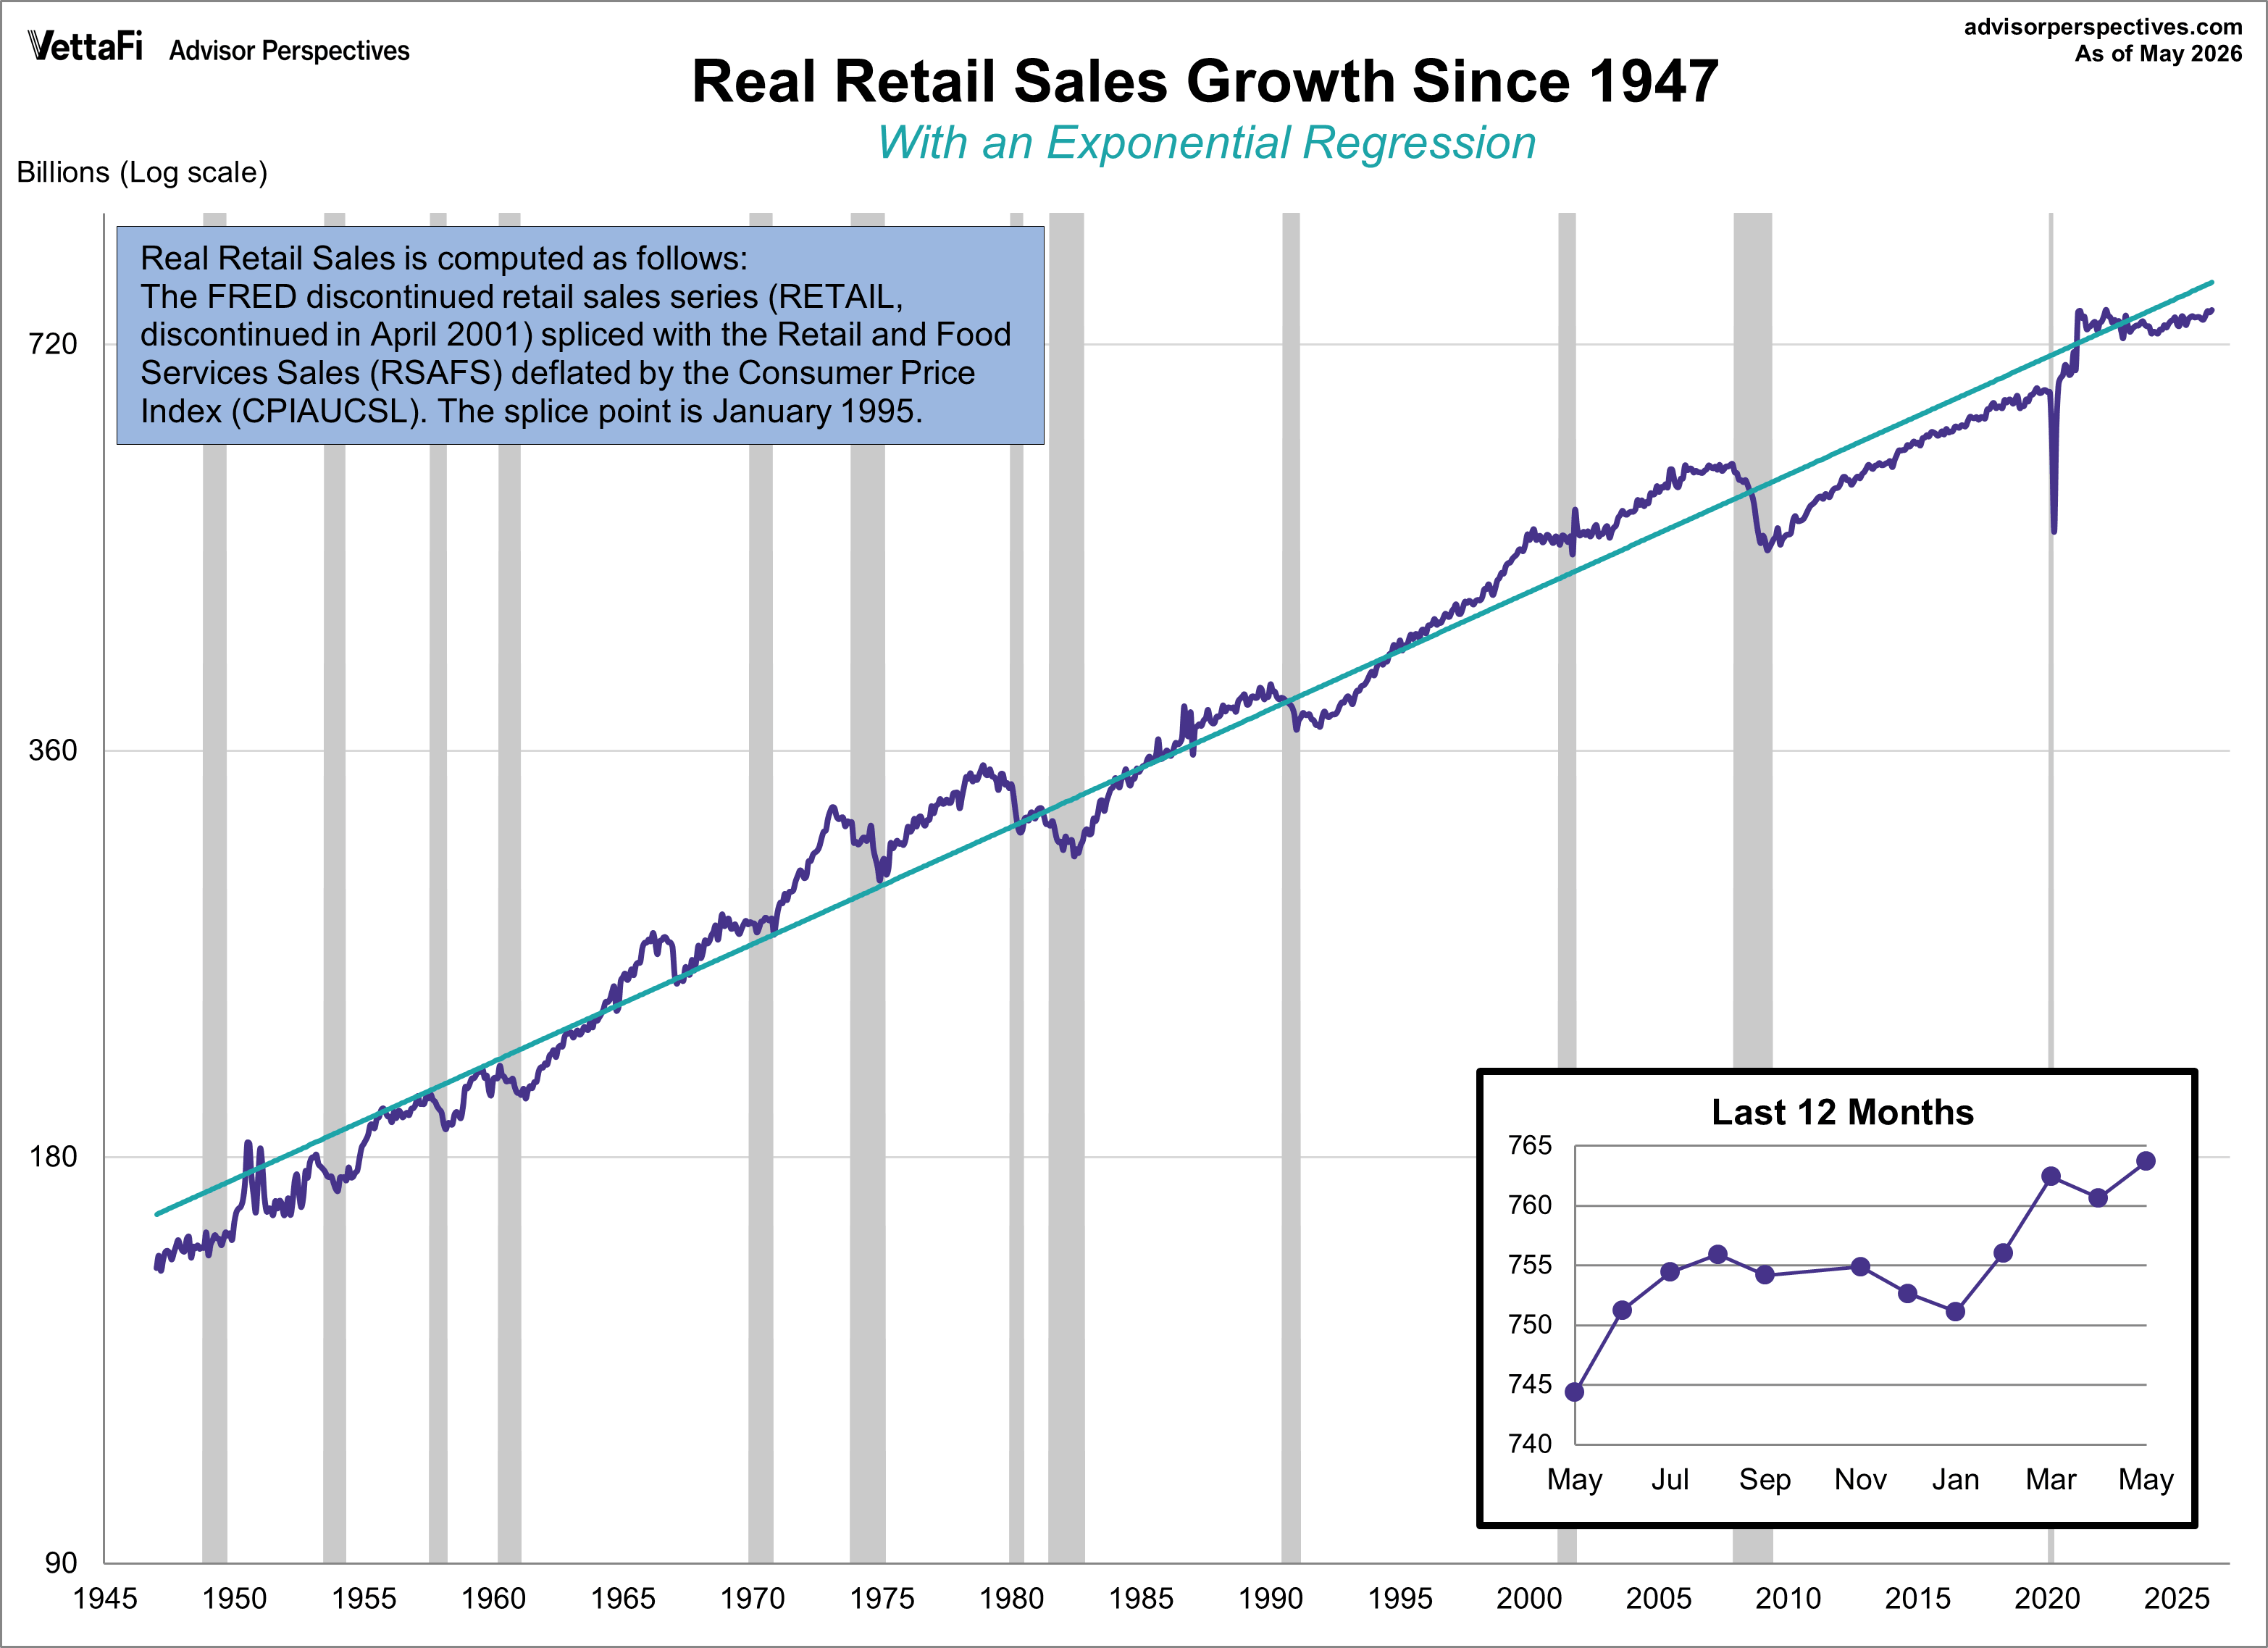
This indicator is a splicing of the discontinued retail sales series (RETAIL, discontinued in April 2001) with the Retail and Food Services Sales (RSAFS) and deflated by the seasonally adjusted Consumer Price Index (CPIAUCSL). We've used a splice point of January 1995 because that date was mentioned in the FRED notes. Our experiments with other splice techniques (e.g., 1992, 2001 or using an average of the overlapping years) didn't make a meaningful difference in the behavior of the indicator in proximity to recessions. We've chained the data to the latest CPI.
In the charts below we have illustrated three different data manipulations:
- A log scale plotting of the complete data series to ensure that distances on the vertical axis reflect true relative growth. This adjustment is particularly important for data series that have changed significantly over time.
- A year-over-year representation to help, among other things, identify broader trends over the years. Real retail sales year-over-year is currently at or below the level at the start of 3 of the 12 recessions that have started since 1948.
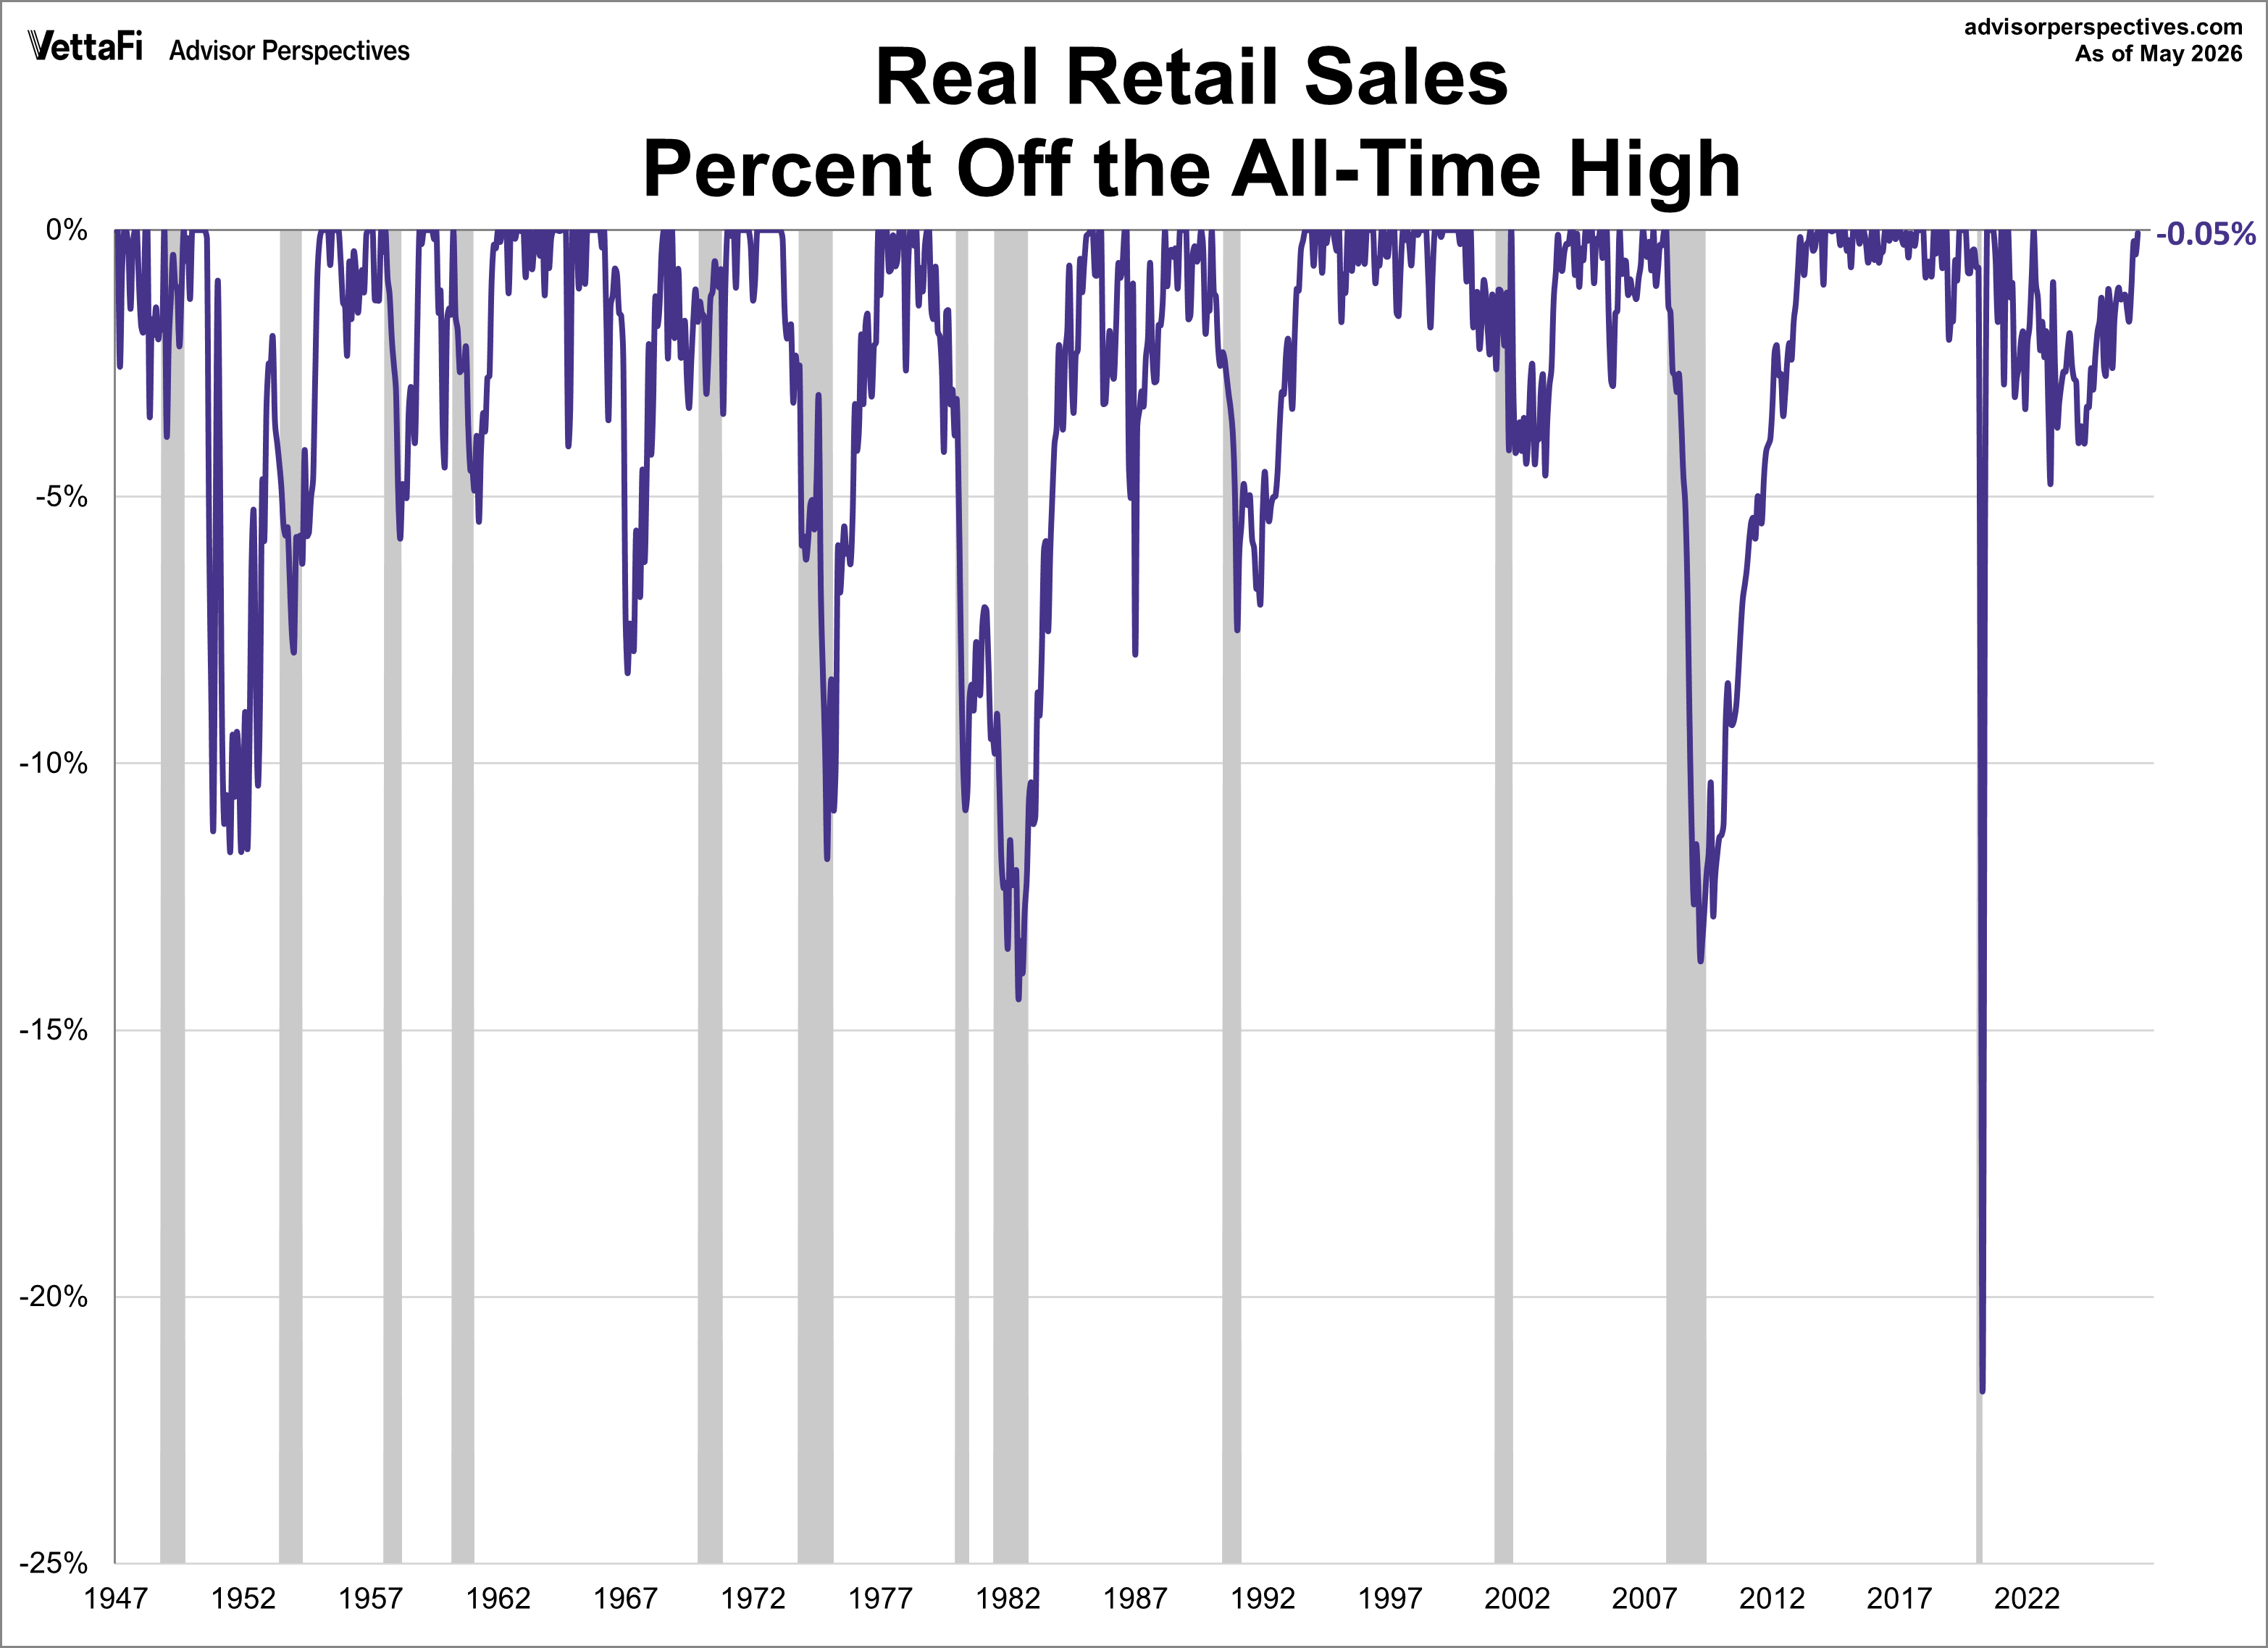
- A percent-off-high manipulation, which is particularly useful for better understanding of trend behavior and secular volatility. Real retail sales are currently 0.05% off its all-time high from April 2022.
ETFs associated with retail sales include: SPDR S&P Retail ETF (XRT), VanEck Retail ETF (RTH), Amplify Online Retail ETF (IBUY), and ProShares Online Retail ETF (ONLN).
vettafi.com is owned by VettaFi LLC (“VettaFi”). VettaFi is the index provider for IBUY for which it receives an index licensing fee. However, IBUY is not issued, sponsored, endorsed, or sold by VettaFi. VettaFi has no obligation or liability in connection with the issuance, administration, marketing, or trading of IBUY.


