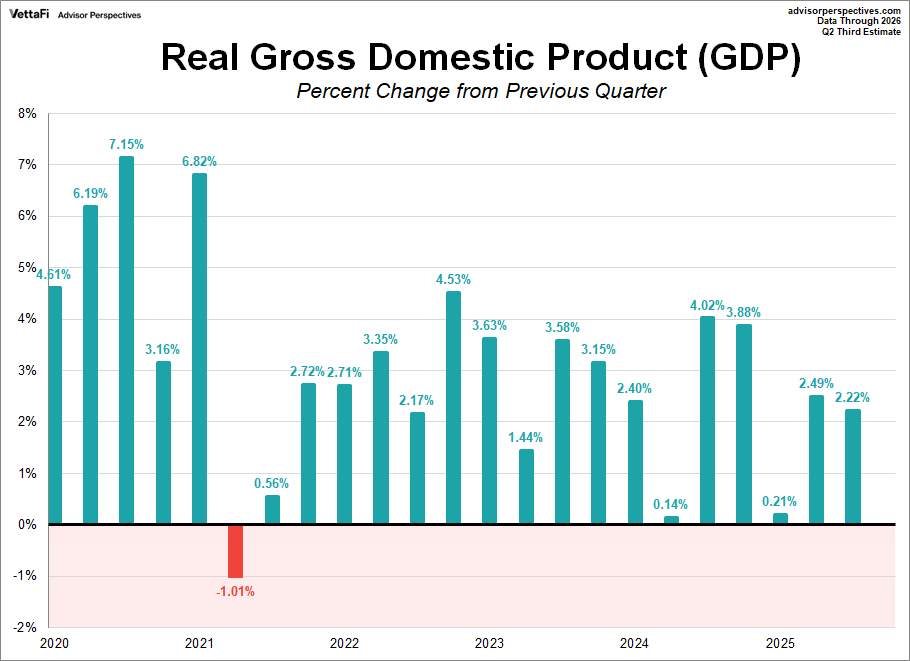
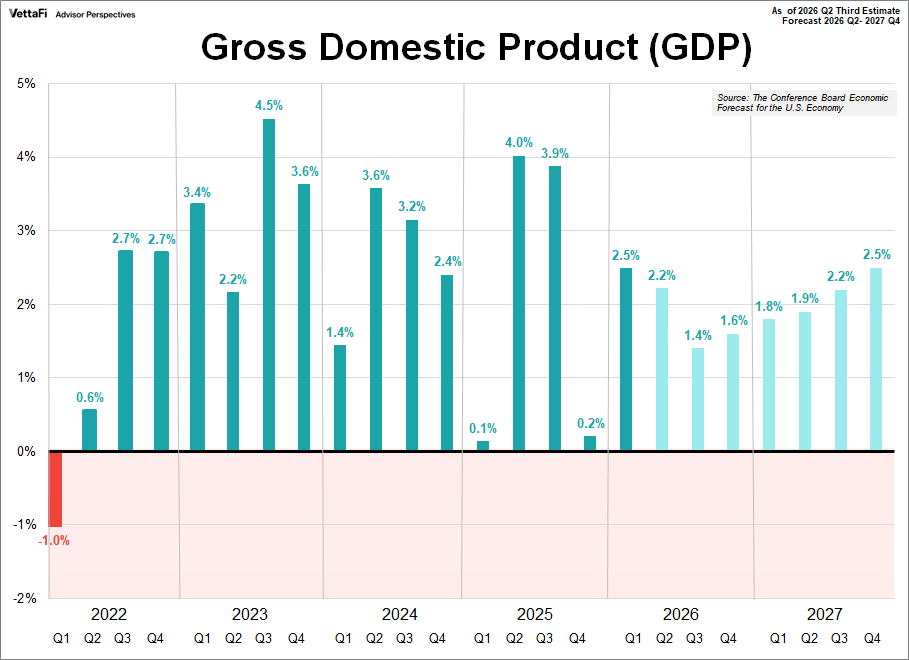
Q2 GDP growth was revised higher from the advance and second estimates at an annualized rate of 2.2%, according to the BEA’s third estimate. This represents a slowdown from the 2.5% pace recorded in Q1, which was also revised higher.
Key Takeaways
-
The third estimate for Q2 GDP of 2026 was revised higher as U.S. real GDP expanded at an annualized rate of 2.2%, slowing from 2.5% in Q1.
-
Economic expansion during the quarter was driven primarily by sustained momentum across consumer spending, private business investment, and exports.
-
The first quarter of 2026 saw an upward revision of 0.4% to 2.5% due to higher exports of services and consumer spending.
Here is the opening text from the Bureau of Economic Analysis news release:
Real gross domestic product (GDP) increased at an annual rate of 2.2 percent in the second quarter of 2026 (April, May, and June), according to the third estimate released today by the U.S. Bureau of Economic Analysis (BEA). In the first quarter, real GDP increased 2.5 percent (revised).
Gross Domestic Product (GDP)
Real gross domestic product (GDP) measures how fast or slowly the economy is growing and measures the inflation-adjusted value of all goods and services produced by the economy. It is considered the broadest measure of economic activity and the primary indicator of an economy's health. The Bureaus of Economic Analysis (BEA) releases real GDP data on a monthly basis. There are three versions released a month apart, advance, second, and final, each incorporating data that was previously unavailable. Economists can use GDP to determine whether an economy is growing or experiencing a recession.
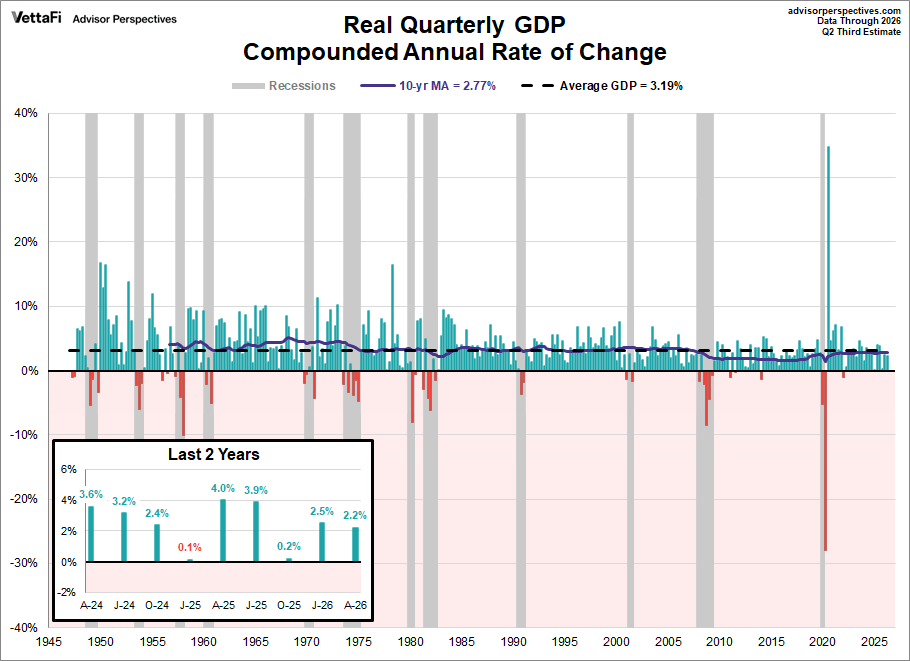
This chart illustrates the annualized, inflation-adjusted change in U.S. gross domestic product (GDP) from the preceding quarter, with data beginning in Q2 1947. (Prior to Q2 1947, GDP was calculated annually.) For context, the chart also highlights recessions (as determined by the National Bureau of Economic Research, NBER), the historical GDP growth average of 3.19%, and the current 10-year moving average of 2.77%.
A key trend is evident: the 10-year moving average of GDP growth fell below the historical average in 2007 and has remained there, signaling a significant deceleration in U.S. economic expansion since the Great Recession. Current growth is below both the long-term series average and the 10-year moving average, indicating a slower pace of growth than experienced historically.

The chart above has many interesting data points but can be quite overwhelming to look at. This next chart provides a simplified look over the past few years.
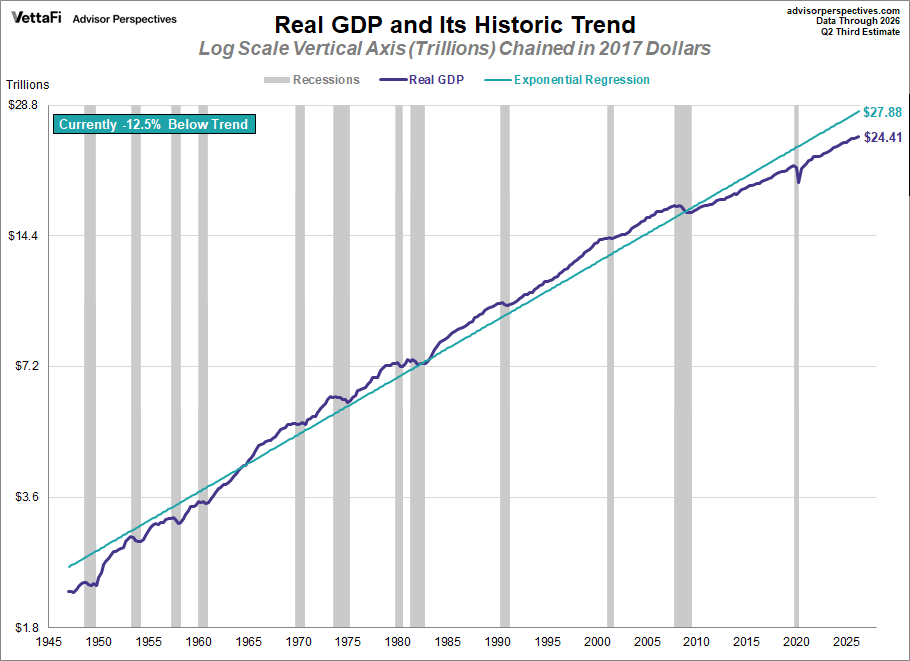
Here is a log-scale chart of real GDP with an exponential regression, which helps us understand growth cycles since the 1947 inception of quarterly GDP. The regression illustrates the fact that the current trend, since the Great Recession, has a visibly lower slope than the long-term trend. In fact, the current GDP is 12.5% below the pre-recession trend (2008).
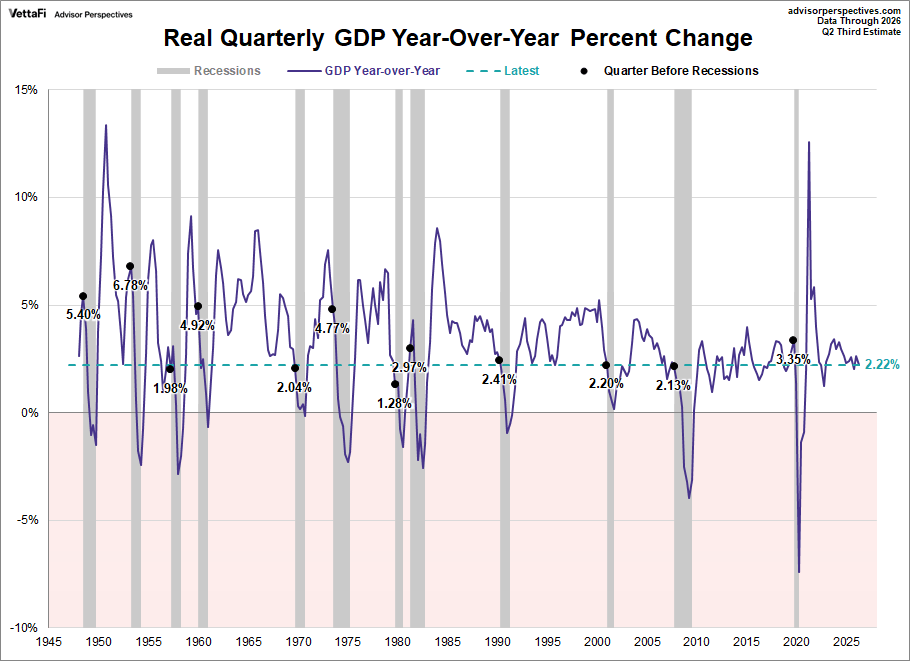
A particularly telling representation of slowing growth in the US economy is the year-over-year rate of change. Beginning in 1947, the average year-over-year rate at the start of recessions is 3.2% with a range of 1.28% to 6.78%. The current year-over-year rate for real GDP is at 2.2%, which is at or below 8 of the 12 recession starts during this time frame.
GDP: A Look Ahead
In the chart below, we use the Conference Board's Economic Forecast for the U.S. Economy to visualize GDP forecast over the next few years.
September 11, 2026
U.S. Outlook: Fed Tightening to Deepen Consumer Pullback
The U.S. economy is nearing yearend with an increasingly difficult policy mix. The Federal Reserve now appears likely to respond to renewed inflation pressures with a series of interest rate hikes, risking a deeper consumer slowdown than was already underway. We now anticipate three consecutive rate hikes in September, October, and December.
For a closer look at each of the subcomponents of GDP, check out our commentary An Inside Look at GDP.
For another perspective on GDP, check out our commentary Real GDP Per Capita.
Read more updates by Jen Nash