The Census Bureau released its latest quarterly report for Q1 2026 showing the latest homeownership rate is at 65.3%, down 0.4 percentage points from in Q4 2025. The seasonally adjusted Q4 number is at 65.4%, down 0.1 percentage points from the previous quarter.
Note: Due to a lapse in federal funding, the Current Population Survey/Housing Vacancy Survey (CPS/HVS) did not collect data for the month of October 2025. The fourth quarter 2025 estimates are therefore based only on data from November 2025 and December 2025.
Here's an excerpt from the press release:
National vacancy rates in the first quarter 2026 were 7.3 percent for rental housing and 1.1 percent for homeowner housing. The rental vacancy rate was not statistically different from the rate in the first quarter 2025 (7.1 percent) and not statistically different from the rate in the fourth quarter 2025 (7.2 percent).
The homeowner vacancy rate of 1.1 percent was virtually the same as the rate in the first quarter 2025 (1.1 percent) and not statistically different from the rate in the fourth quarter 2025 (1.2 percent).
The homeownership rate of 65.3 percent was not statistically different from the rate in the first quarter 2025 (65.1 percent) and not statistically different than the rate in the fourth quarter 2025 (65.7 percent).
The Census Bureau has been tracking the non-seasonally adjusted data since 1965. Its seasonally adjusted version only goes back to 1980. Here is a snapshot of the non-seasonally adjusted series with a 4-quarter moving average to highlight the trend. The latest 4-quarter moving average is at 65.3%.
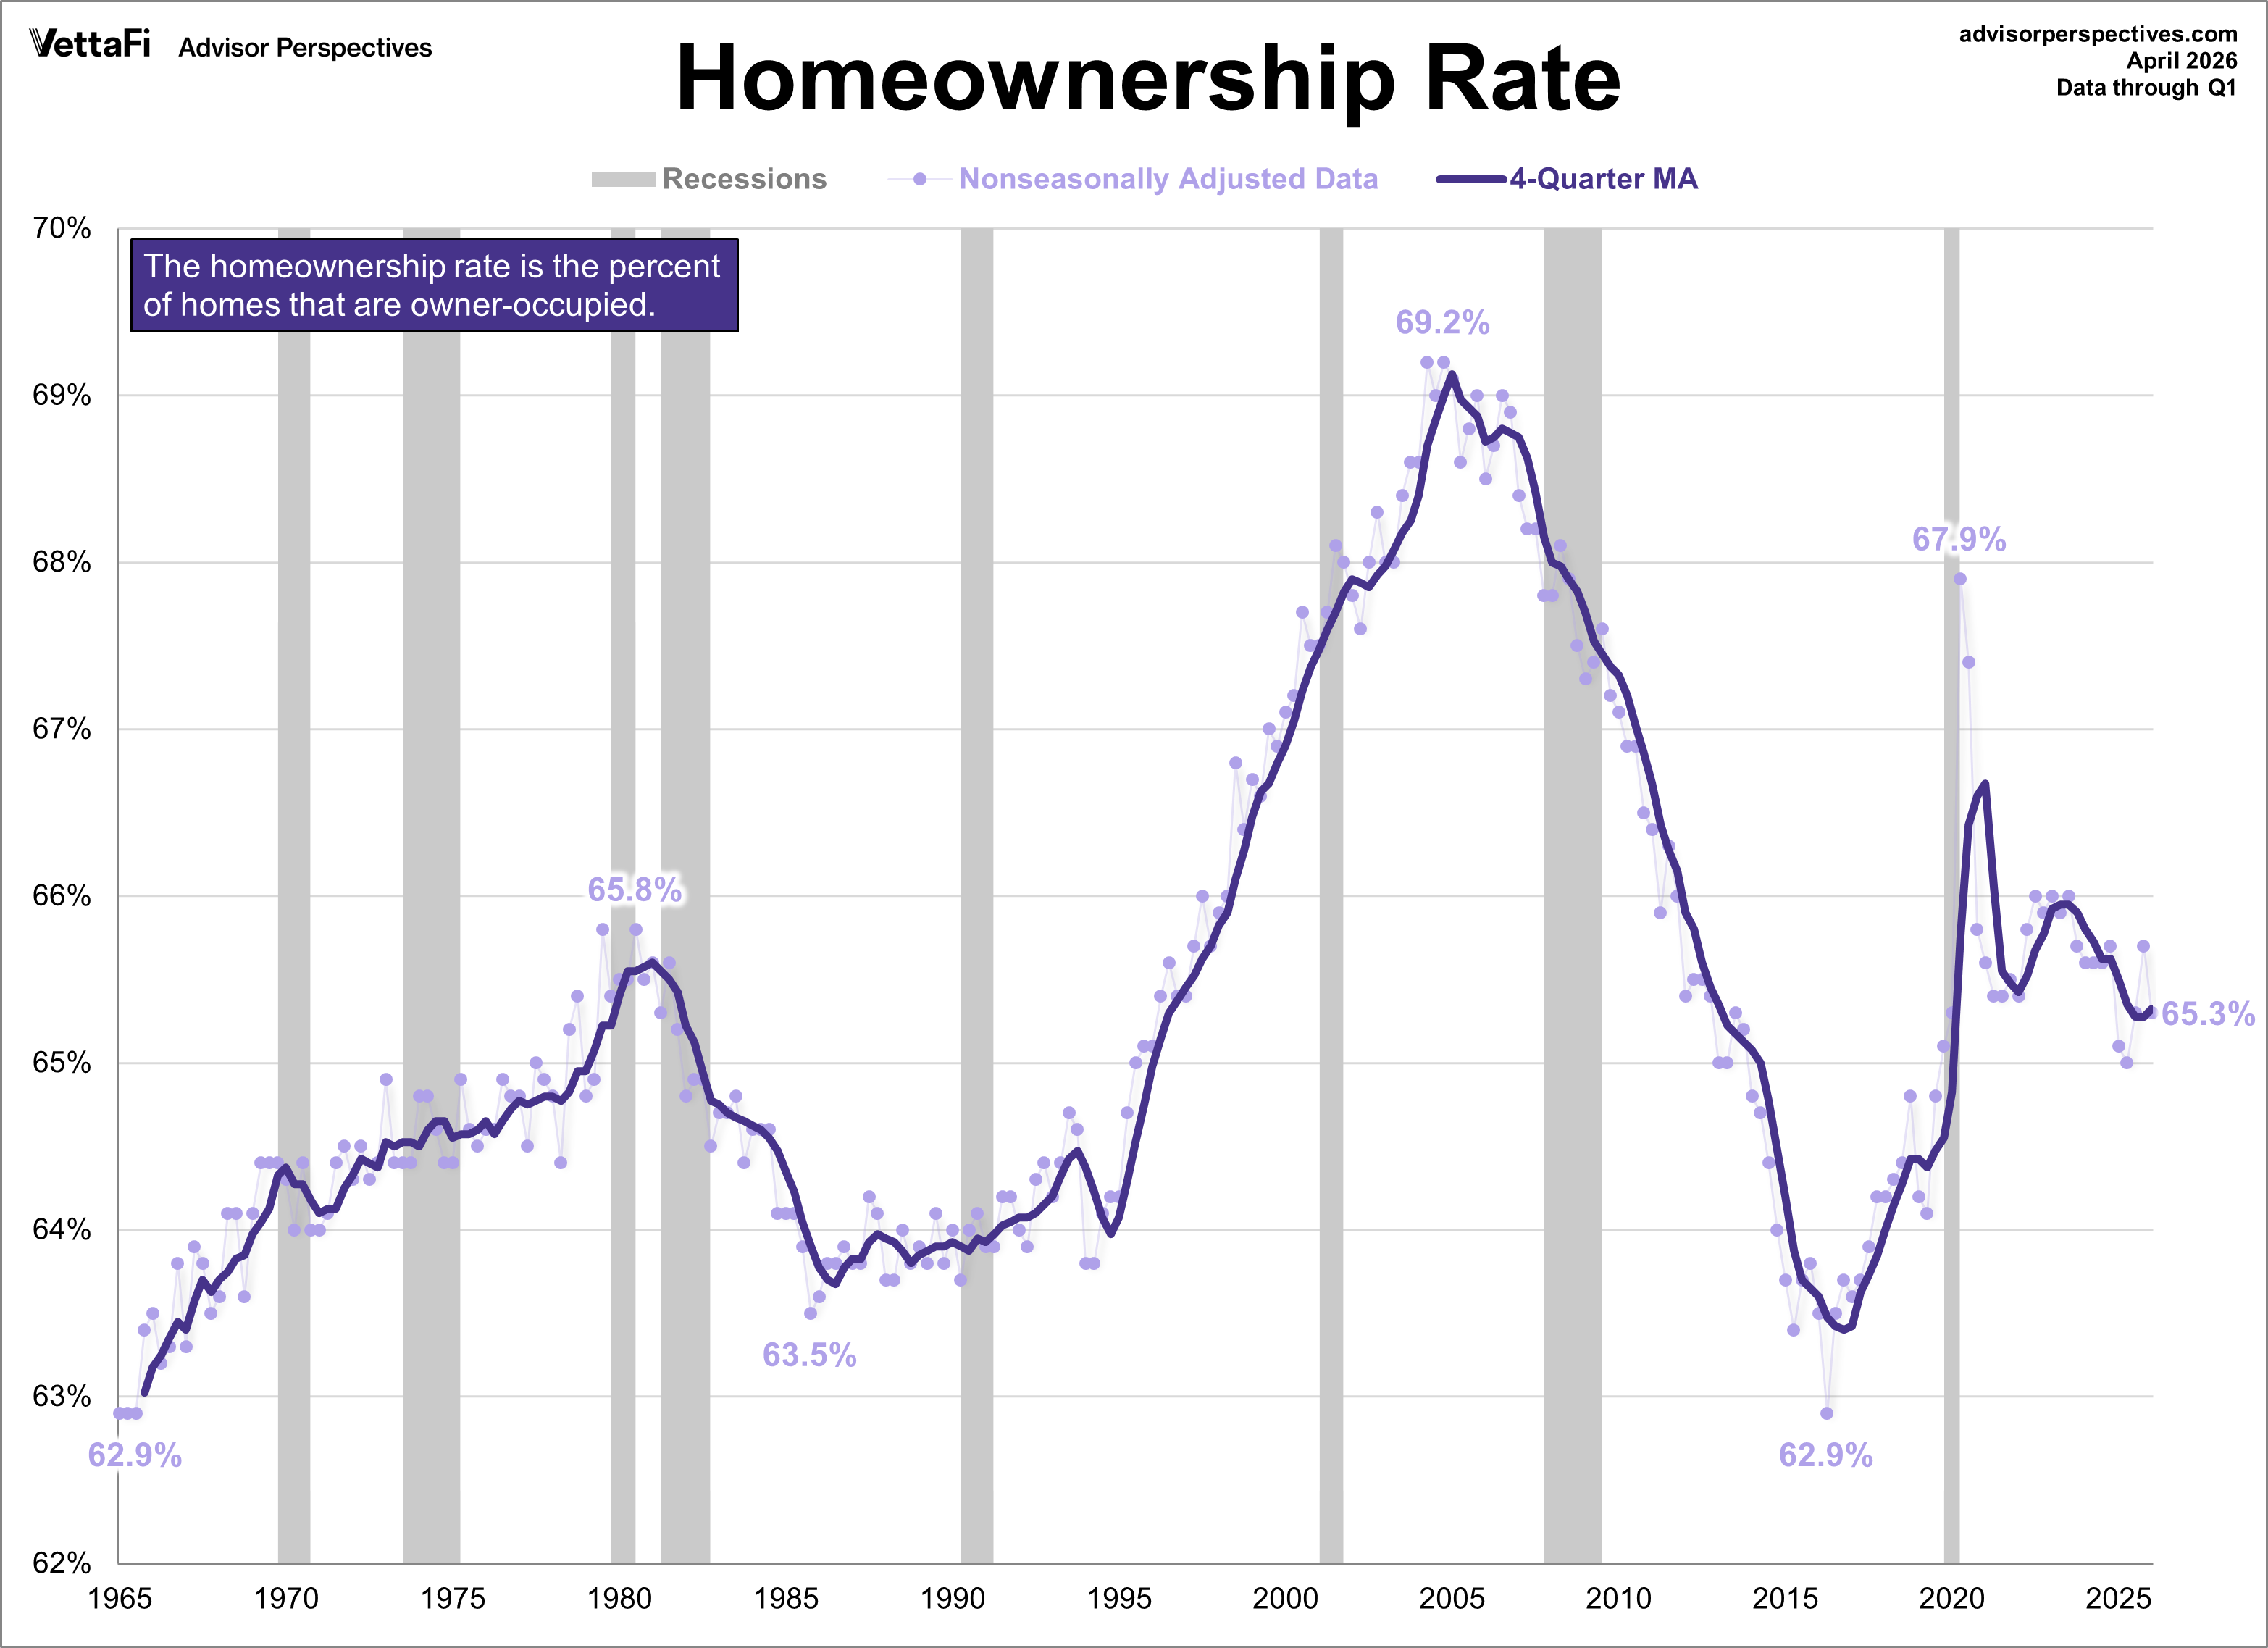
The COVID-induced recession led to a brief but sharp increase in homeownership due to drastically reduced consumer spending. However, the homeownership rate quickly declined. The prevailing view is that this downward trend is driven by elevated mortgage rates, rising home prices, and a limited supply of entry-level homes that would attract first-time buyers.
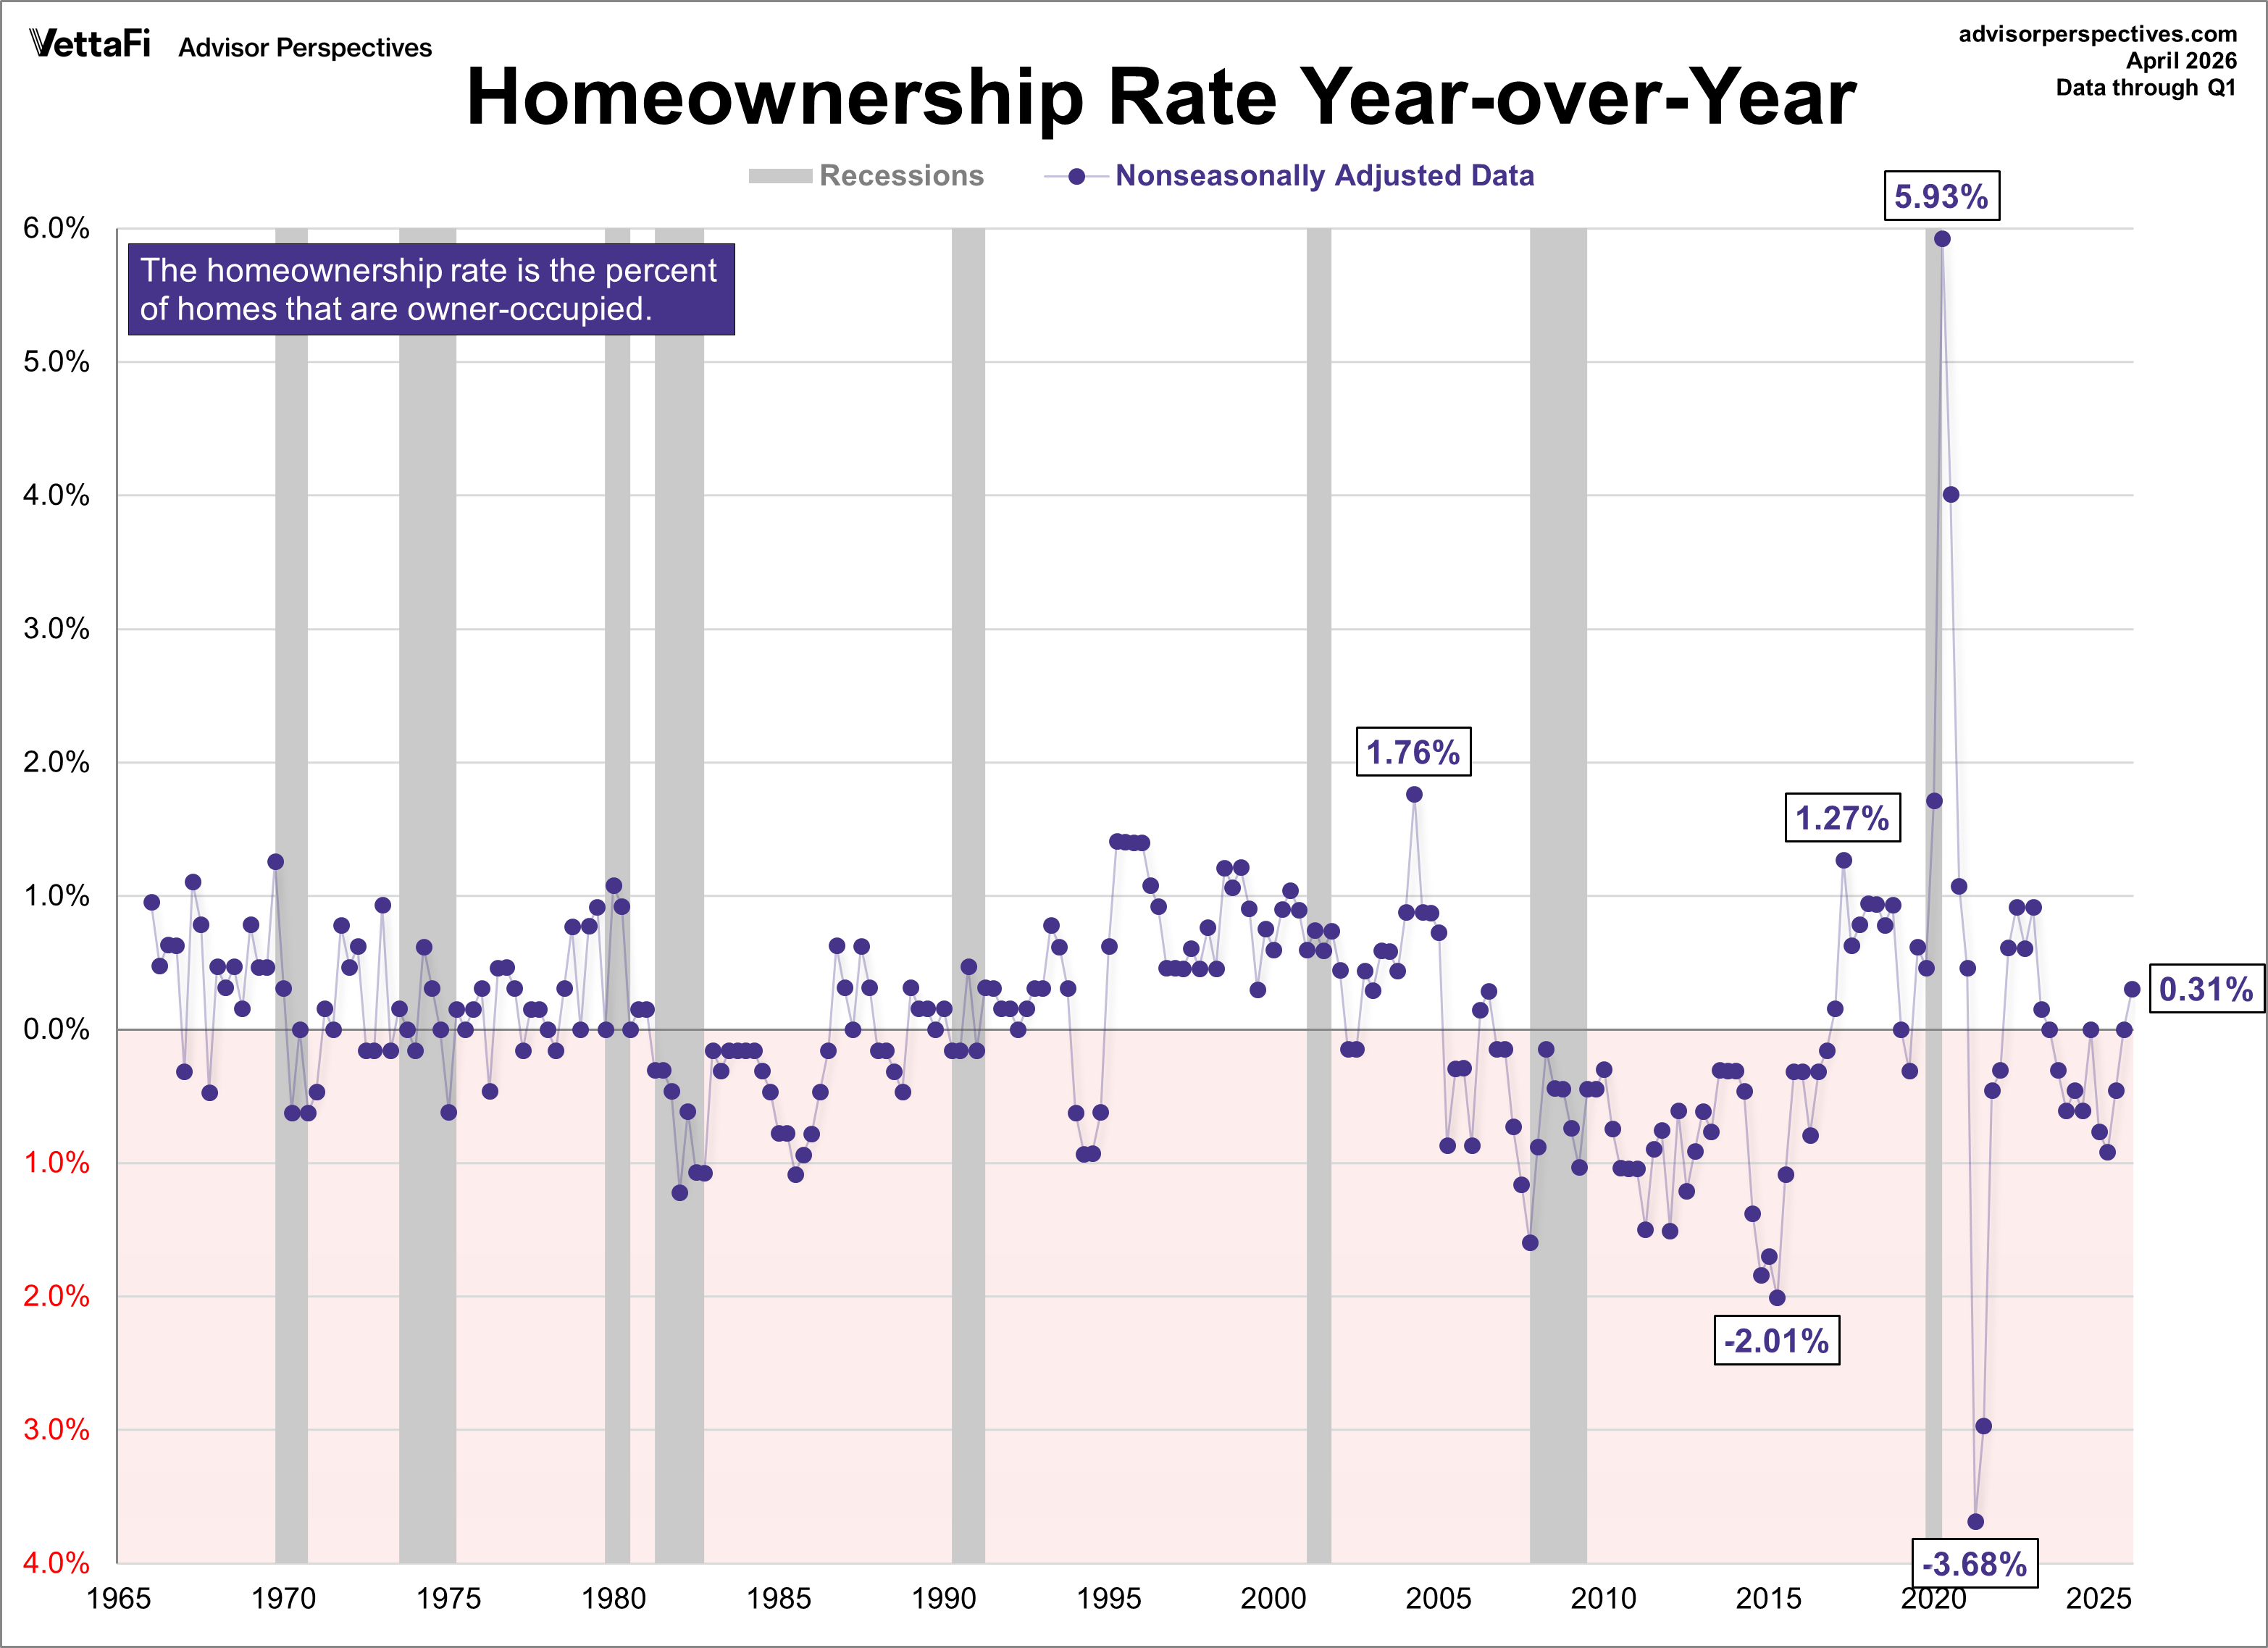
Here is the YoY version of the chart going back to 1965. The latest year-over-year change stands at 0.31%, the highest level in two years.
Homeownership Rates Across the Globe
The snapshot below gives us a crude comparison of the US homeownership rate compared to some select other countries. Our data source is a subset of the over 70 countries in this Wikipedia entry on homeownership. We included the more populous outliers at the top and bottom, China at 96.0% (2022) and Switzerland at 42.3% (2023).
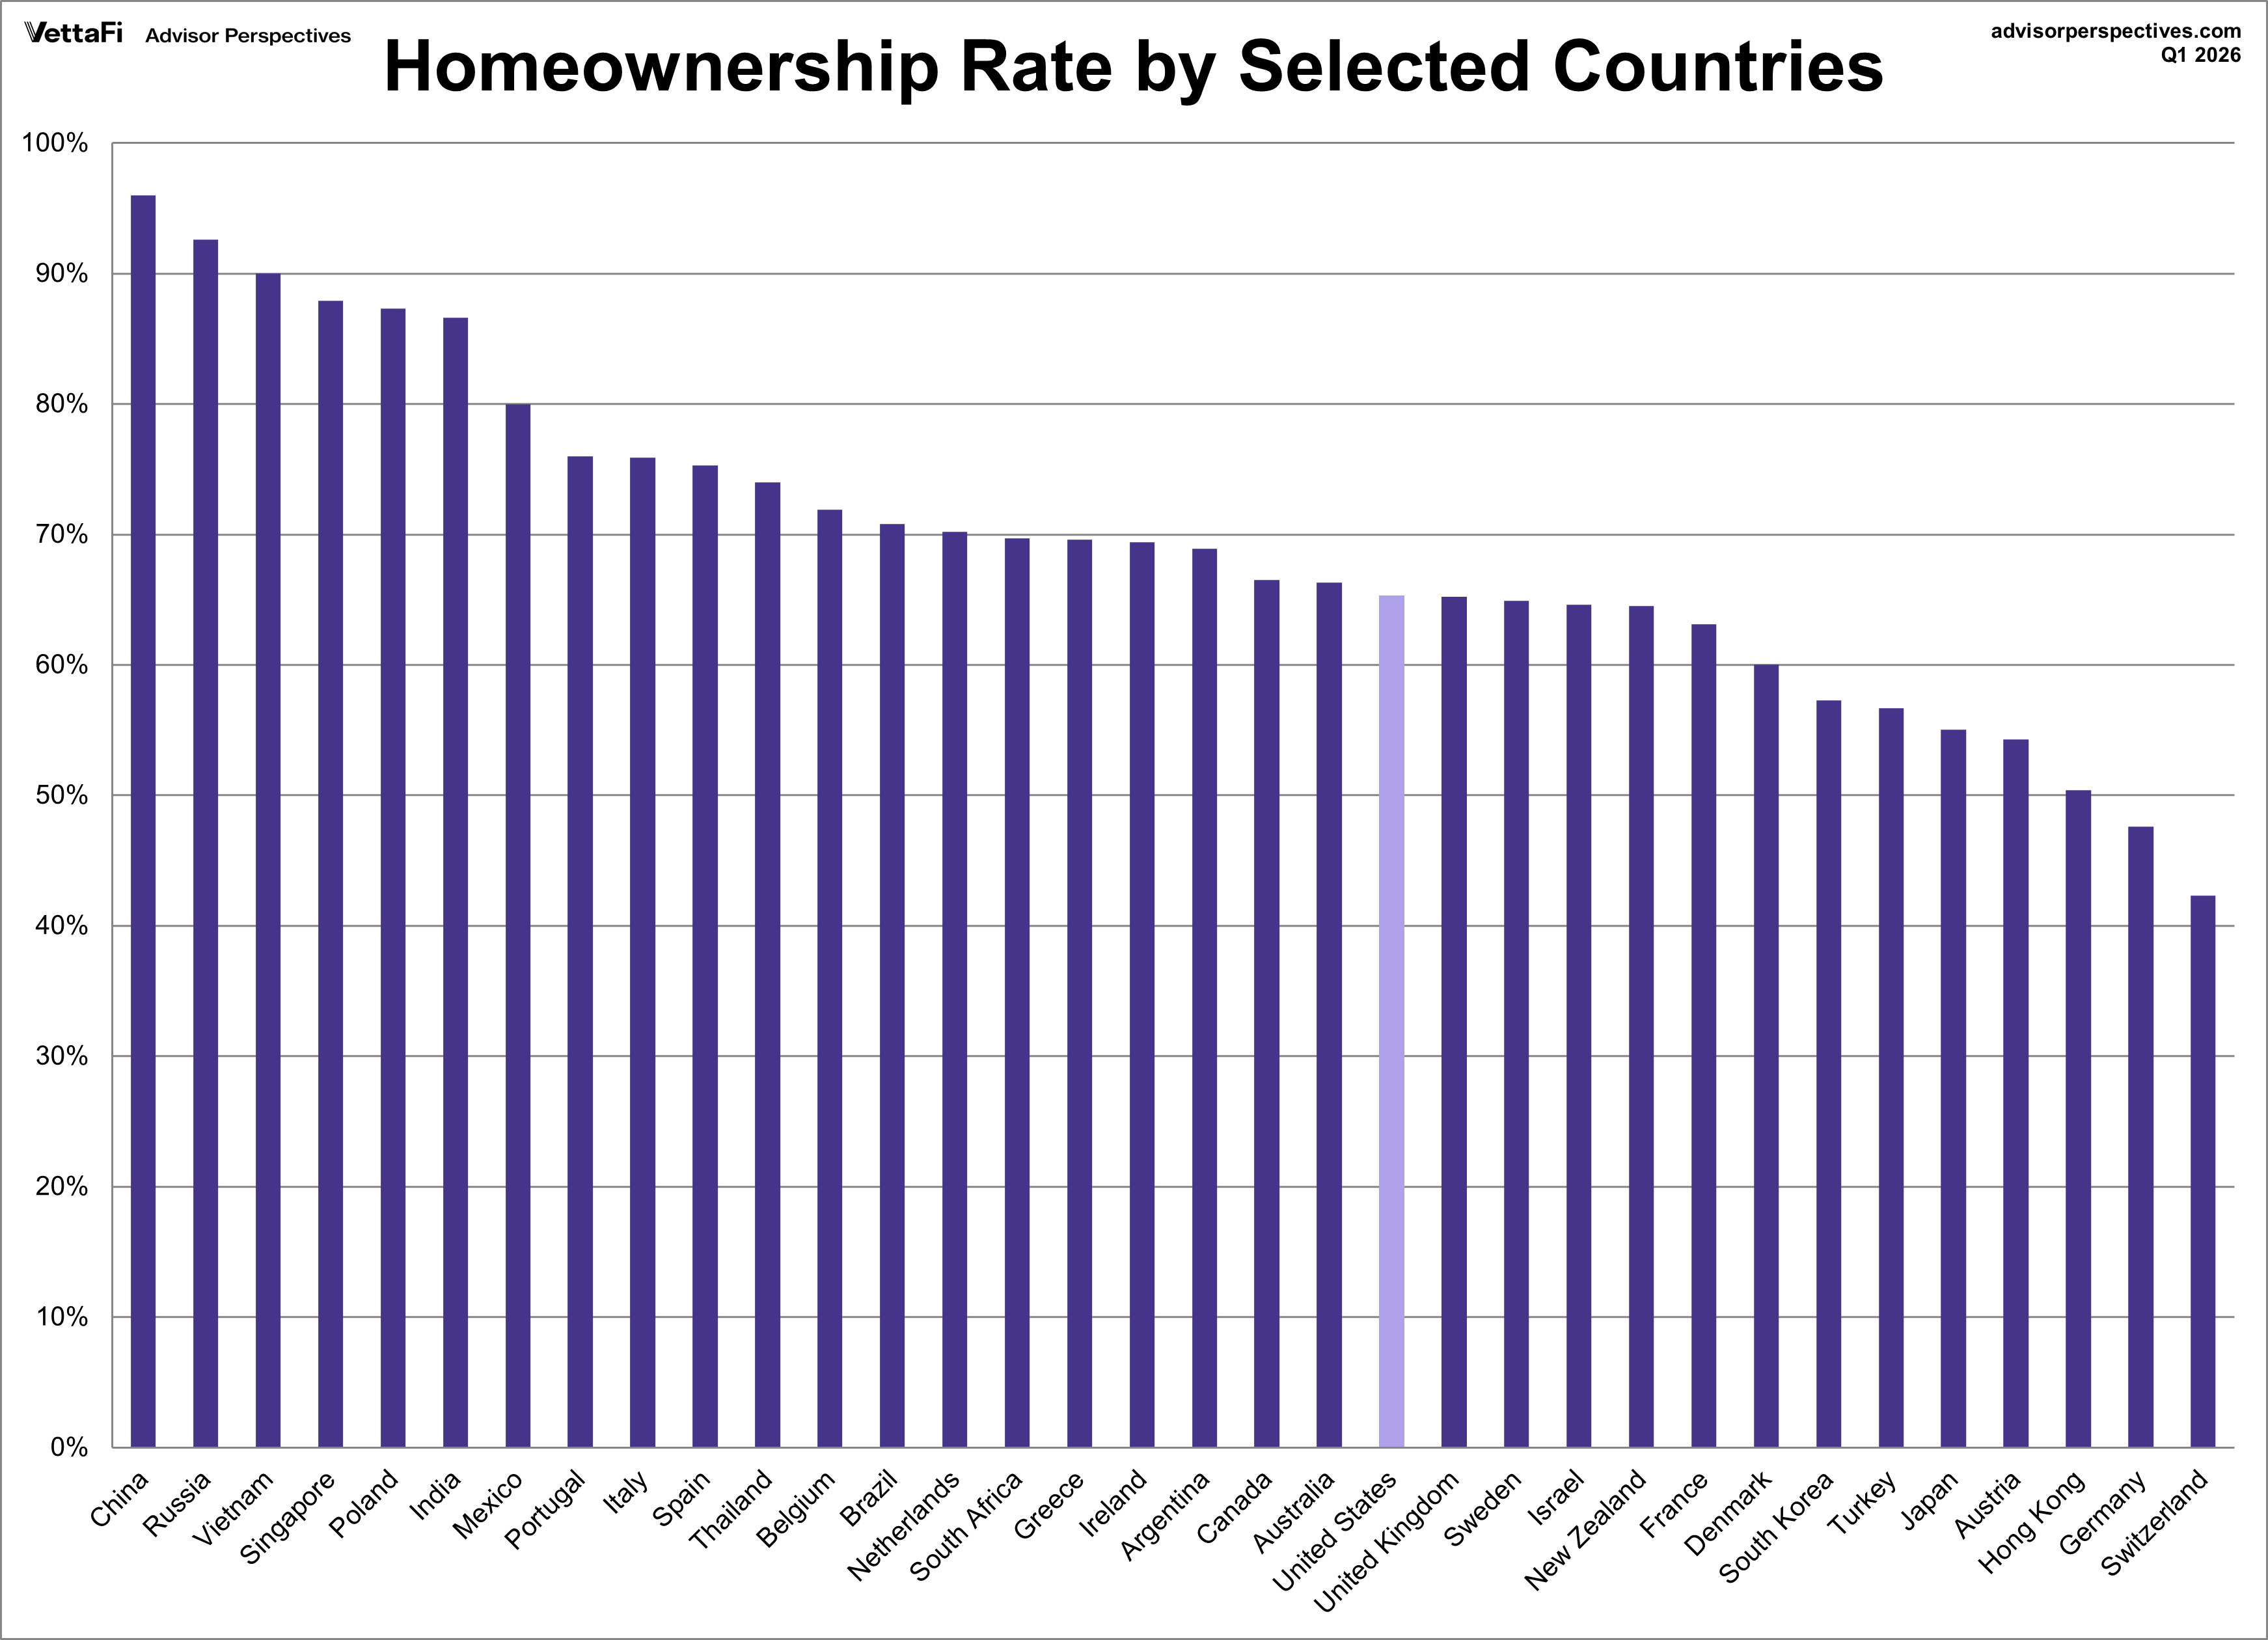
The underlying factors in the chart above are quite complex: Residential real estate affordability, financing options, household income distributions, demographics, and cultural values, to mention some of the more obvious.
ETFs associated with residential real-estate include: iShares Residential and Multisector Real Estate ETF (REZ).
For additional perspectives on residential real estate, here is the complete list of our monthly updates:
- S&P/Case-Shiller Home Price Index
- FHFA House Price Index
- NAHB Housing Market Index
- New Home Sales
- Existing Home Sales
- Pending Home Sales
- New Residential Housing Starts
- New Residential Building Permits


