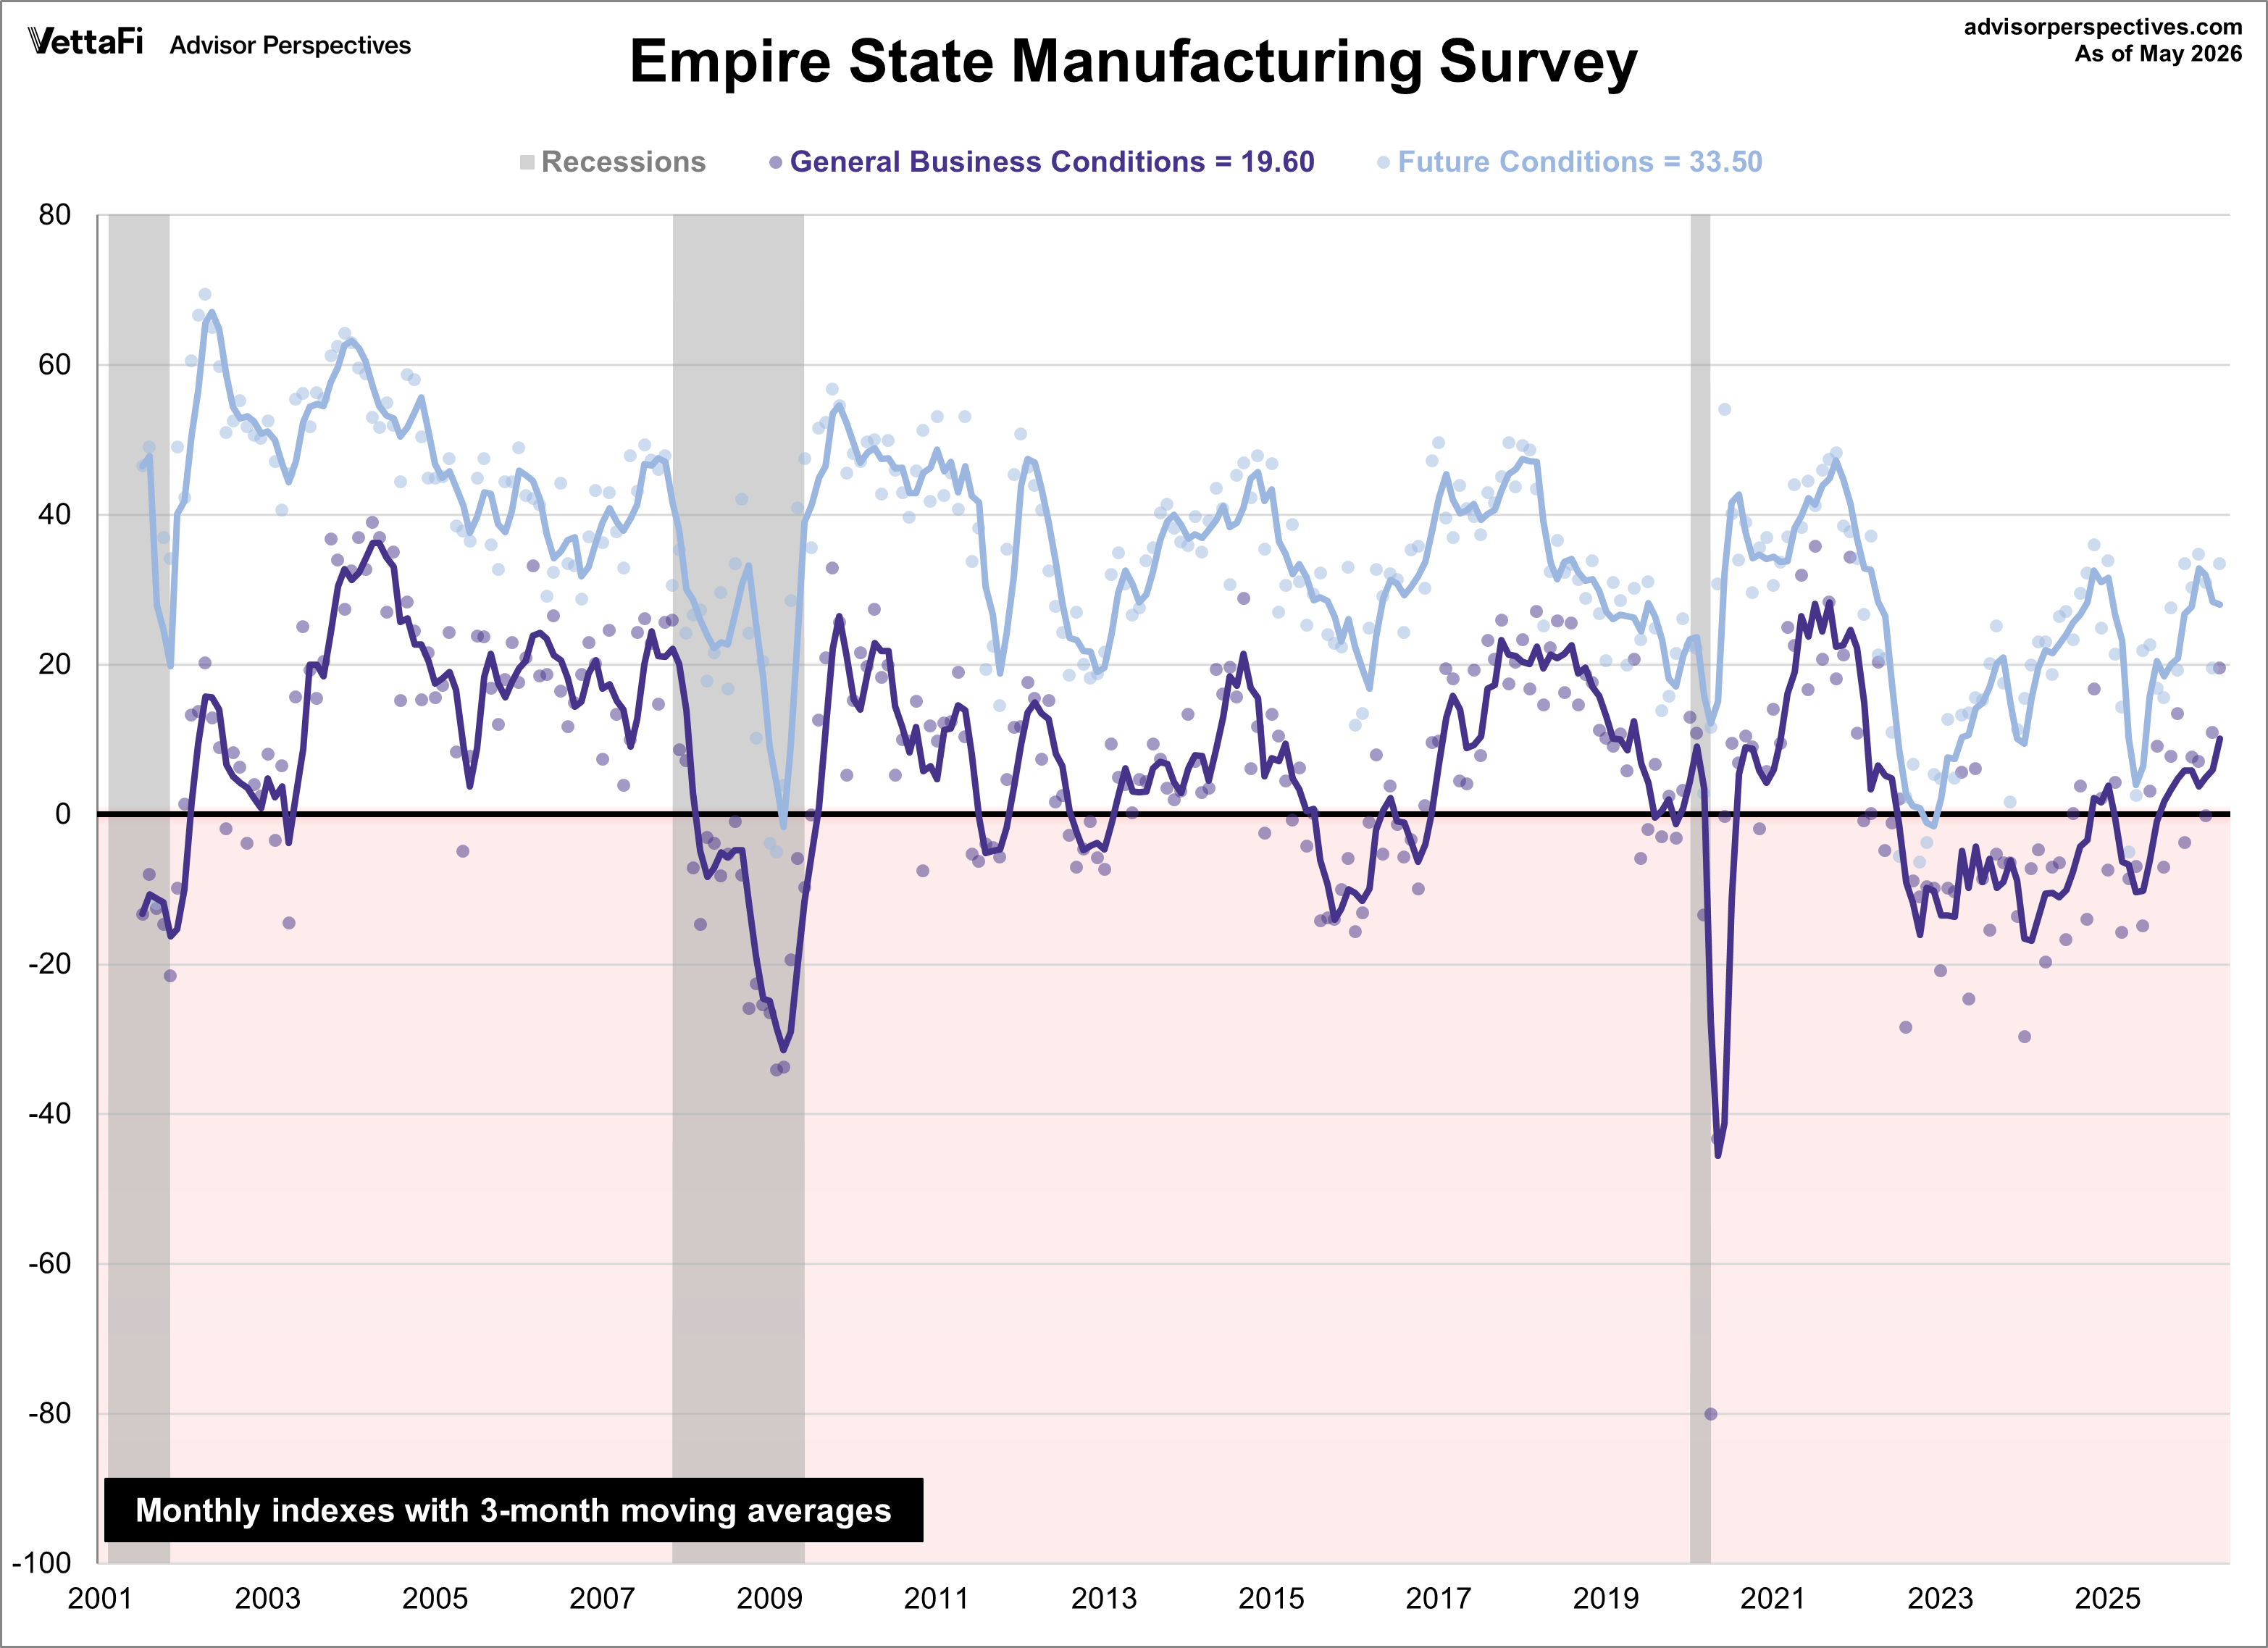
Manufacturing activity grew strongly in New York State, according to the Empire State Manufacturing May survey. The diffusion index for General Business Conditions rose 8.6 points to 19.6, its highest level in over four years. The latest reading was higher than the forecast of 7.3.
Here are details from the report.
ACTIVITY GROWS MARKEDLY
Manufacturing activity in New York State grew strongly, according to the May survey. The general business conditions index rose nine points to 19.6, its highest reading since April 2022. The new orders index rose three points to 22.7, its highest level in more than four years. The shipments index was little changed at 18.9, pointing to another solid increase in shipments. Unfilled orders increased for the fourth consecutive month. The delivery time index rose eight points to 20.4, a four-year high, and the supply availability index remained negative at -10.7, suggesting that delivery times were much longer and supply availability worsened. Inventories increased modestly.
PACE OF PRICE INCREASES JUMP
The index for number of employees was little changed at 8.3, and the average workweek index came in at 11.5, pointing to an ongoing increase in employment levels and hours worked. Both price indexes picked up to their highest levels since 2022. The prices paid index rose twelve points to 62.6, pointing to a sharp acceleration in input price increases for a second consecutive month, and the prices received index climbed ten points to 31.8.
Background on the Empire State Manufacturing Survey
The Empire State Manufacturing Index rates the relative level of general business conditions in New York state. A level above 0.0 indicates improving conditions, and below indicates worsening conditions. The reading is compiled from a survey of about 200 manufacturers in New York state.
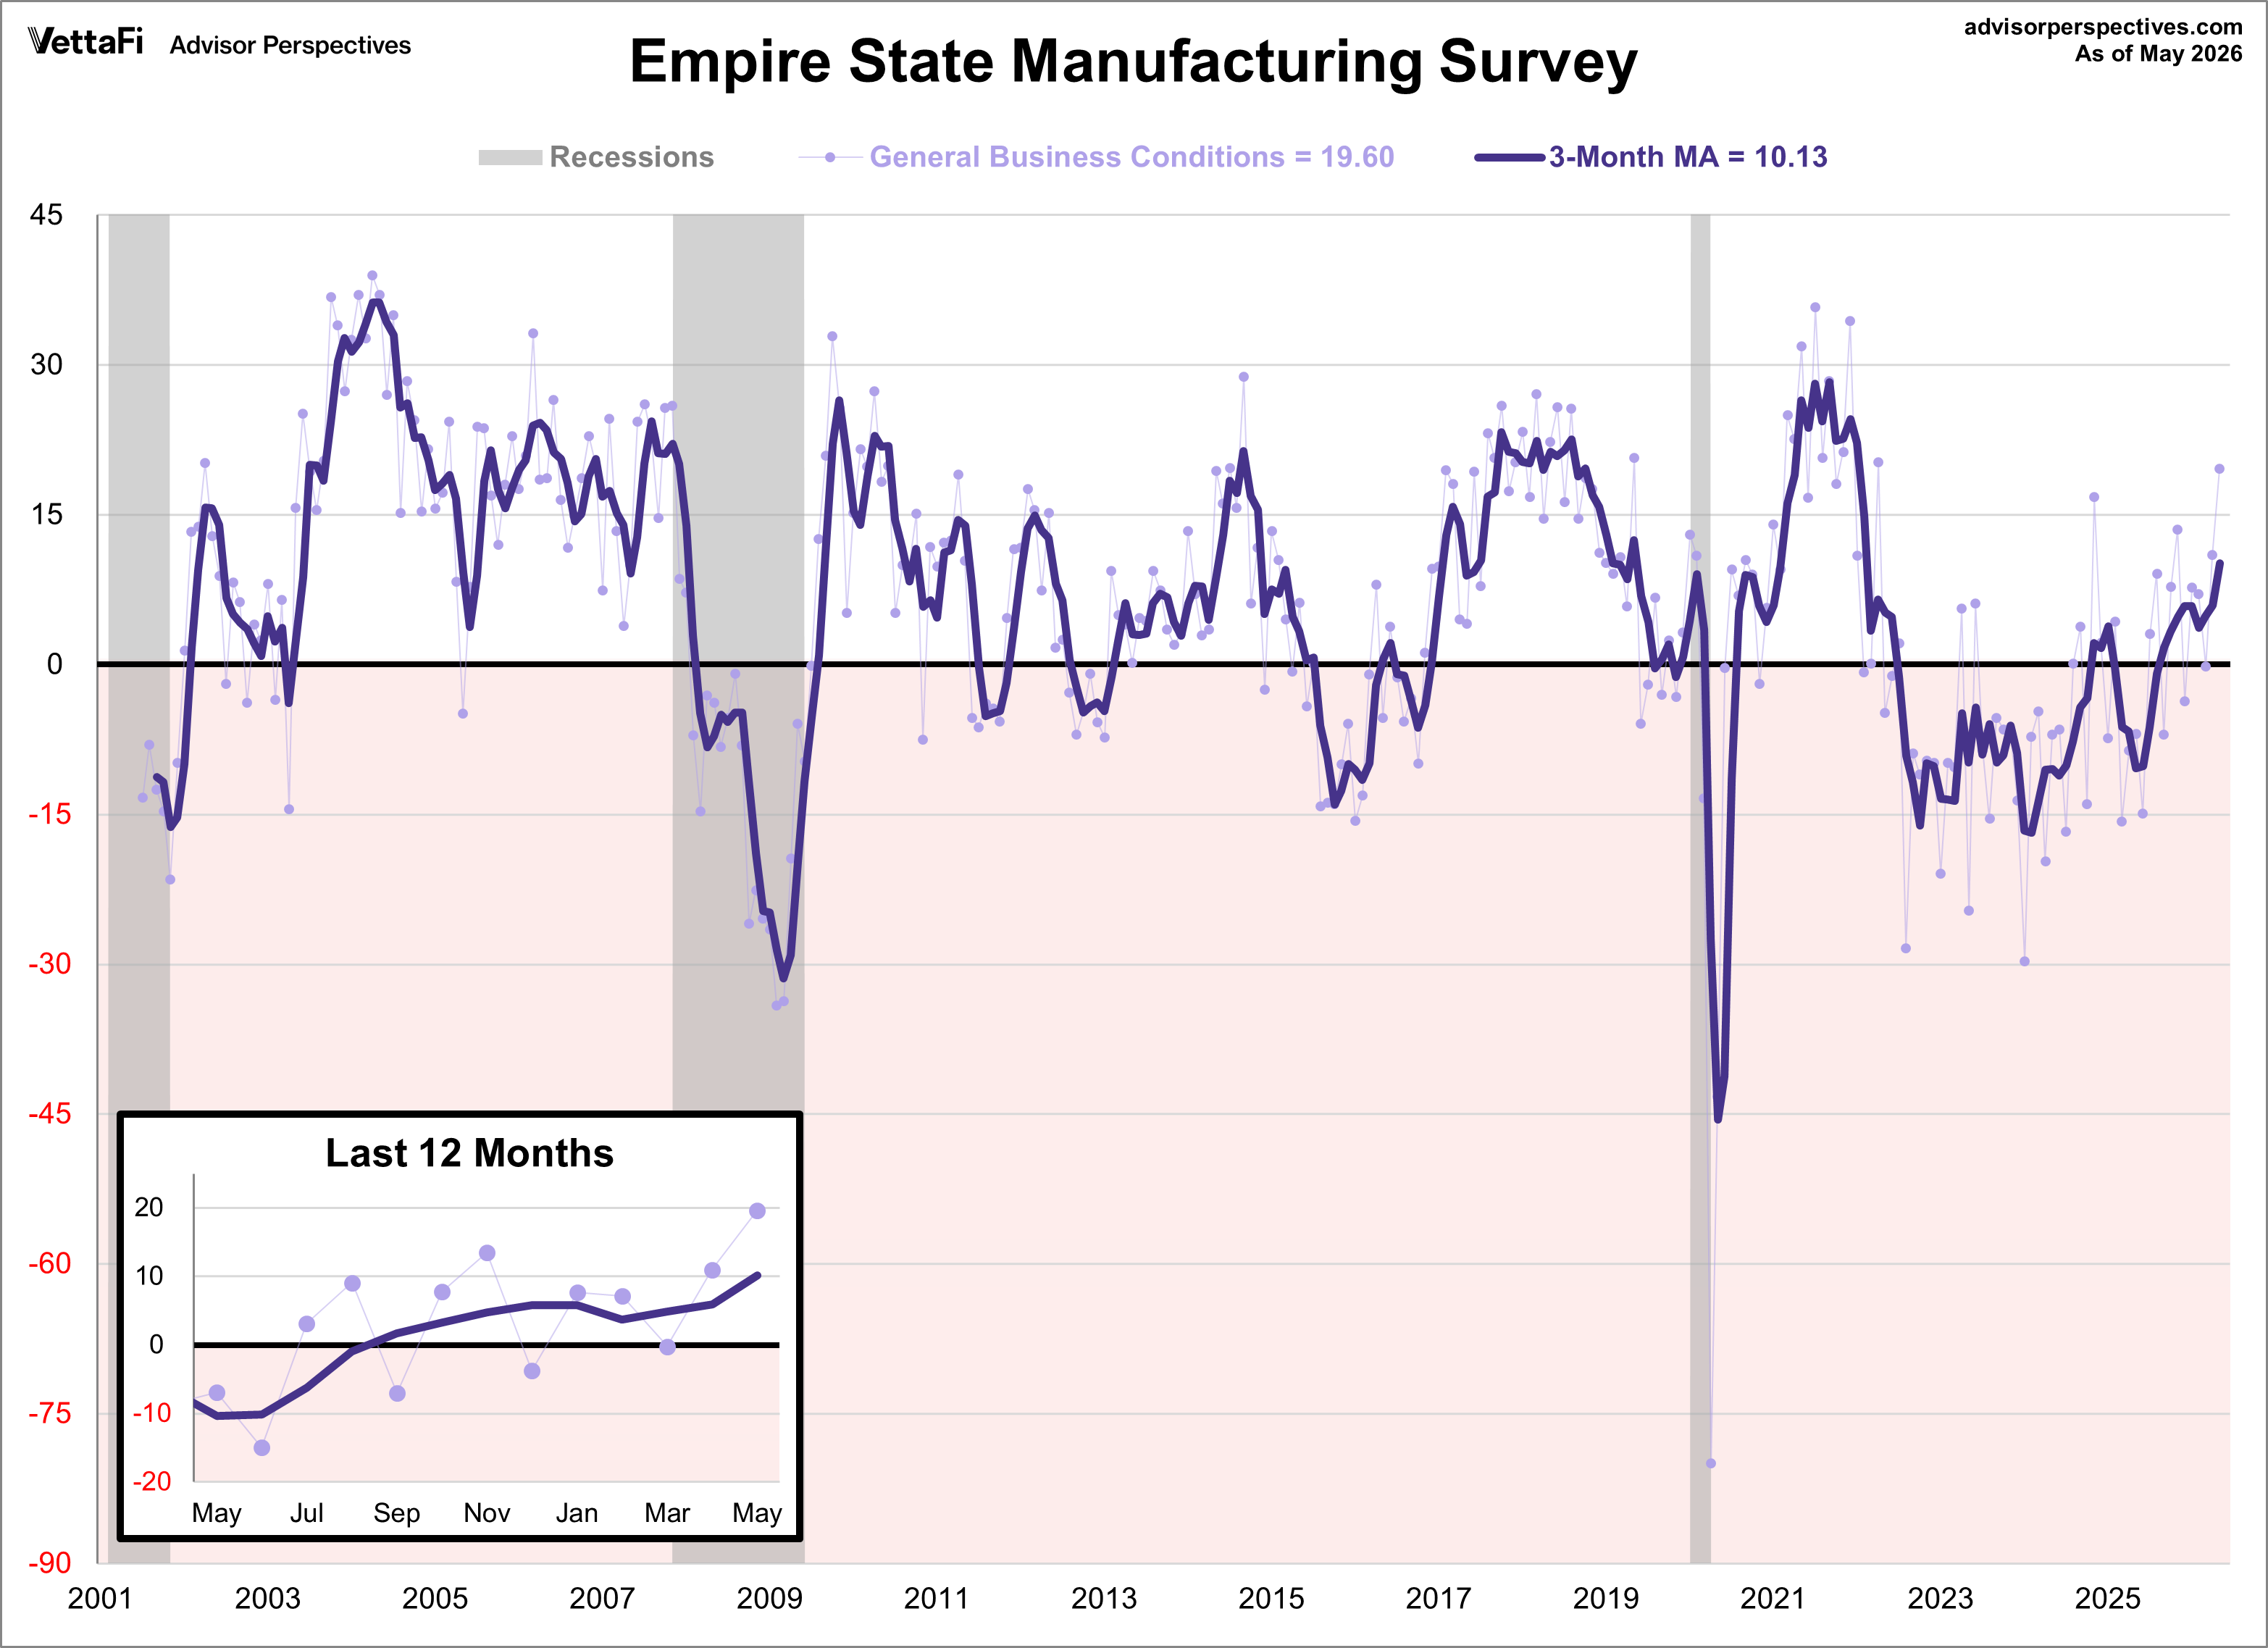
Below is a chart of the current conditions and its 3-month moving average, which helps clarify the trend for this extremely volatile indicator. The current 3-month moving average stands at 10.1, the ninth consecutive positive reading and highest level since early 2022.
Since this survey only goes back to July of 2001, we only have two complete business cycles with which to evaluate its usefulness as an indicator for the broader economy. Following the great recession, the index has slipped into contraction multiple times, as the general trend slowed. We saw a gradual decline in 2015 that rose back up in 2016, with a giant dip in 2020 due to COVID-19. The index quickly picked up again in 2021, declined for 2022, and gradually rose in 2023. The index kicked off 2024 with a sharp decline but rose during the back half of the year, reaching positive territory for the first time in over 2.5 years. Similarly, the index dropped into negative territory at the start of 2025 but crawled its way into positive territory starting in August.