
We all know someone who over-shares: the coworker too eager to discuss weekend adventures, or the friend who describes medical conditions in excessive detail. Yet even among those who hold no secrets, discussion of personal financial circumstances is usually taboo. It can therefore be difficult to judge how the average person is faring, economically.
Last month, the Federal Reserve released its triennial Survey of Consumer Finances (SCF), a unique and thorough view of the financial state of U.S. households. The collection is a substantial undertaking, with over 4,000 households surveyed; the sample is designed to ensure smaller cohorts are represented, like minorities and high net worth families. Interviews were conducted over the course of 2025, with respondents’ income details taken from their 2024 tax filings. Households were forthcoming, as the median interview duration was two hours.
See more: Policy Options Are Available Now to Lower U.S. Mortgage Rates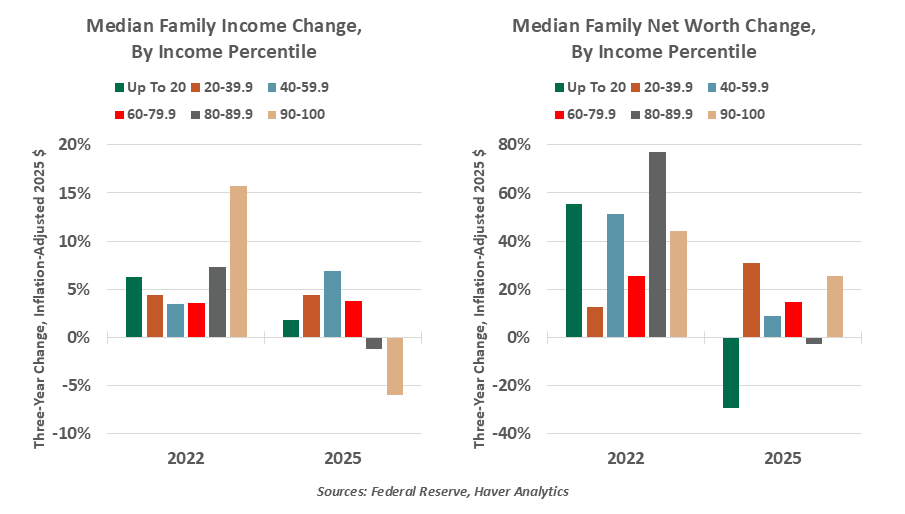
The overall picture is one of a consumer economy that is gaining, but with diverging fortunes. A subset of households indicated strain; the K-shaped economy has been difficult to arrest. Median measurements of indicators like wealth were often significantly different from their means, a sign of a wide and uneven distribution of results.
Real median family income rose 7% to $82,200 from 2021 to 2024, but real mean family income fell 6% to $125,200. In this case, the divergence was a step toward more equality. A tight labor market meant families at the lower ends of the income and net worth distributions saw increases in income, while high earners saw declines after adjusting for inflation.
High-end income volatility did not become a broad economic shock, as higher-income households enjoyed the greatest asset appreciation. Median net worth of families in the top income decile increased 25% to over $3.6 million, led by increasing values of stock portfolios.
All of this illustrates how economic gains in the past three years have been supported by wealth effects. People whose assets have gained value are spending more freely, even if those assets are illiquid. While the SCF does not inquire about spending, it does provide further evidence of diverging household wealth. About 66% of surveyed households own their home; their median real net worth climbed 6% to $458,900 (or a mean of over $1.8 million). Renters’ median net worth saw a net decline to only $10,600.
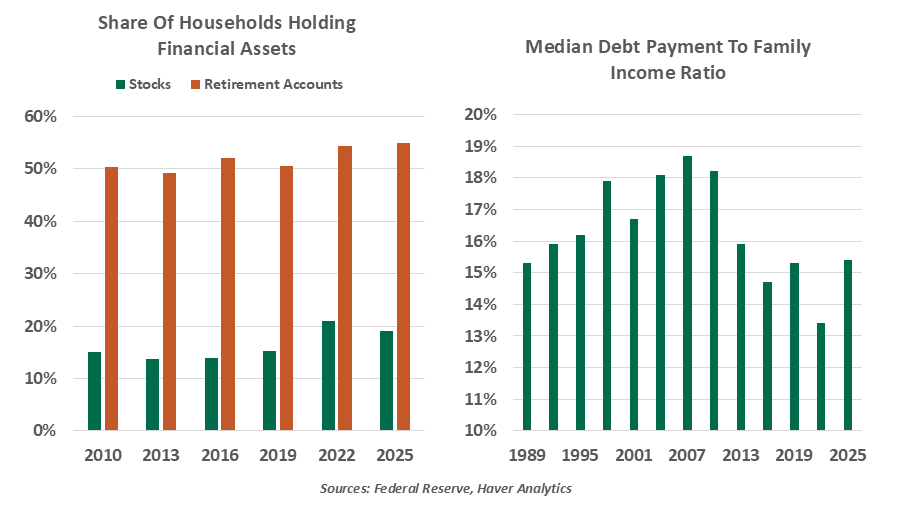
Conventional investments also showed good returns. Among the 19% of households owning stocks directly, the value of their holdings nearly doubled to $30,000. Retirement account participation hit a new record high of 55%, with median account values climbing 11% to $106,000.
Investments are broader than financial assets. In the pandemic and the recovery that followed, the rate of new business filings spiked and stayed elevated. The 2025 SCF shows that many of those businesses carried on. A record-high 15.4% of respondents reported an ownership stake in a private business.
Despite the general gains in income and wealth, families were more likely to be behind on their financial obligations than at any point since the 2010 SCF. The share of households that reported being behind on loan payments increased eight percentage points to nearly 20%. This result is consistent with trends reported by credit bureaus; rising delinquencies were one reason a recession was widely anticipated in 2023. Inflation took a toll on many household budgets.
Some trends were amplified by the pandemic recovery. The 2022 SCF showed the tailwinds of the pandemic response: stimulus money and disrupted spending had bolstered savings, while an overheated labor market was pushing up wages. The share of respondents holding stocks in the latest SCF fell by two percentage points from the prior reading as savings were depleted.
Borrowers also reckoned with higher interest rates between the two survey collections; the Fed’s hiking cycle started in March 2022. The median debt payment-to-income ratio rose 2 percentage points from 2022 to 2025, reaching 15.4%. The share of highly-indebted families, with debt payment-to-income ratios above 40%, increased to 11.1% from 8.4%. While leverage remains generally lower than the levels that precipitated the Global Financial Crisis, this approaches a high water mark last seen in the 2013 survey.
The consumer economy has undergone many changes since the survey was taken a year ago. Labor markets and most investments have persevered through renewed uncertainty, but inflation has remained a scourge. Some strain may be in store as spending cuts to entitlements in the “One Big Beautiful” reconciliation bill come into force; families receiving SNAP nutrition support or Medicaid health coverage will face strict standards and lower benefits. Some of these cuts may be rolled back by the incoming Congress.
The 2025 SCF offers a helpful recap of the eventful start to the decade. Households weathered a series of disruptions rather well, with the lowest earners seeing bigger percentage gains in their income amid post-pandemic labor tightness. While some better-off households felt a squeeze in their wages, their overall wealth enabled them to continue spending.
We may not talk much about our own finances, but we can take quiet comfort in the outcome of the SCF. American households continue to progress, even though they don’t boast about it.
A message from Advisor Perspectives and VettaFi: Discover something new! Click here to register for our upcoming webcasts.
Information is not intended to be and should not be construed as an offer, solicitation or recommendation with respect to any transaction and should not be treated as legal advice, investment advice or tax advice. Under no circumstances should you rely upon this information as a substitute for obtaining specific legal or tax advice from your own professional legal or tax advisors. Information is subject to change based on market or other conditions and is not intended to influence your investment decisions.
© 2026 Northern Trust Corporation. Head Office: 50 South La Salle Street, Chicago, Illinois 60603 U.S.A. Incorporated with limited liability in the U.S. Products and services provided by subsidiaries of Northern Trust Corporation may vary in different markets and are offered in accordance with local regulation. For legal and regulatory information about individual market offices, visit northerntrust.com/terms-and-conditions.
