Key takeaways
-
Economic composition and growth have been similar, and the stock market has typically risen the year after midterms no matter the party composition of government.
-
Monetary policy, how the Federal Reserve manages interest rates, often matters more to the market than midterm elections.
-
Historically, staying invested during all configurations of government had better results than investing only when a certain party is in power.
The voters have spoken, and they’ve decided that divided government is the best path forward. Democrats have been handed a majority in the House and Senate where they’ll have to work with a Republican president to manage the country’s financial well-being. What does history tell us about markets and the economy under divided rule? Here are four things that investors should consider.
Politicians have yet to completely re-engineer the economy or dramatically alter economic growth
Investors are often concerned elected officials will drastically change the economy. However, the composition of the US economy and economic activity have remained fairly consistent for decades, regardless of who’s been in office. Government expenditures, business investment, and consumption represent largely similar portions of gross domestic product (GDP) today as they did in 1956.1
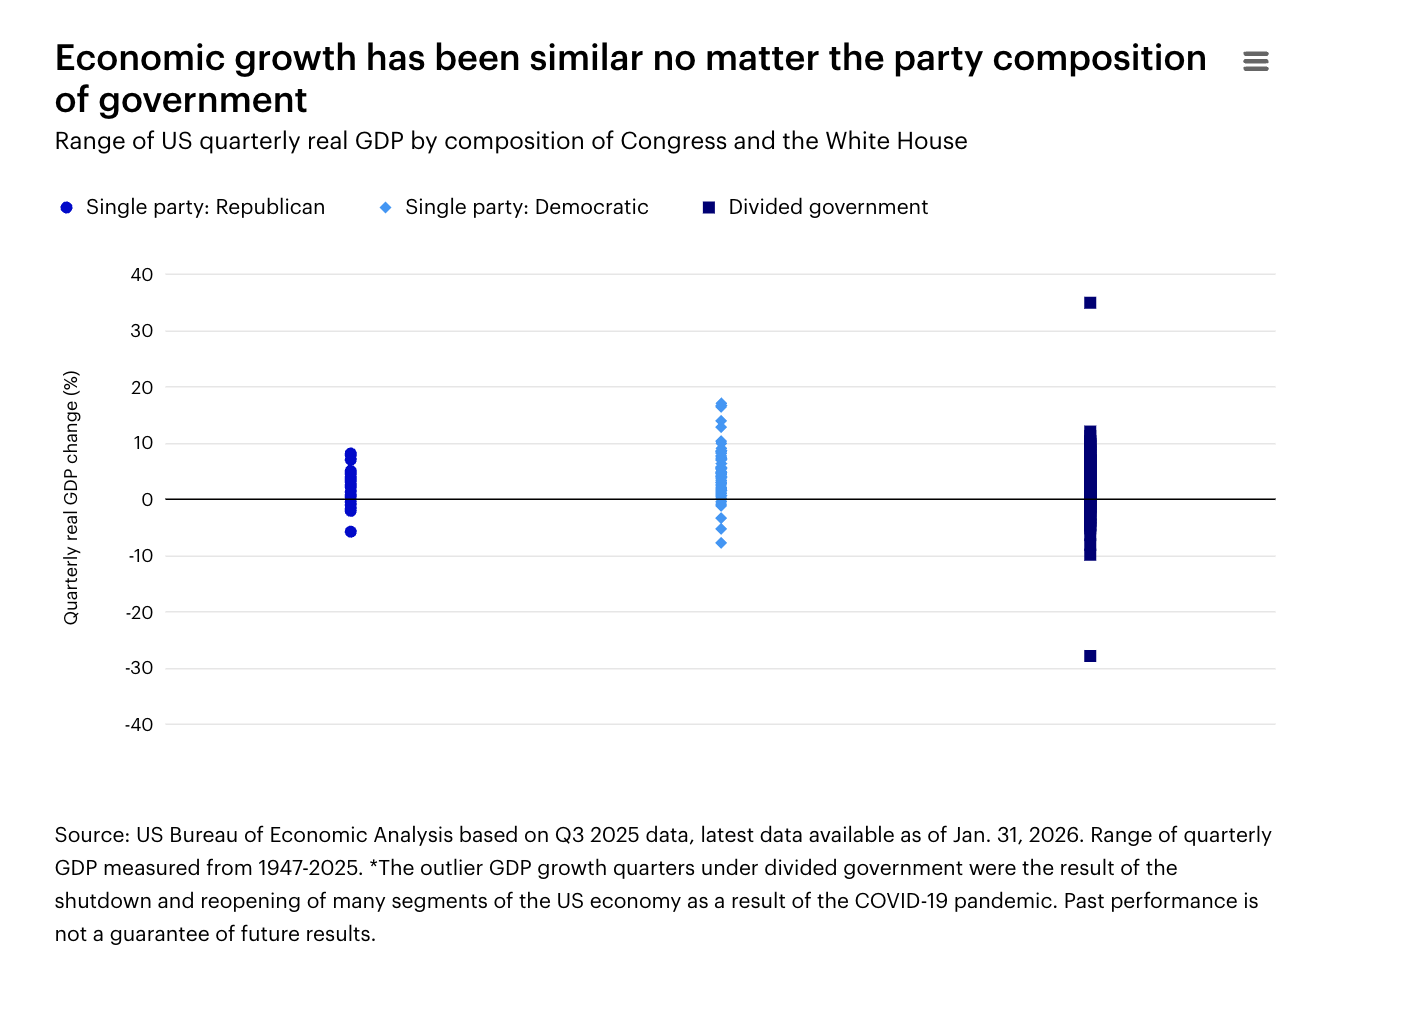
For markets, monetary policy often matters more than midterm elections. As shown below, the median annualized quarterly percent change in US GDP has been remarkably similar during single-party and divided-government rule. (The outlier GDP growth quarters under divided government were the result of the shutdown and reopening of many segments of the US economy as a result of the COVID-19 pandemic.)
See more: What Midterm Results Mean for Policy and Data Center Risk
Markets have performed well under single-party rule and different types of divided government
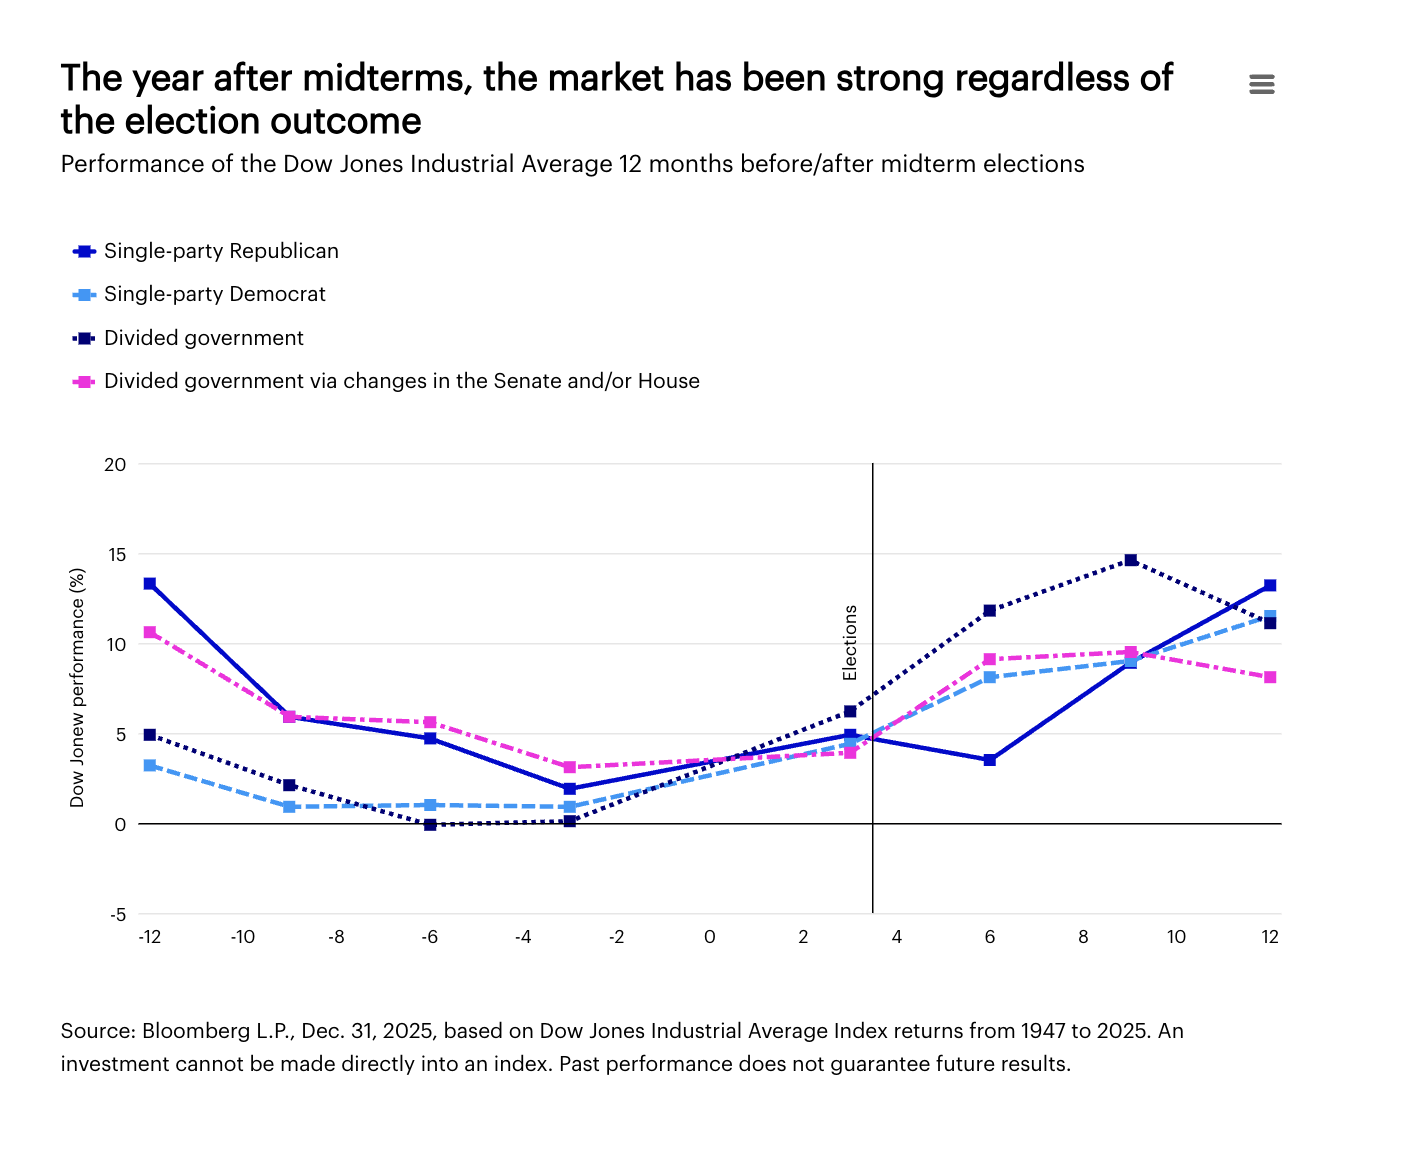
Markets have historically tended to generate their weakest returns in a president’s second year (the year leading up to midterms). Markets have posted strong average returns in year three of the presidential cycle, directly after midterms.2
Despite the common misconception that markets prefer divided government, performance the year after midterms has tended to be strong regardless of the election outcome. Historically, markets have performed well under single-party rule and different combinations of divided government.
Most investors have historically been better off staying fully invested
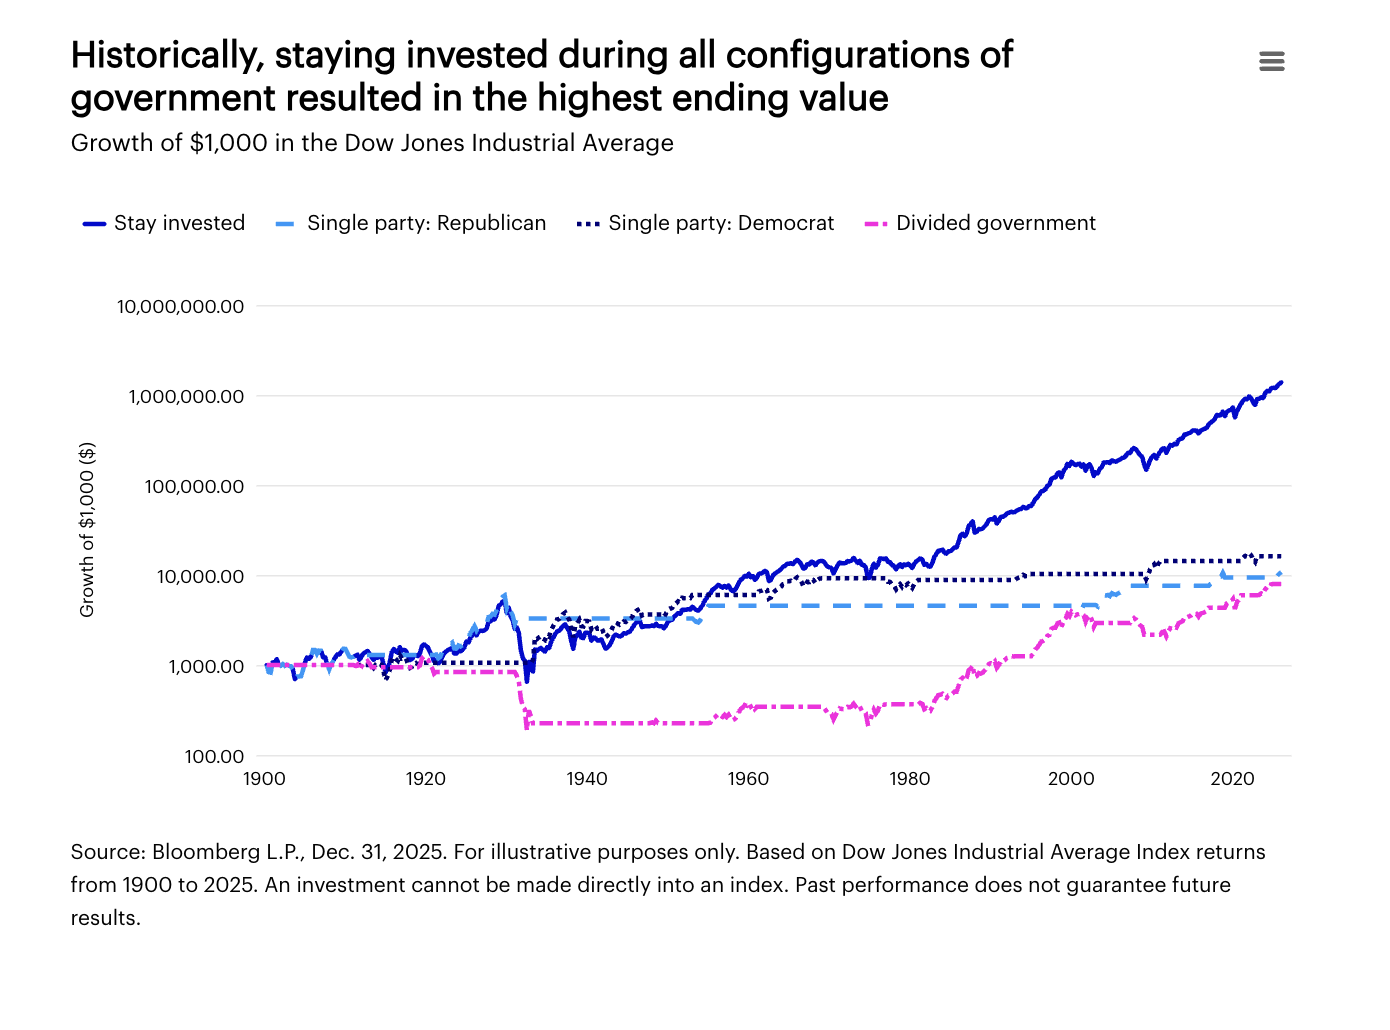
The market’s long-term advance has endured across multiple administrations and combinations of government. As shown below, a hypothetical portfolio that stayed fully invested through both Democratic and Republican administrations has performed better over the long term than one invested only when one party was in power, or only during divided government.
The more time investors have spent in the market — regardless of the party in the White House — the better.
Encourage clients to not let election outcomes disrupt long-term investment plans.
Footnotes
Source: US Bureau of Economic Analysis as of Jan. 31, 2026.
Source: Bloomberg L.P., Dec. 31, 2025. Year 1 average return 8.2% Year 2 average return 6.0% Year 3 average return 16.8% Year 4 average return 6.3 % based on Dow Jones Industrial Average Index returns from 1947 to 2025. Figures are by year of presidential cycle. An investment cannot be made directly into an index. Past performance does not guarantee future results.
Important information
NA6070081
Photo credit: Andriy Blokhin / Adobe Stock
All investing involves risk, including the risk of loss.
Past performance does not guarantee future results.
Investments cannot be made directly in an index.
This does not constitute a recommendation of any investment strategy or product for a particular investor. Investors should consult a financial professional before making any investment decisions.
Gross domestic product (GDP) is the total value of goods and services produced in a year.
The S&P 500® Index is a market-capitalization-weighted index of the 500 largest domestic US stocks.
The Dow Jones Industrial Average is a price-weighted index of the 30 largest, most widely held stocks traded on the New York Stock Exchange.
In general, stock values fluctuate, sometimes widely, in response to activities specific to the company as well as general market, economic, and political conditions.
The opinions referenced above are those of the author as of October 27, 2026. These comments should not be construed as recommendations, but as an illustration of broader themes. Forward-looking statements are not guarantees of future results. They involve risks, uncertainties and assumptions; there can be no assurance that actual results will not differ materially from expectations.
A message from Advisor Perspectives and VettaFi: Discover something new! Click here to register for our upcoming webcasts.
More Innovative ETFs Topics >