Money's Non-Inflationary Benchmark
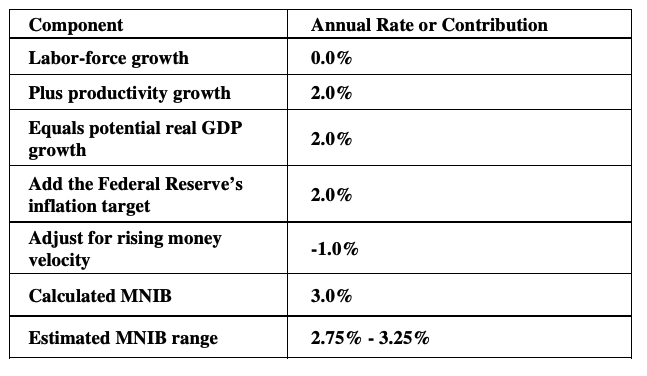
Milton Friedman famously said, “inflation is always and everywhere a monetary phenomenon,” emphasizing that sustained inflation occurs when money expands persistently faster than real output. This relationship provides the foundation for Money’s Non-Inflationary Benchmark (MNIB) which is the rate of money growth consistent with the economy’s productive capacity and the Federal Reserve’s inflation target, adjusted for the trend in money velocity (V). The calculation is as follows:
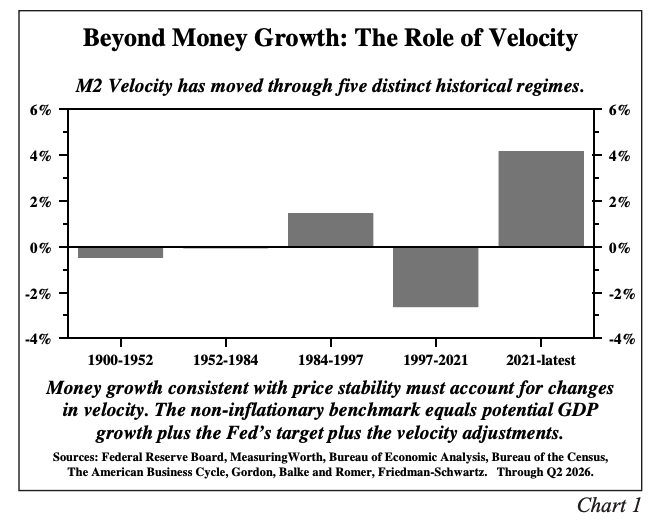
Beyond Money Growth: Inflation, Output, and the Role of Velocity
Friedman’s framework linked long-run money growth to real economic growth (labor force and productivity). While Friedman recognized inflation also depends on V he made no allowance since he believed it was stable. Since 1900, there have been five V regimes (Chart 1). M2 V declined 0.47% per year from 1900–1952, then was essentially flat from 1952–1984. This small change, combined with technical redefinitions, was not economically meaningful. V then rose 1.44% per year (1984–1997), fell 2.62% (1997–2021), and rose 4.16% (2021–mid-2026). The 1950s–1984 stability shaped Friedman’s view of V as stable. This shows why MNIB based on real growth must also account for V changes.
See more: Five Key Questions for Third-Quarter Earnings Season
Inflation Is Not Mean Reverting
History shows stable prices require an active, credible monetary regime, not just time or mean reversion. When Paul Volcker became Federal Reserve chairman in 1979, 12-month PCE inflation was about 9.3%, the federal-funds rate averaged 10.9%, and M2 was growing 8.5%—about 3 points above a 5.5% MNIB for that era. This was relevant because M2 V had been stable for decades. While the labor-force and productivity mix was different, the scale of monetary excess then and now is similar. Recently, M2 grew at a 6.5% annualized rate (Dec. 2025–Sep. 2026), with a current MNIB of about 3%–3.5% after adjusting for growth, the Fed’s 2% target, and rising V. Volcker saw incremental rate hikes as inadequate, so on Oct. 6, 1979, the Fed overhauled its procedures, emphasizing control of bank reserves and money growth.
The Powell-led Fed (2018–2026) illustrates the risk of delaying monetary restraint after inflation exceeds target. PCE inflation climbed above 2% in March 2021, but the Fed waited until March 2022 to raise rates. At the 2021 breach, M2 was growing about 24%—20 points above a 4% MNIB (assuming stable V). Pandemic-driven V collapse initially absorbed some excess, but V turned upward in late 2021 and continued higher in 2022, adding spending pressure. By the time of the first rate hike, PCE was 6.1% (triple the target), yet the funds rate remained 0%–0.25%. As of January 2022, M2 was still up 11.7%, nearly eight points above MNIB. As V rose, MNIB declined further. The Fed’s delay gave mean reversion time, but inflation persisted above 2% for 66 straight months, reaching 3.4% in August 2026.
Research shows inflation persistence varies and does not disappear on its own. Poorly anchored expectations make price and wage shocks more persistent, requiring active monetary policy (Tetlow, 2018). IMF studies show inflation shocks last longer with weak expectations but subside faster under credible monetary regimes. Countries with strong inflation targets see less persistence. Mean reversion depends on institutional credibility.
Post-pandemic evidence supports this. A 2024 Fed study found inflation became more inertial in major economies, even adjusting for energy and supply shocks. The Bank of England found shortterm household inflation expectations recently produced persistent, nonlinear effects that raised trend inflation. U.S. firm-level data show businesses often overreact to marginal costs, making inflation more backward looking. Other research shows short-term inflation expectations shape pricing and wage decisions. Collectively, these findings show elevated past inflation can become embedded in expectations and behavior, making it more persistent and harder to reduce (Hajdini et al., 2025; Abberger et al., 2024).
The Demographic Issue
Demographic changes directly affect monetary policy. Slower population and labor-force growth reduce the economy’s ability to absorb more money without chronic inflation and lower MNIB. Meanwhile, deglobalization, rising capital demands, weak saving, and heavy borrowing reinforce inflation and push long-term rates higher.
The CBO, Census Bureau, and private analysts project much slower U.S. population growth due to declining fertility, aging, and weaker immigration. January 2026 CBO estimates further lowered growth, with deaths exceeding births by 2030. Recent immigration declines may make even these projections optimistic. Any further visa restrictions could reduce net immigration. Since projections rely heavily on immigration, small changes have large long-term effects.
The U.S. labor force has shrunk modestly since January. The labor force is one of two components of potential real GDP growth. Though short-term immigration data don’t directly measure net population growth, they signal demographic shifts. If current policies persist, population growth will likely remain below projections.
The Productivity Issue
Some believe advances in AI, automation, and computing will sharply accelerate U.S. productivity. While these technologies have potential, translating them into much higher aggregate productivity is difficult due to the U.S. economy’s structure. Government outlays are about 35.3% of GDP, and service jobs outnumber goods-producing jobs 5.3 to 1 (as of September 2026). Most employment growth is in labor-intensive sectors—health care, social assistance, hospitality—where productivity gains are more difficult to implement. Even if AI delivers significant gains, they may not reach enough dominant sectors to shift aggregate growth much.
A less visible force dampening productivity is the loss of economies of scale. Globalization expanded markets and specialization, but its retreat—via trade barriers, fragmentation, and duplicated supply chains—reduces scale and raises capital needs. More resources now go to political or policy objectives instead of economic efficiency.
As Bastiat noted, economic decisions have both seen and unseen effects.
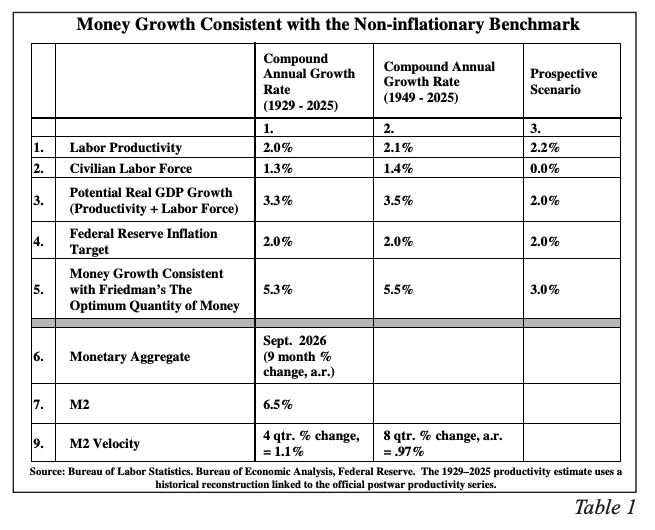
Can major technological advances overcome these structural restraints? Despite steady innovation, long-run U.S. productivity growth remains near 2% (Table 1). A large government footprint, a servicesheavy economy, diminishing scale gains, and rising federal interest costs all weigh against faster aggregate productivity growth. Some sectors may benefit, but broad gains may not follow.
Conclusion
Third-quarter developments reaffirm our view that the U.S. economy is contending with a significant capital shortage in a new, postdisinflationary era. The powerful forces that held inflation in check from 1990 to 2020—globalization, expanding labor supply, abundant productive capacity, falling capital costs, and declining money V—have either diminished or reversed. Today, laborforce growth is stagnant or declining, globalization is fragmenting, supply chains are becoming more expensive, and surging capital needs for technology, energy, defense, and reindustrialization are colliding with low domestic savings. Net national saving averaged well below historical norms in the first half of 2026.
The federal budget deficit is projected to approach 6% of GDP in 2026—unusually high for this stage of expansion. In past late-cycle expansions, deficits were much smaller. Today’s large deficits further erode national saving, leaving less capital for private investment and increasing competition for funds.
Monetary conditions add challenges. With limited productivity gains and a stagnant labor force, potential real GDP growth is about 2%. Adding the Fed’s 2% inflation target yields nominal potential growth of 4%. However, because M2 V is rising, MNIB is in the vicinity of 3%. M2 growth since late 2025 has been 6.5% or roughly double MNIB, risking nominal spending outpacing productive capacity and keeping inflation above target.
Long-term government bond yields in several major economies are near their highest levels in decades, intensifying competition for global savings. Higher foreign yields can divert funds from U.S. Treasuries, while fiscal and inflation concerns abroad can spill over, raising risk premiums. These cross-border effects reinforce upward pressure on U.S. borrowing costs.
Together, these factors imply higher yields for long-term Treasury bonds (over 20 years). Low saving and heavy government borrowing are pushing up real rates, while rapid money growth risks fueling a money-price-wage spiral and higher expected inflation. Fiscal uncertainty and inflation volatility increase risk premiums. Temporary factors may lower inflation, but until money growth aligns with MNIB—reflecting potential output, the Fed’s 2% target, and V—risks of more inflation and rising yields will persist.
Van R. Hoisington
Lacy H. Hunt, Ph.D.
DISCLOSURES
Hoisington Investment Management Company (HIMCo) is a federally registered investment adviser located in Austin, Texas, and is not affiliated with any parent company.
The information in this market commentary is intended for financial professionals, institutional investors, and consultants only.
Retail investors or the general public should speak with their financial representative. Information presented is for educational purposes only and does not constitute an offer or solicitation for the sale or purchase of any securities, investment products or advisory services.
Information herein has been obtained from sources believed to be reliable, but HIMCo does not warrant its completeness or accuracy; opinions and estimates constitute our judgment as of this date and are subject to change without notice. This memorandum expresses the views of the authors as of the date indicated and such views are subject to change without notice. HIMCo has no duty or obligation to update the information contained herein. This material is intended as market commentary only and should not be used for any other purposes, including making investment decisions. Certain information contained herein concerning economic data is based on or derived from information provided by independent third-party sources. Charts and graphs provided herein are for illustrative purposes only.
This memorandum, including the information contained herein, may not be copied, reproduced, republished, or posted in whole or in part, in any form without the prior written consent of HIMCo.
A message from Advisor Perspectives and VettaFi: Discover something new! Click here to register for our upcoming webcasts.
© Hoisington Investment Management
More Market Indicators Topics >